2465
QALAS + QSM: Efficient Multi-parameter Mapping Allows Disentangling Para- and Dia-magnetic Contributions in Brain Tissue1Department of Electrical and Computer Engineering, Seoul National University, Seoul, Korea, Republic of, 2Department of Electrical Engineering and Computer Sciences, University of California, Berkeley, Berkeley, CA, United States, 3Athinoula A. Martinos Center for Biomedical Imaging, Massachusetts General Hospital, Charlestown, MA, United States, 4Fetal-Neonatal Neuroimaging and Developmental Science Center, Boston Children’s Hospital, Boston, MA, United States
Synopsis
Quantitative MRI has demonstrated potential in clinical and neuroscience applications, but its adoption has been hampered by excessively long scan times. Recent biophysical models have enabled differentiation of para- and dia-magnetic contributions to the tissue, but the acquisition of multi-parametric maps required by such models have further increased the encoding burden. We propose a comprehensive 9.5 min exam at high isotropic resolution to address this, from which T1, T2, proton density, T2*, para- and dia-magnetic susceptibility maps are estimated. This exam flexibly lends itself to generation of contrast-weighted images, allowing it to be used for clinical reads as well.
Introduction
Quantitative MRI (qMRI) provides valuable information related to brain microstructure (1), and can help identify physiological changes undetected by qualitative imaging (2), provide specific information to characterize pathology (3,4), and detect disease before morphological changes appear (5).Unfortunately, qMRI is encoding intensive, and current techniques suffer from lengthy acquisitions, e.g. 3D MR fingerprinting at 1.2 mm iso. resolution requires 12 min (6). Novel signal models can extract further information from qMRI acquisitions, such as the source separation methods that disentangle contributions from para- and dia-magnetic susceptibility (7-9). Although these methods provide clinically useful information related to the main susceptibility sources in the brain, iron and myelin, their potential translation has been hampered due to lengthy acquisitions. This is particularly true for 𝜒-separation (7), where T2’ information i.e. (1/T2*﹣1/T2)-1 is combined with 3D-gradient echo (GRE) phase data, necessitating both T2* and T2 estimation.
We propose to address the encoding burden of multi-parametric qMRI by employing 3D-QALAS (3D-quantification using an interleaved Look-Locker acquisition with T2-preparation pulse) (10,11) to rapidly estimate high-resolution T1, T2, and proton density (PD) maps. We complement this with a multi-echo 3D-GRE from which T2* and quantitative susceptibility maps (QSM) are estimated. When combined, the 9.5 min protocol also permits the separation of para- and dia-magnetic susceptibility sources, and lends itself to the generation of contrast-weighted images.
Method
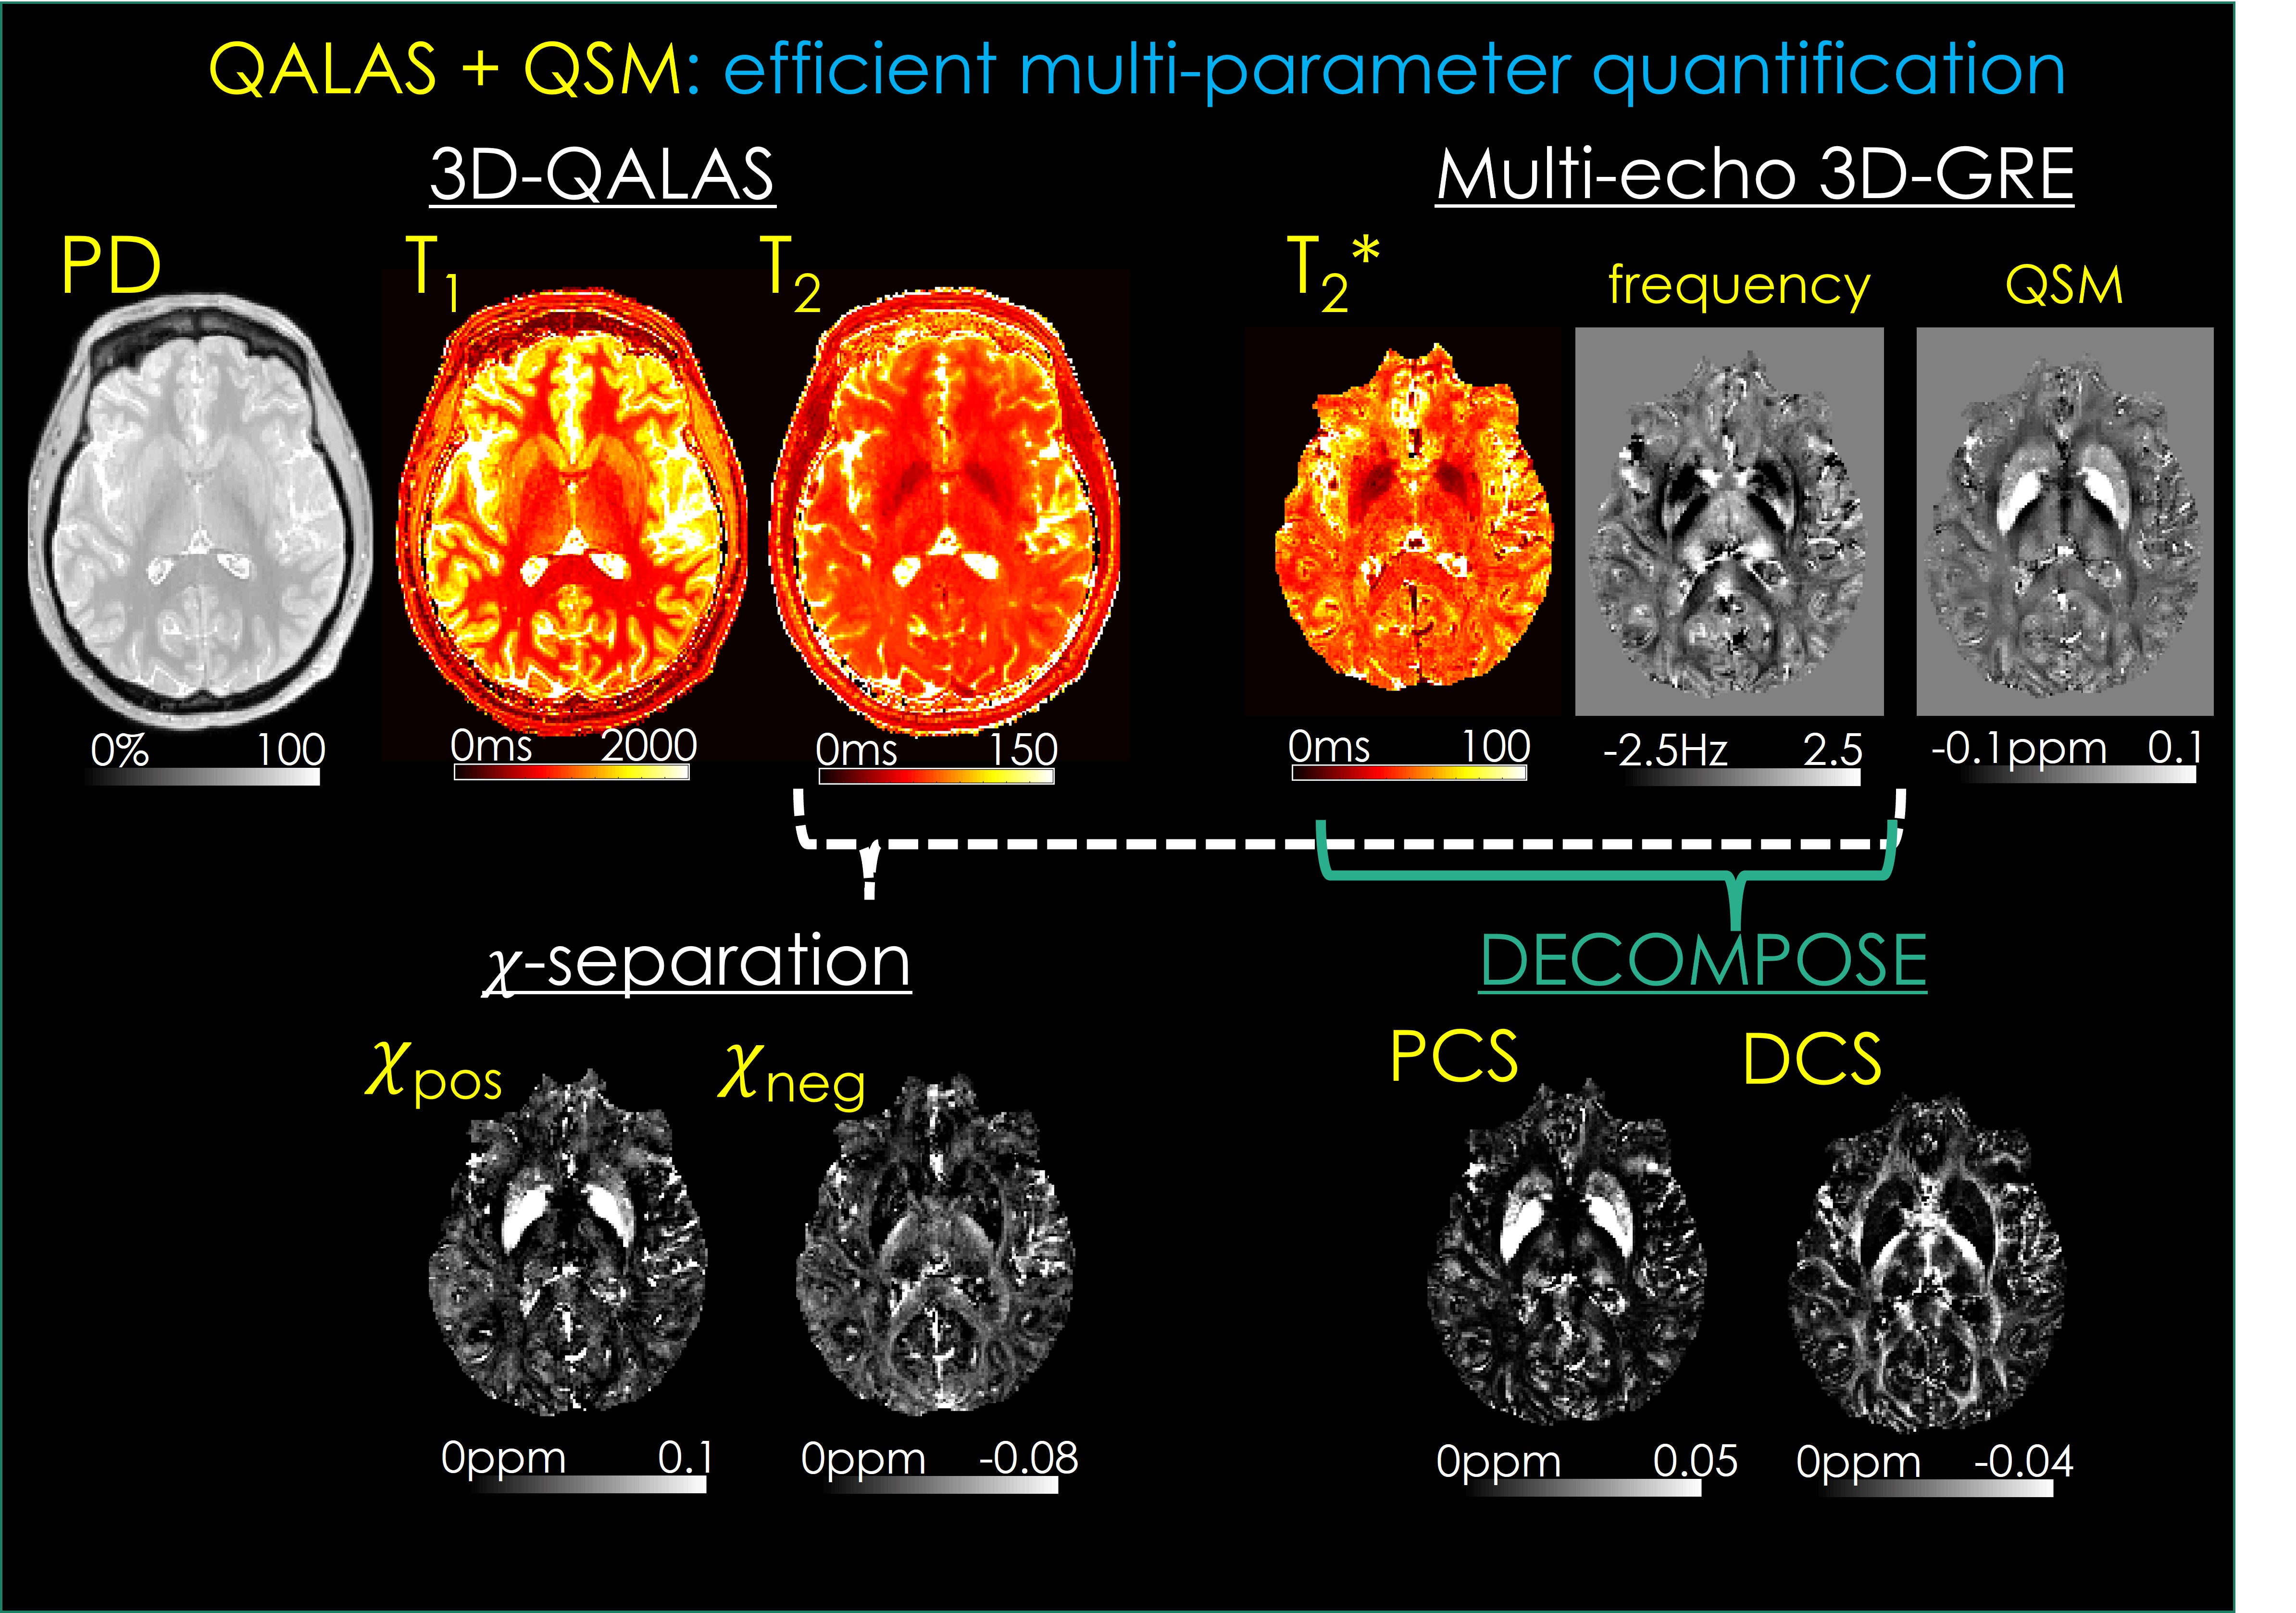
QALAS+QSM protocol [Fig1]. 3D-QALAS acquisition includes five turbo-flash readouts, with a T2-preparation module preceding the first readout, and the remaining four readouts following an inversion pulse that captures T1 dynamics. These five readouts permit the estimation of T1, T2, and PD maps through Bloch-dictionary matching. A multi-echo 3D-GRE acquisition provides T2*, tissue frequency and susceptibility maps. Frequency maps are obtained by processing the raw phase using Laplacian unwrapping (15) and V-SHARP background removal (16,17). Frequency maps were then averaged across the echoes. QSM was estimated using MEDI (18,19).Two source separation methods are evaluated: DECOMPOSE (8), which utilizes the T2* and QSM maps of each echo to estimate para- and dia-magnetic component susceptibility (PCS, DCS) maps. 𝜒-separation also uses the T2 map from the QALAS acquisition to calculate 𝜒pos and 𝜒neg maps.
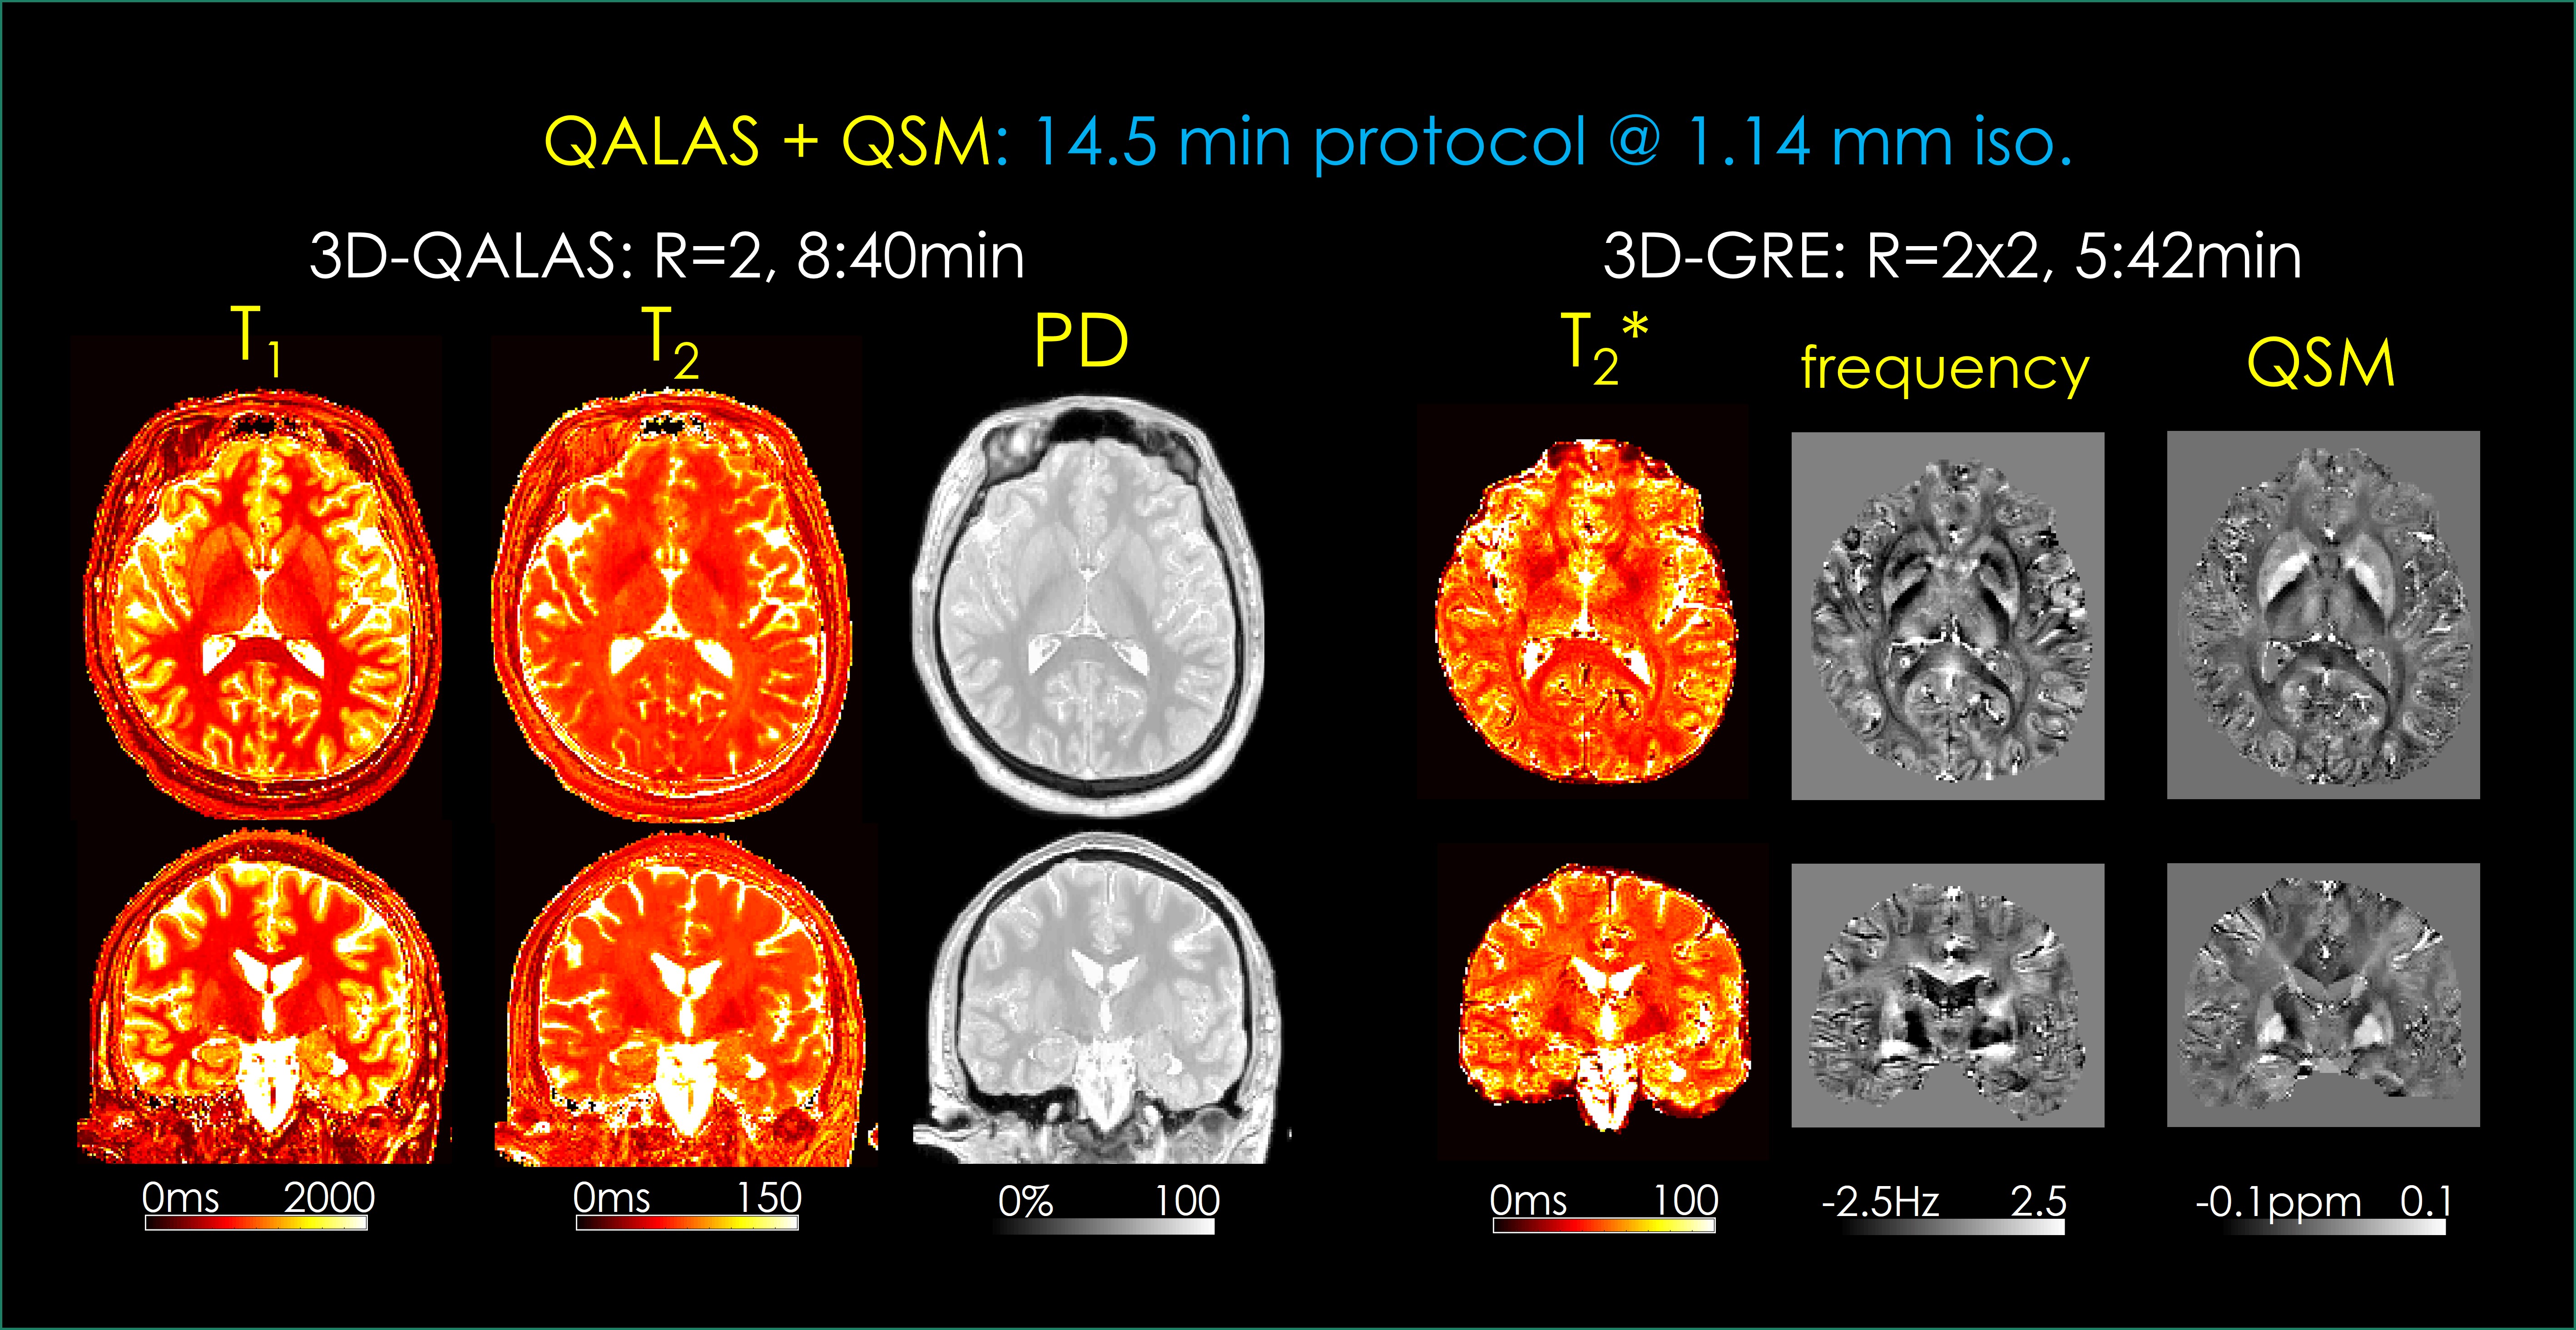
Standard 14.5 min protocol [Fig2]. Here, 3D-QALAS is mildly accelerated using R=2-fold parallel imaging. Imaging parameters are: FOV=256x256x182 mm3, resolution=1.14 mm iso., bandwidth=330 Hz/pixel. At TR=4.5 sec and using echo train length (ETL) = 123, the acquisition took 8:40 min.
3D-GRE acquisition sampled 8 echoes with matching FOV, resolution and bandwidth at TR=38 ms and TE1=2.38 ms, ΔTE=4.52 ms, flip angle=15°. At R=2x2-fold acceleration, this required 5:42 min.
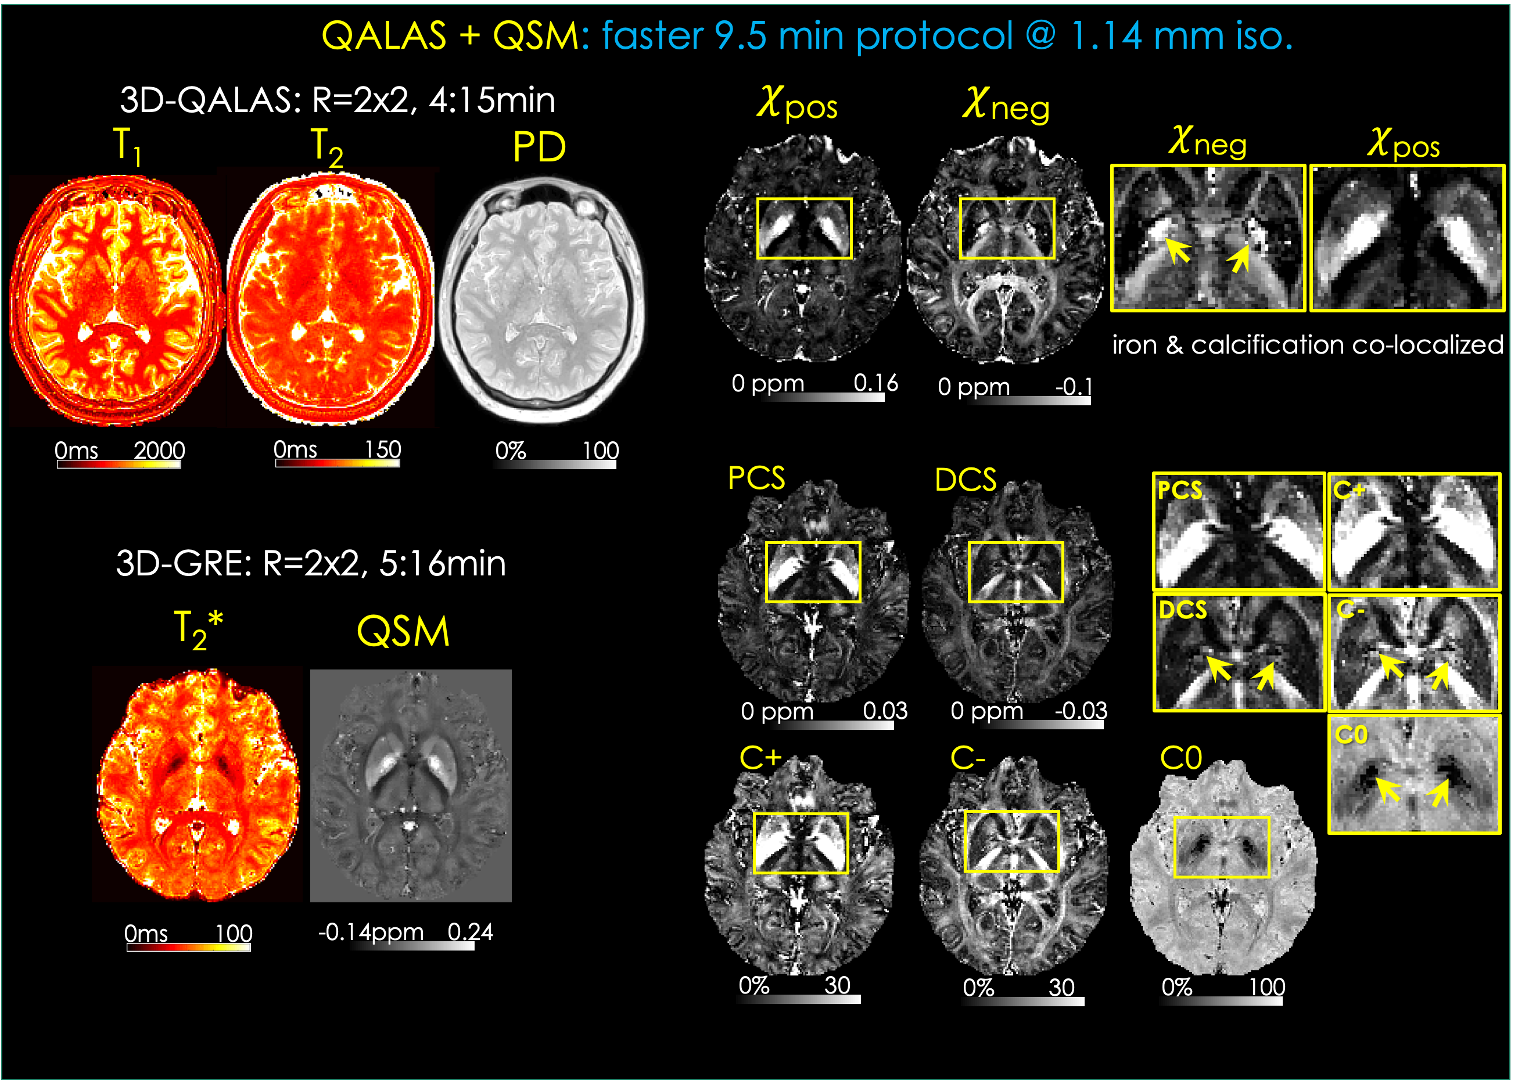
Faster 9.5 min protocol [Fig4]. 3D-QALAS acquisition is further sped-up at R=2x2 parallel imaging. Using high-performance (80 mT/m) gradients reduced the echo spacing in 3D-GRE (TE1=2.28 ms, ΔTE=4.22), thus the acquisition was completed in 5:16 min at TR=35 ms.
Data acquisition: 2 volunteers were scanned on Siemens 3T systems (standard protocol using a Skyra, and faster protocol on a Prisma scanner). 32ch head coil was used for reception.
Results
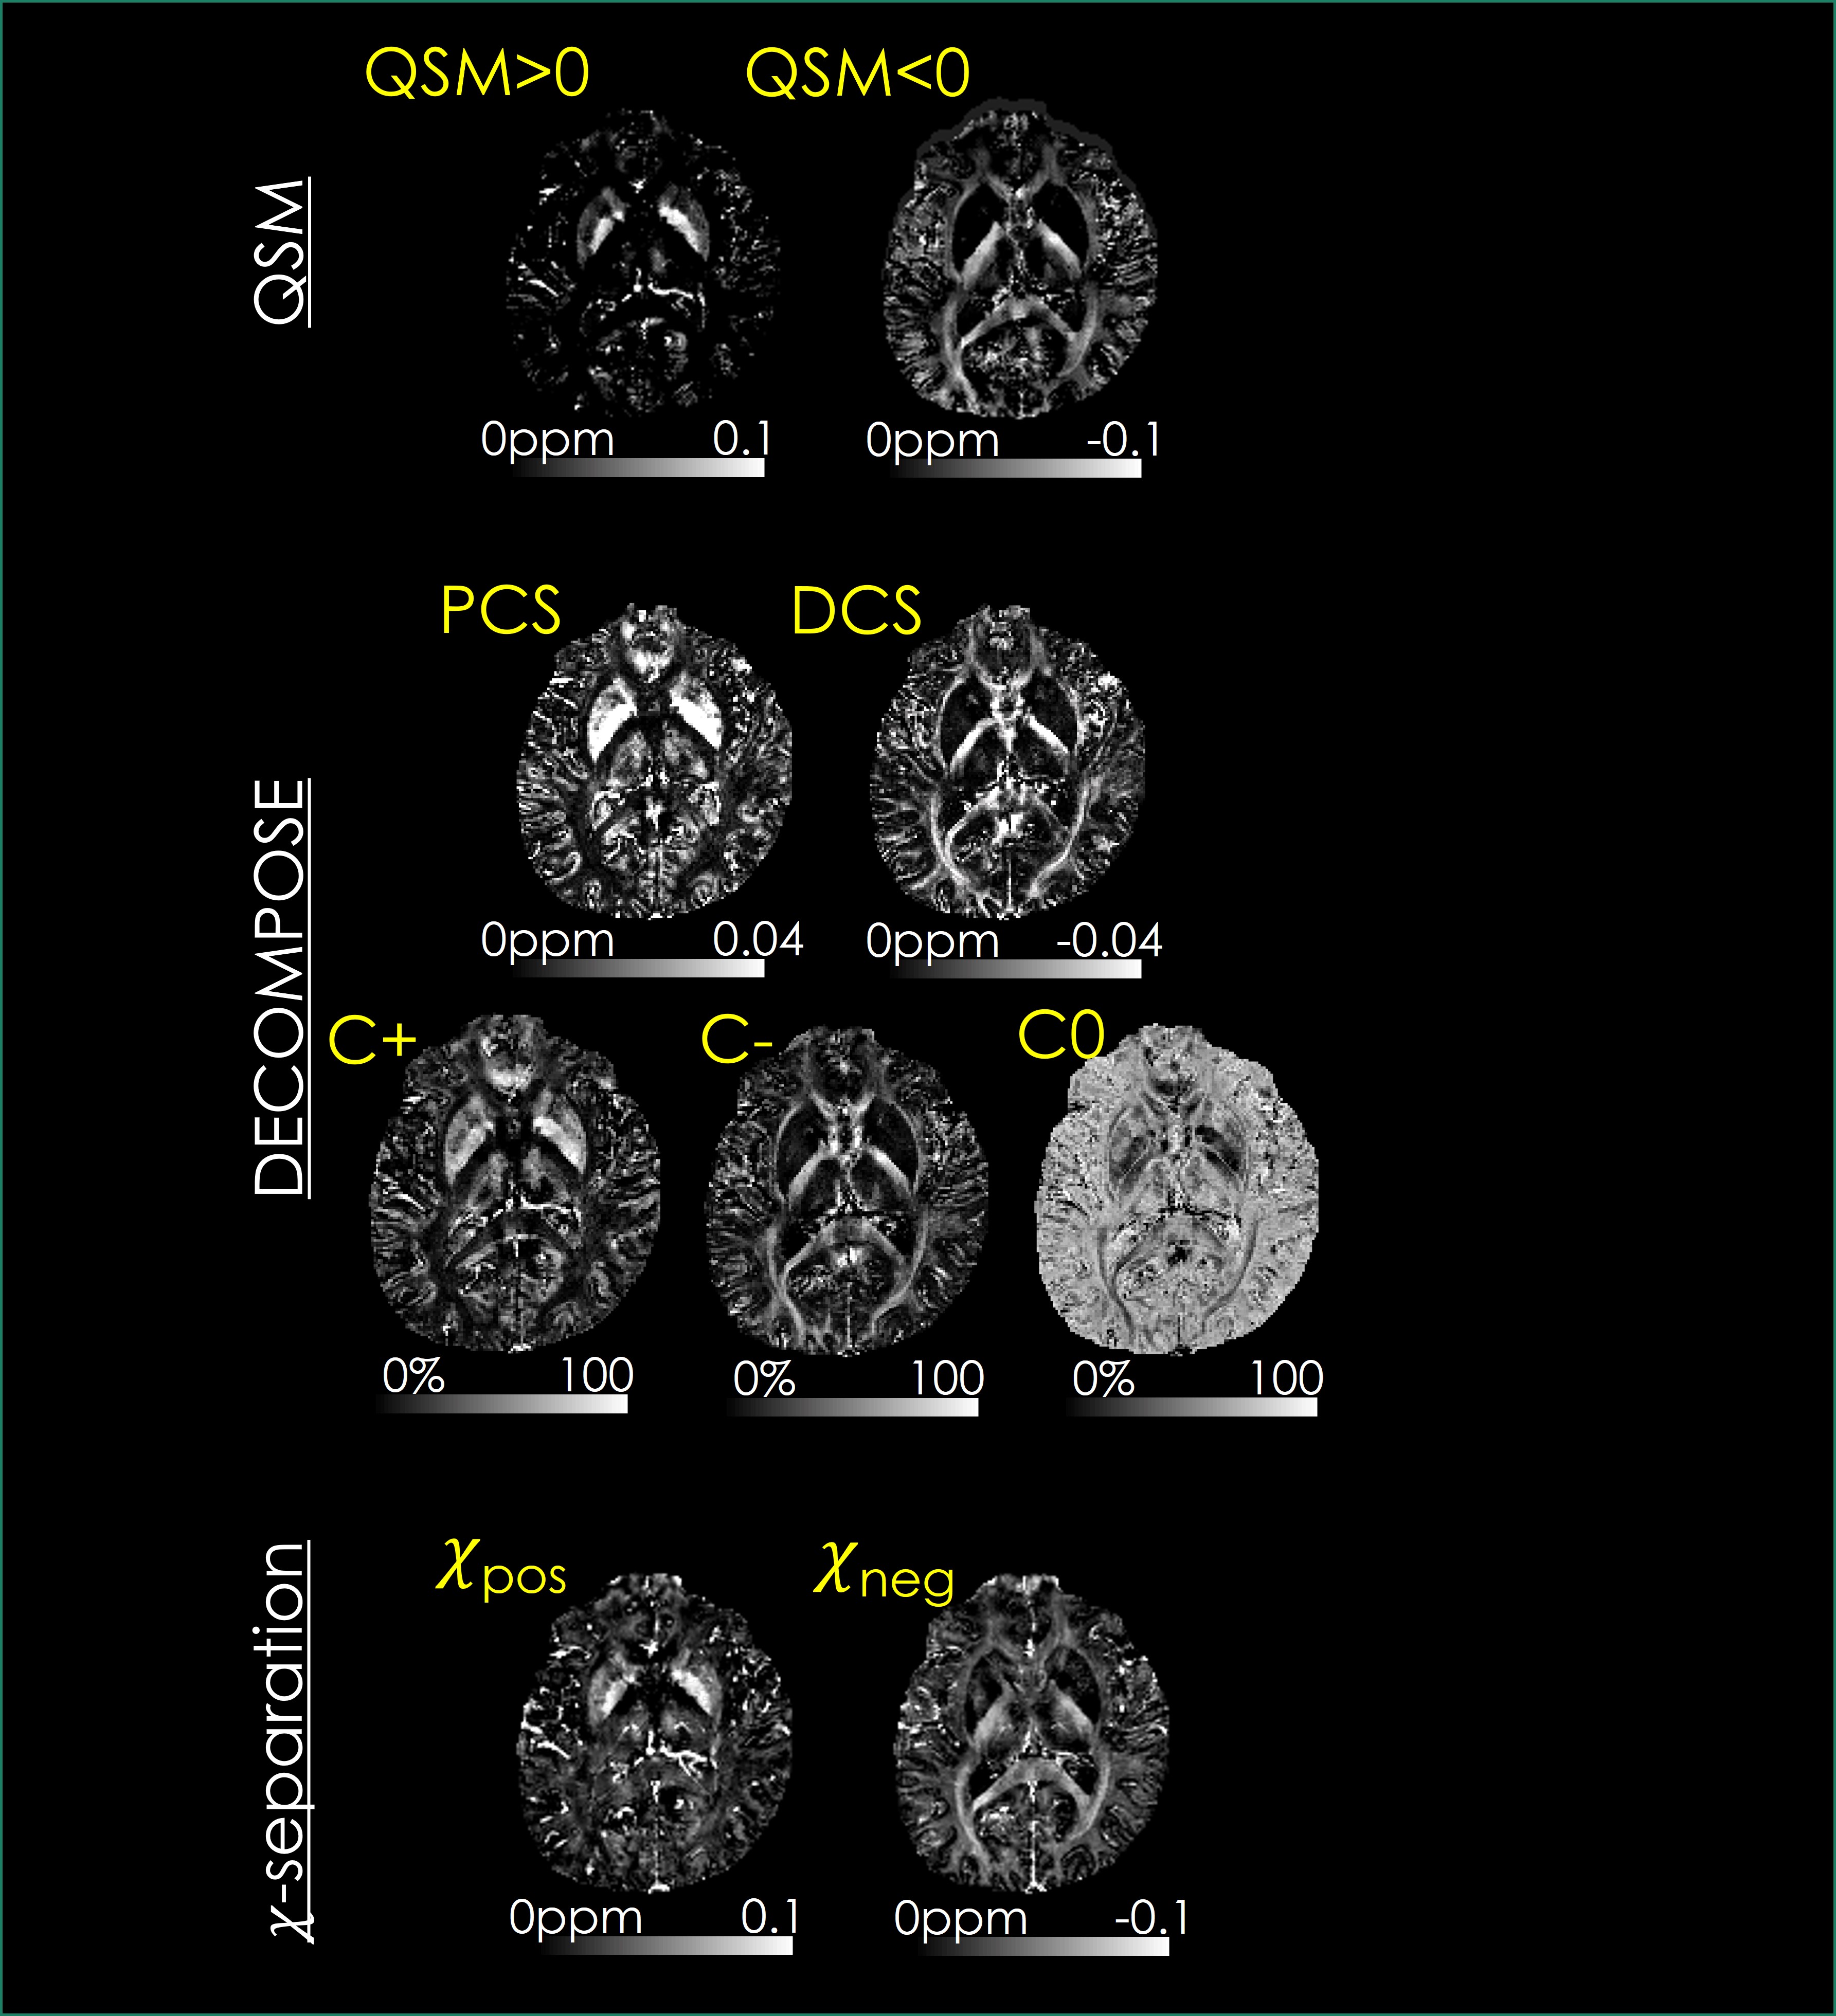
When the DECOMPOSE and 𝜒-separation maps are reconstructed using the same data (standard protocol, subject#1), they successfully visualized the histological distributions of iron and myelin in the brain (Fig3). The paramagnetic maps (C+, PCS, and 𝜒pos) have large positive susceptibility in deep gray matter, while diamagnetic hyperintensities (C-, DCS, and 𝜒neg) are observed in white matter.The faster protocol simultaneously generates high-resolution susceptibility maps of ꭓ-separation and DECOMPOSE as well as four additional maps (T1, T2, T2*, PD; Fig4, subject#2). Interestingly, source separation analysis was able to disentangle a potential calcification co-localized with iron in the globus pallidus of this subject, which appeared as strong paramagnetism in the standard QSM reconstruction.
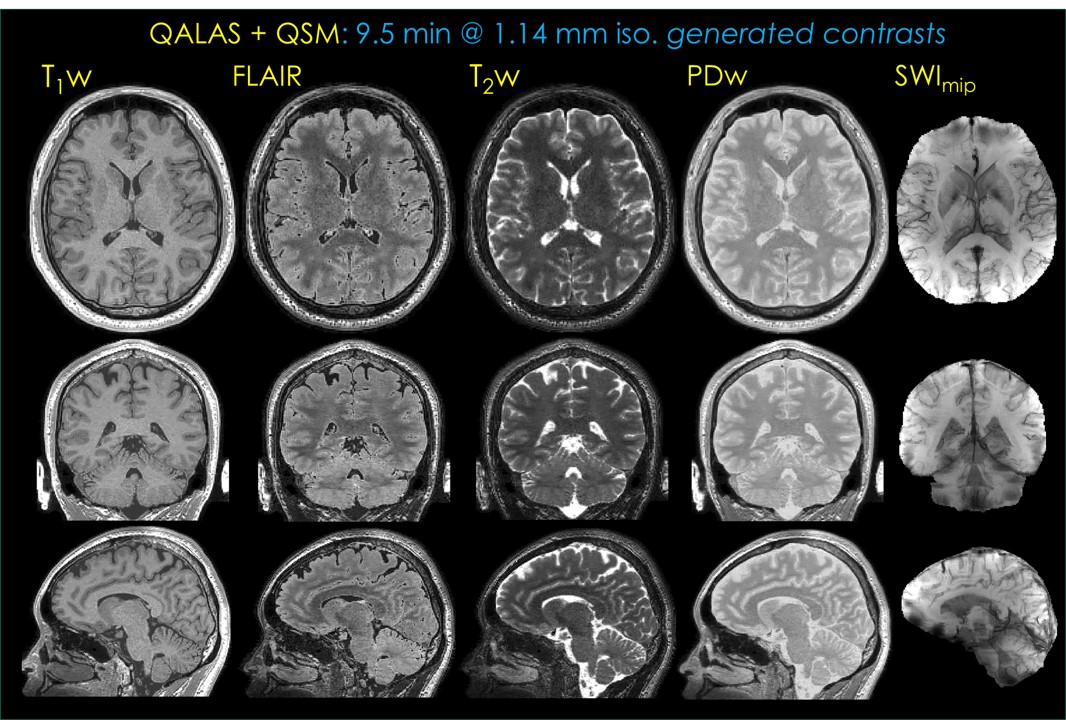
In Fig5, synthetic T1-, T2-, FLAIR- and PD-weighted volumes generated from the faster QALAS acquisition, as well as susceptibility weighted imaging (SWI) (14) minimum intensity projections over 10 slices computed using 3D-GRE data are presented.
Discussion and conclusion
We presented an efficient qMRI protocol that provided a high-resolution and rich set of multi-parametric maps, and enabled depiction of para- and dia-magnetic susceptibility sources in the brain. Pushing the acceleration further, to e.g. R=3x2, can permit a 6.5 min total protocol, thus facilitating the translation of QALAS+QSM. This, however, would impact the SNR due to the “√R” intrinsic penalty, as well as potential g-factor noise amplification. We think that regularized (compressed sensing, deep learning) reconstructions are well poised to address this challenge.Even though the susceptibility separation maps are reconstructed from the same dataset, 𝜒-separation and DECOMPOSE visualize the brain anatomy related to myelin and iron, but with different contrasts. It is worth noting that two algorithms use different dipole inversion models (STAR-QSM (21) vs MEDI (18,19)), which may contribute to observed differences. In addition, the outputs from two algorithms have different physical information (𝜒-separation: bulk susceptibility, DECOMPOSE-QSM: concentration of corresponding components and synthesized bulk susceptibility). Importantly, the proposed QALAS+QSM constitutes an efficient protocol whereby the two novel models can be reliably compared.
Acknowledgements
No acknowledgement found.References
9. Emmerich J, Bachert P, Ladd ME, Straub S. On the separation of susceptibility sources in quantitative susceptibility mapping: Theory and phantom validation with an in vivo application to multiple sclerosis lesions of different age. Journal of Magnetic Resonance 2021;330:107033 doi: 10.1016/j.jmr.2021.107033.
12. Mugler JP, Brookeman JR. Three-dimensional magnetization-prepared rapid gradient-echo imaging (3D MP RAGE). Magnetic Resonance in Medicine 1990;15:152–157 doi: 10.1002/mrm.1910150117.
Figures