2459
The impact of head orientation with respect to B0: An unexplored source of variance in diffusion MRI1CUBRIC, Cardiff University, Cardiff, United Kingdom, 2Inselspital, Bern University, Bern, Switzerland, 3Australian Catholic University, Melbourne, Australia, 4UMC Utrecht, Utrecht University, Utrecht, Netherlands
Synopsis
Recently observed anisotropy of compartmental white matter T2-values as a function of tissue orientation w.r.t. B0 in combination with echo-time-dependence of diffusion MRI signals suggest that similar tissue-orientational effects could be expected in standard diffusion tensor measures. In this work we show the change of up to 20-30% in diffusion tensor measures as a function of fibre orientation w.r.t. B0 from in vivo experiments and support these observations by simplified two-compartment white matter signal simulations.
Introduction
Several MRI contrasts have shown a dependence on tissue orientation in the MRI scanner w.r.t. $$$\vec{B}_0$$$, including $$$T_2^{(*)}$$$, $$$T_1$$$, magnetisation transfer.1-19 This also implies a dependence on head orientation in measures derived from diffusion MRI (dMRI), where typically only the orientation-dependence w.r.t. the gradient direction is considered. While providing additional information on tissue microstructure, MRI-contrast dependence on head-orientation w.r.t. $$$\vec{B}_0$$$ can also introduce potential variability in the results and as such decrease the statistical power in dMRI studies. In this work, we aim to simulate how diffusion tensor (DT) measures can be affected based on previously reported head-orientation dependence of compartmental $$$T_2$$$20,21, and characterise this dependence in in vivo human brain data at 3T.Theory
Consider a simplified two-compartment model of the diffusion weighted signal in white matter (WM) (no fibre dispersion, long-time limit) as a function of the echo time TE and $$$b$$$-value:$$S(b,\mathbf{g},t)\sim~f\cdot e^{-R_{2,\text{i}}\text{TE}}\cdot~e^{-b\mathbf{g}^T\mathbf{D}_\text{i}\mathbf{g}}+(1-f)\cdot~e^{-R_{2,\text{e}}\text{TE}}\cdot~e^{-b\mathbf{g}^T\mathbf{D}_\text{e}\mathbf{g}}~,\qquad\qquad\qquad(1)$$ where subscripts i/e denote intra-/extra-axonal compartments, respectively, $$$R_2$$$ are the relaxation rates, $$$\mathbf{D}$$$ are diffusion tensors, and $$$f$$$ is intra-axonal signal fraction. Suppose $$$\mathbf{D}_\text{i}$$$ and $$$\mathbf{D}_\text{e}$$$ have equal first eigenvectors (denoted by $$$\mathbf{n}$$$) and parallel&perpendicular eigenvalues $$$D_{\text{i},\parallel}\&D_{\text{i},\bot}=0$$$ and $$$D_{\text{e},\parallel}\&D_{\text{e},\bot}$$$ respectively, the signal can be simplified as
$$S(b,\mathbf{g},t)\sim~f\cdot e^{-R_{2,\text{i}}t}\cdot e^{-b{D}_\text{i}}+(1-f)\cdot~e^{-R_{2,\text{e}}t} \cdot~e^{-b{D}_\text{e}}~,\qquad\qquad\qquad\qquad\qquad(2)$$ where $$$D=D_\bot+(\mathbf{g}\cdot\mathbf{n})(D_\parallel-D_\bot)$$$.
The apparent diffusion coefficient (ADC) is the first order term of the Maclaurin series expansion of $$$\ln(S)$$$ in $$$b$$$:
$$\text{ADC}(\text{TE})=\frac{f\cdot~D_\text{i}\cdot~e^{-R_{2,\text{i}}\text{TE}}+(1-f)\cdot~D_\text{e}\cdot~e^{-R_{2,\text{e}}\text{TE}}}{f\cdot~e^{-R_{2,\text{i}}\text{TE}}+(1-f)\cdot~e^{-R_{2,\text{e}}\text{TE}}}~.\qquad\qquad\qquad\qquad\qquad(3)$$
Recent work suggests that the extra-axonal relaxation rate depends on WM fibre orientation $$$\theta$$$ to the magnetic field and could be described as $$$R_{2,\text{e}}(\theta)=A+B\sin^{4}\theta$$$.20 This orientational dependence of $$$R_{2,\text{e}}(\theta)$$$ will result in orientational dependence of the ADC.
Methods
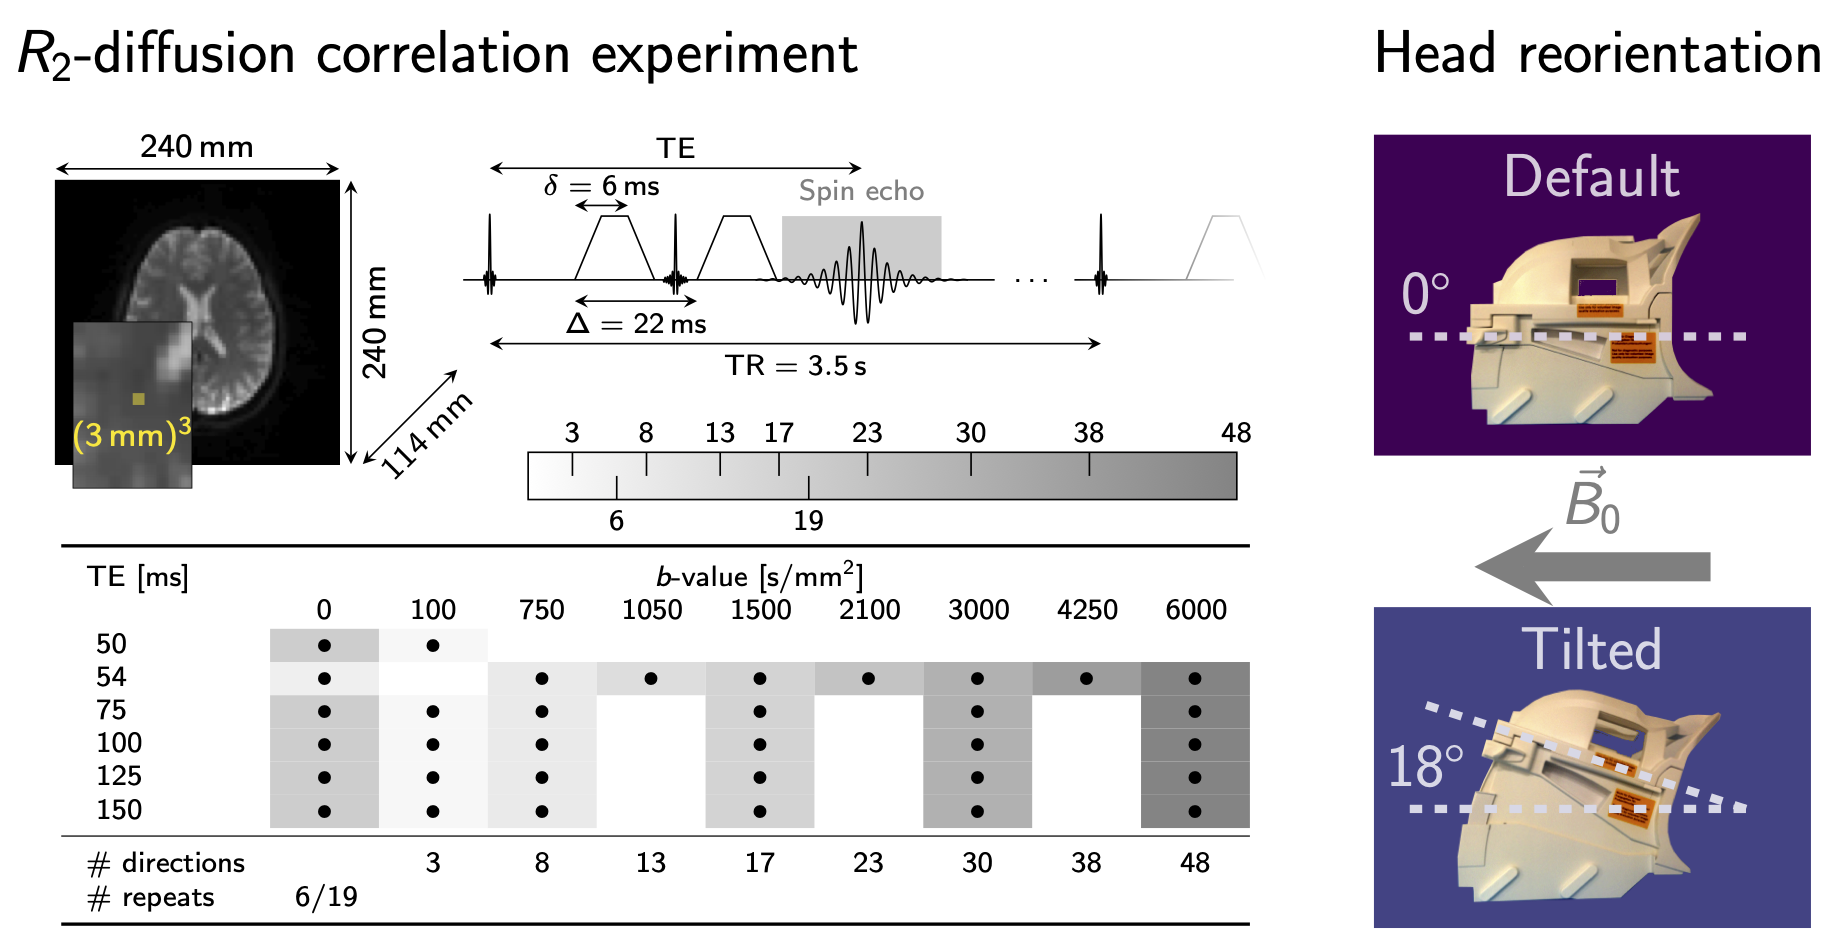
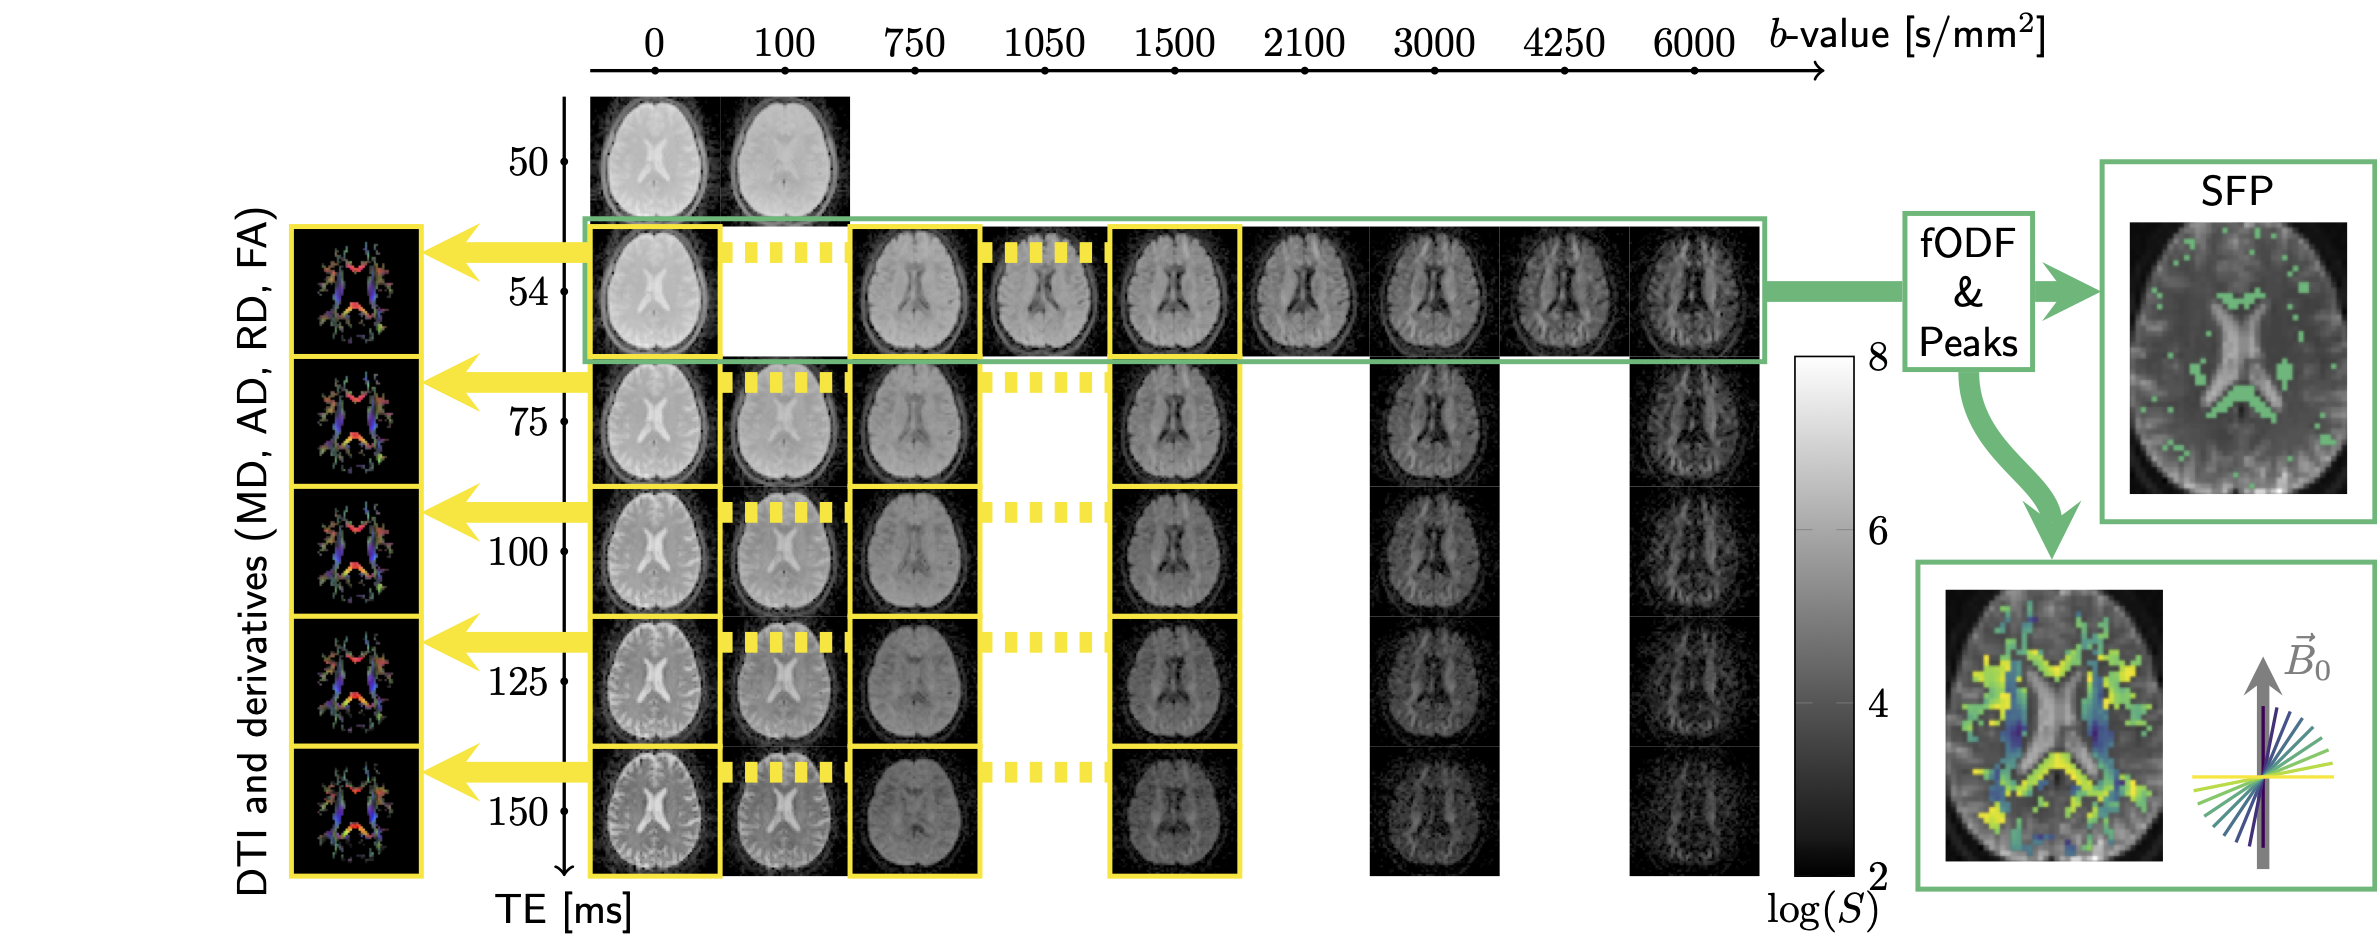
Data acquisition. Multi-dimensional diffusion-$$$R_2$$$ data were acquired from 5 healthy participants (3 female, 25-31y.o.) on a 3T MRI scanner equipped with a 300mT/m gradient system and a 20ch head/neck receive coil, tiltable about the LR-axis. The acquisition was repeated in default (0°) and tilted (18°) coil-orientations. Acquisition parameters are summarised in Fig.1.Data processing. The data were checked for slice-wise outliers22 and signal drift, corrected for Gibbs ringing23, subject motion, geometrical distortions24-26 and Rician noise bias27-30. DTs were estimated for each $$$\text{TE}$$$ on the $$$b=[0,~750,~1500]\,\text{s}/\text{mm}^2$$$ data (Fig.2), using MRtrix3. Fibre orientation distribution functions (fODF)31,32 were estimated at $$$\text{TE}=54\,\text{ms}$$$ using multi-shell multi-tissue constrained spherical deconvolution33. From the fODFs single-fibre population (SFP) voxels34 with low dispersion (as quantified by $$$p_2$$$35) were identified, and fibre orientations $$$\theta$$$ w.r.t. $$$\vec{B}_0$$$ computed.
Data analysis. Orientational anisotropy was analysed for MD, AD, RD and FA at each echo time by representing the values from SFP voxel by a function of $$$\theta$$$:
$$F(\theta)=A+B\cdot\sin^{2n}\theta,\quad~n=[0,1,2]~,\qquad\qquad\qquad(4)$$
$n=0$ is equivalent to the isotropic case ($$$F(\theta)=A$$$). The rescaled Akaike’s Information Criterion (AIC)36,37, ΔAICrepresentation=AICrepresentation-AICmin, estimated the relative performance of the representations.
Results
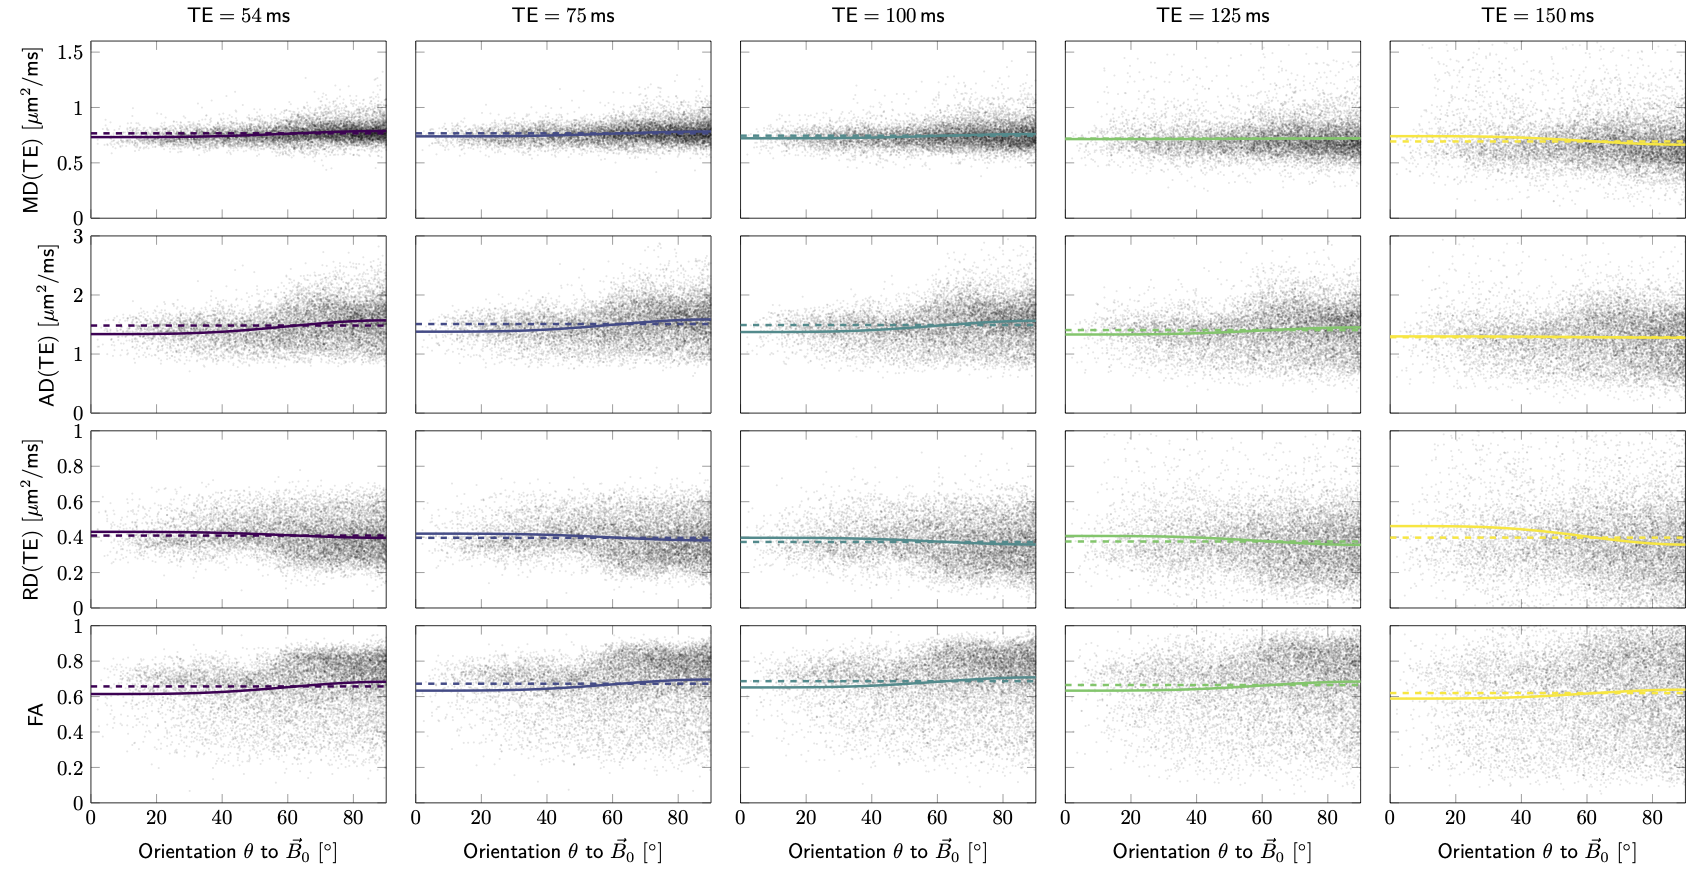
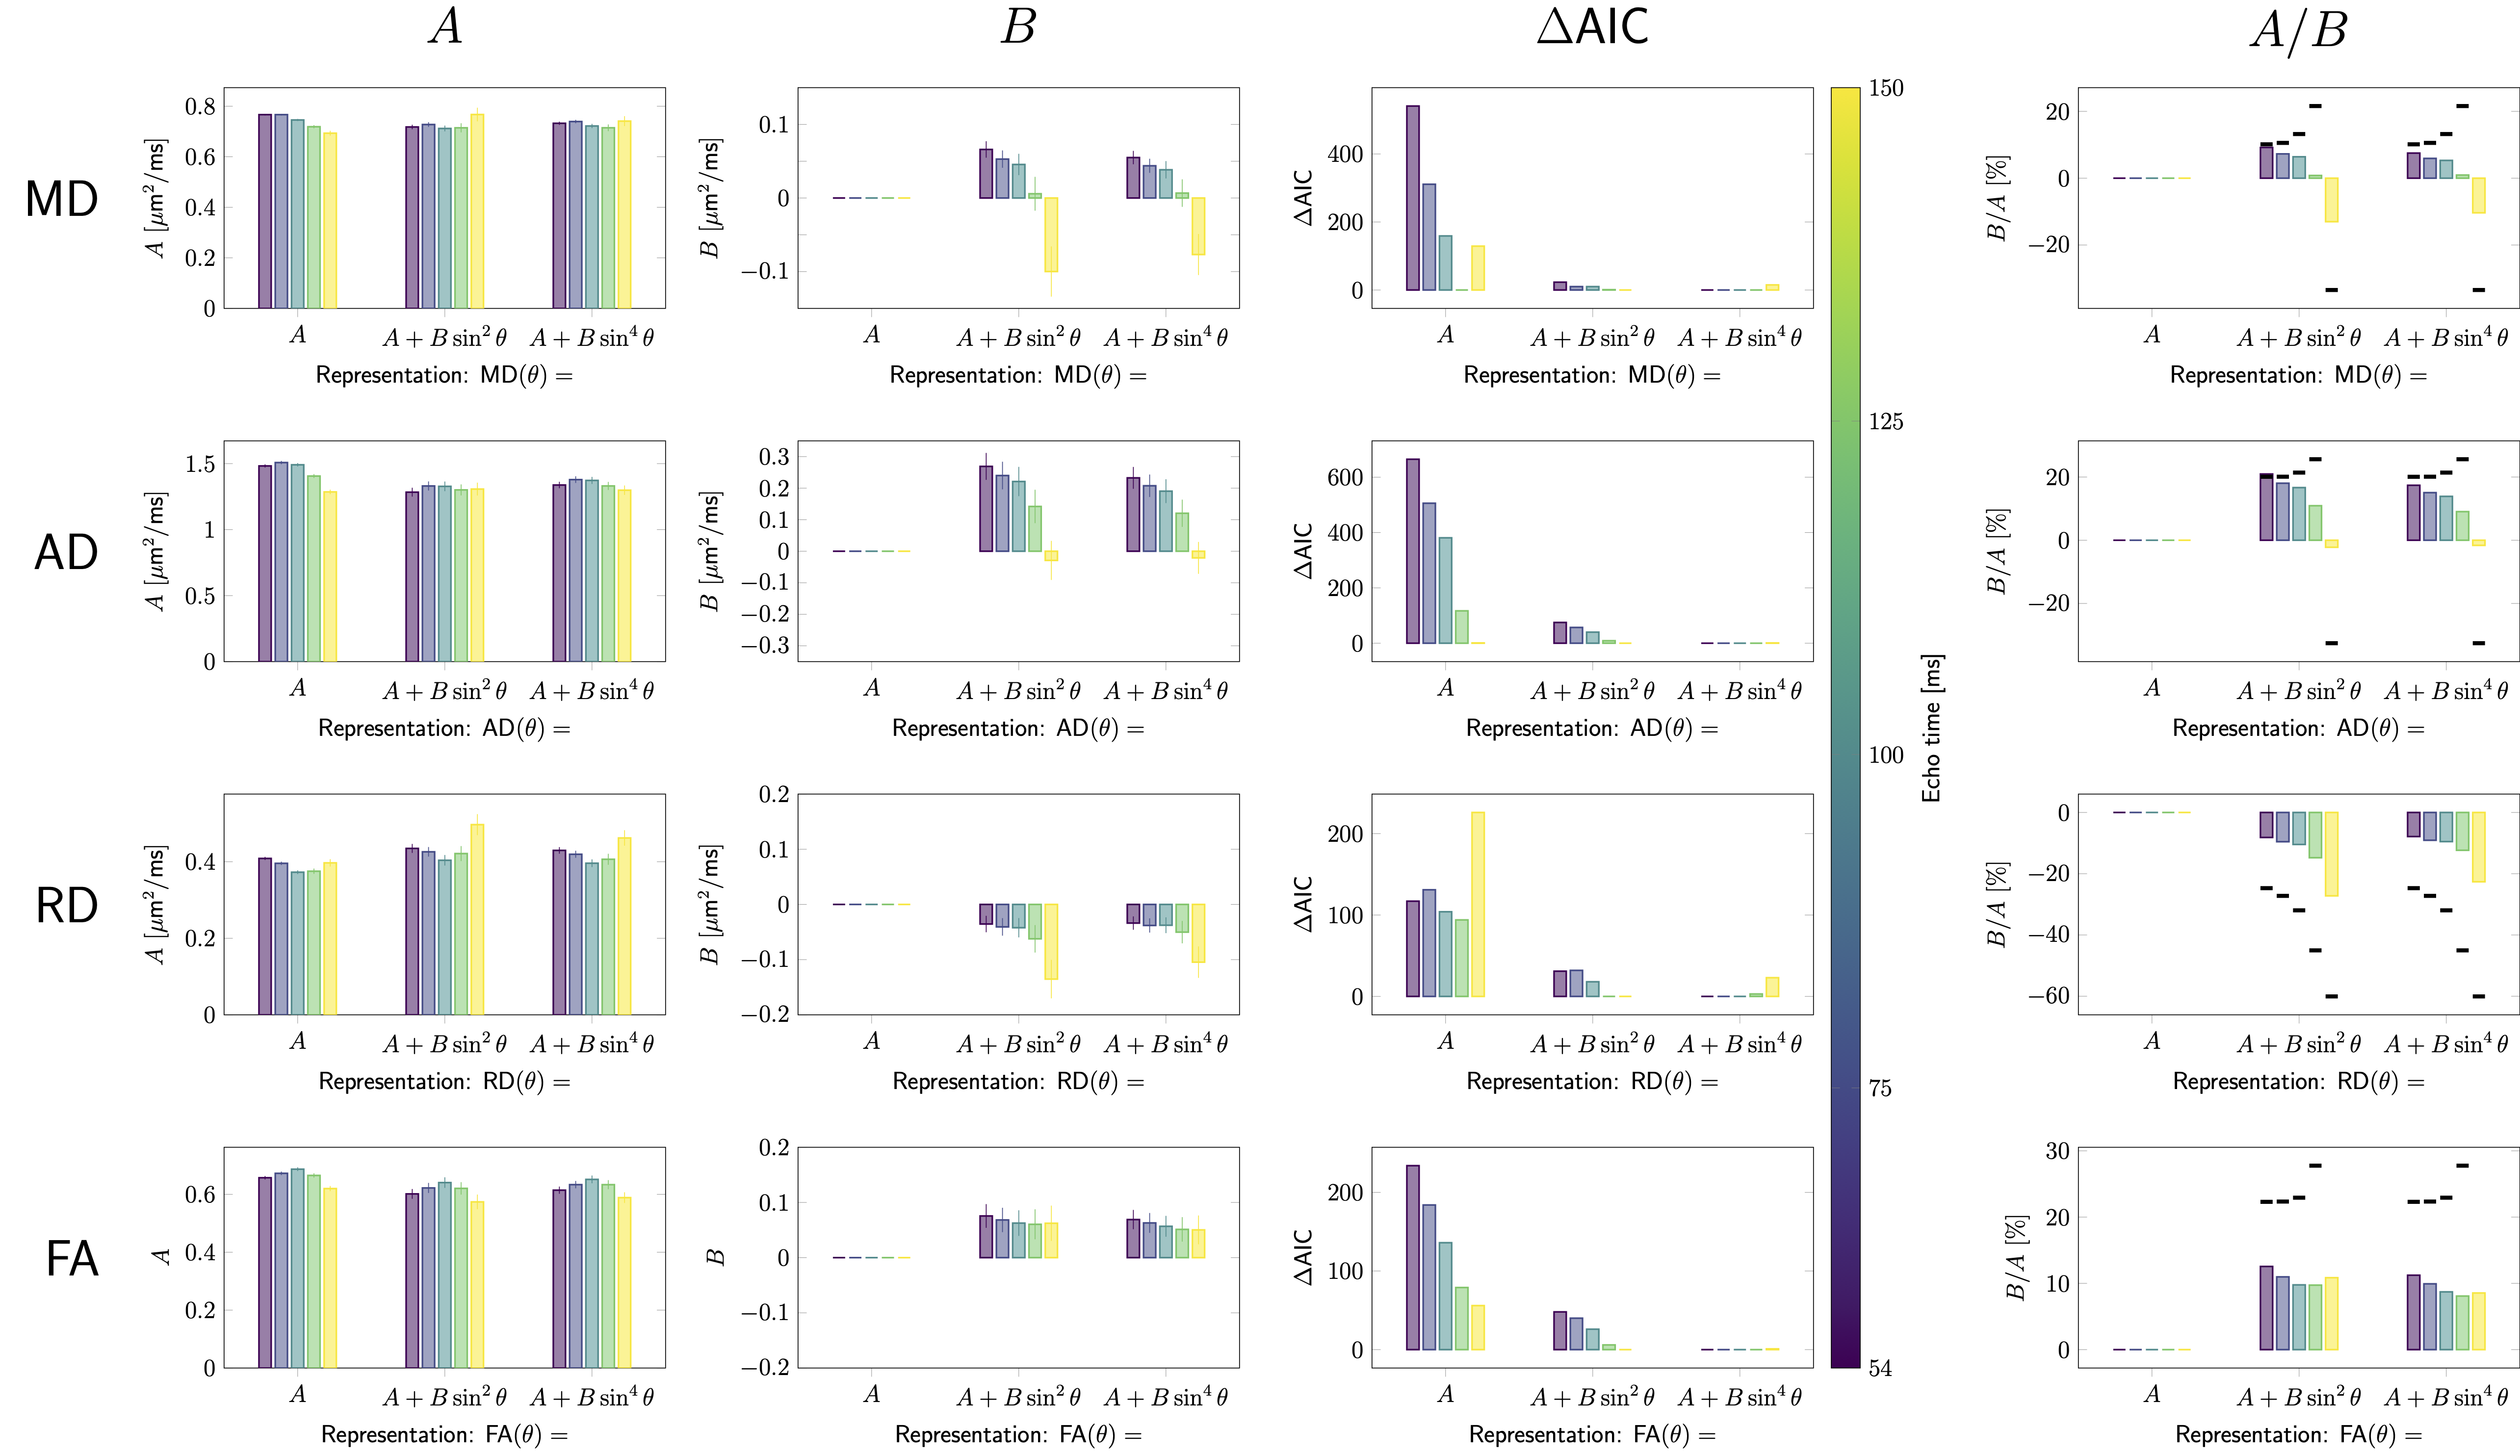
Simulations. Fig.3AB shows examples of MD, AD, RD, and FA as a function of fibre orientation $$$\theta$$$ to $$$\vec{B}_0$$$. For the parameter settings investigated, AD and FA increase with $$$\theta$$$ ($$$\hat{B}>0$$$), while RD decreases ($$$\hat{B}<0$$$). The magnitude of the orientational anisotropy, $$$|\hat{B}|$$$, increases with $$$\text{TE}$$$ for all measures (Fig.3C).The resulting behaviour of MD is non-trivial, with possible sign flips of $$$\hat{B}$$$ for increasing $$$\text{TE}$$$.In vivo data. Fig.4 shows DT measures as a function of $$$\theta$$$ ($$$x$$$-axis) and $$$\text{TE}$$$ (columns), where each scatterpoint represents an SFP voxel. The barplots in Fig.5 show isotropic ($$$\hat{A}$$$, first column) or anisotropic ($$$\hat{B}$$$, second column) components for a given measure (rows) for all three representations (Eq.4). Larger $$$\Delta\text{AIC}$$$ values (third column) for the isotropic representation indicate that all measures are better described by anisotropic representations. The anisotropic component $$$B$$$ decreases with increasing $$$\text{TE}$$$ for all DT measures. Its sign is negative for RD and changes from positive to negative for MD and AD, between TE=100ms and TE=150ms. The fibre-orientation-independent component $$$A$$$ (first column, Fig.5) evolves non-linearly as a function of TE for all representation (Eq.4), this effect appeared less pronounced when MD and AD were represented as a function of $$$\theta$$$. Last column in Fig.5 puts the relative anisotropy (B/A,$$$~$$$%) into statistical context, by comparing it to the relative standard deviation of DT measure (std/mean,$$$~$$$%, horizontal bars). The anisotropic effects reached up to 20-30% for some TEs/measures, but were outweighed by noise and anatomical WM variability across the brain at long TEs.
Discussion
We observed a dependence of estimated DT measures on fibre orientation w.r.t. B0. Already in simplified WM simulations, non-trivial orientational effects could be observed (e.g. sign flips in $$$\hat{B}$$$ as a function of TE for MD). The in vivo RD and MD estimates as a function of θ followed trends also seen in simulations, but $$$\hat{B}$$$-components of AD and FA decreased as a function of TE in vivo in contrast to the increase in the toy-example. This could be attributed to the tissue complexity (e.g. dispersion; distribution of diffusivity-T2-values within and across voxels) and noise, amongst others.A tiltable receive coil was used to increase the range of achievable tissue orientations w.r.t. B0. Future work will investigate whether DT measures are significantly altered in the tilted vs non-tilted orientation.
Conclsion
DT measures varied up to B/A=20-30% as a function of WM fibre orientation w.r.t. B0 and are comparable to the corresponding std/mean of MD and AD at lower TEs. Ignoring these effects could lead to misinterpretations in clinical studies.Acknowledgements
CMWT was supported by a Sir Henry Wellcome Fellowship (215944/Z/19/Z) and a Veni grant (17331) from the Dutch Research Council (NWO). DKJ, CMWT, and EK were all supported by a Wellcome Trust Investigator Award (096646/Z/11/Z) and DKJ and EK were supported by a Wellcome Strategic Award (104943/Z/14/Z).
The data were acquired at the UK National Facility for In Vivo MR Imaging of Human Tissue Microstructure funded by the EPSRC (grant EP/M029778/1), and The Wolfson Foundation.
References
1. B Bender and U Klose. The in vivo influence of white matter fiber orientation towards B0 on $$$T_2^*$$$ in the human brain. NMR in Biomed, 23(9):1071–1076, 2010.
2. A Cherubini, P Péran, GE Hagberg, AE Varsi, G Luccichenti, C Caltagirone, U Sabatini, and G Spalletta. Characterization of white matter fiber bundles with $$$T_2^*$$$ relaxometry and diffusion tensor imaging. MRM, 61(5):1066–1072, 2009.
3. C Denk, EH Torres, A MacKay, and A Rauscher. The influence of white matter fibre orientation on MR signal phase and decay. NMR in Biomed, 24(3):246–252, 2011.
4. C Wiggins, V Gudmundsdottir, D Le Bihan, V Lebon, and M Chaumeil. Orientation Dependence of White Matter $$$T_2^*$$$ Contrast at 7T: A Direct Demonstration. ISMRM, 2008.
5. J Lee, K Shmueli, M Fukunaga, P van Gelderen, H Merkle, AC Silva, and JH Duyn. Sensitivity of MRI resonance frequency to the orientation of brain tissue microstructure. PNAS,107(11):5130–5135, 2010.
6. J Lee, P van Gelderen, L-W Kuo, H Merkle, AC Silva, and JH Duyn. $$$T_2^*$$$-based fiber orientation mapping. NI, 57(1):225 – 234, 2011.
7. S Wharton and R Bowtell. Fiber orientation-dependent white matter contrast in gradient echo MRI. PNAS, 109(45):18559–18564, 2012.
8. P Sati, AC Silva, P van Gelderen, MI Gaitan, JE Wohler, S Jacobson, JH Duyn, and DS Reich. In vivo quantification of $$$T_2^*$$$ anisotropy in white matter fibers in marmoset monkeys. NI, 59(2):979–985, 2012.
9. P Sati, P van Gelderen, AC Silva, DS Reich, H Merkle, JA De Zwart, and JH Duyn. Micro-compartment specific $$$T_2^*$$$ relaxation inthe brain. NI, 77:268–278, 2013.
10. S Wharton and R Bowtell. Gradient echo based fiber orientation mappingusing $$$R_2^*$$$ and frequency difference measurements. NI, 83:1011 – 1023, 2013.
11. S-H Oh, Y-B Kim, Z-H Cho, and J Lee. Origin of B0 orientation dependent $$$R_2^*$$$(= 1/$$$T_2^*$$$) in white matter. NI, 73:71 – 79, 2013.
12. DA Rudko, LM Klassen, SN De Chickera, JS Gati, GA Dekaban, and RS Menon. Origins of $$$R_2^*$$$ orientation dependence in gray and white matter. PNAS, 111(1), 2014.
13. MJ Knight, B Wood, E Couthard, and R Kauppinen. Anisotropy of spin-echo $$$T_2$$$ relaxation by magnetic resonance imaging in the human brain in vivo. Biomed S&I, 4(3):299–310, 2015.
14. R Gil, D Khabipova, M Zwiers, T Hilbert, T Kober, and JP Marques. An in vivo study of the orientation-dependent and independent componentsof transverse relaxation rates in white matter. NMR in Biomed, 29(12):1780–1790, 2016.
15. MJ Knight, S Dillon, L Jarutyte, and RA Kauppinen. Magnetic Resonance Relaxation Anisotropy: Physical Principles and Uses in Microstructure Imaging. Biophys J, 112(7):1517–1528, 2017.
16. A Pampel, DK Müller, A Anwander, H Marschner, and HE Möller. Orientation dependence of magnetization transfer parameters in human whitematter. NI, 114:136 – 146, 2015.
17. F Schyboll, U Jaekel, B Weber, and H Neeb. The impact of fibre orien-tation on $$$T_1$$$-relaxation and apparent tissue water content in white matter. MAGMA, 2018.
18. F Schyboll, U Jaekel, F Petruccione, and H Neeb. Fibre-orientation dependent $$$R_1$$$(= 1/$$$T_1$$$)relaxation in the brain: The role of susceptibility induced spin-lattice relaxation in the myelin water compartment. JMR, 300:135 – 141, 2019.
19. MJ Knight, RA Damion, and RA Kauppinen. Observation of angulardependence of $$$T_1$$$ in the human white matter at 3T. Biomed S&I, 2018.
20. CMW Tax, E Kleban, M Chamberland, M Barakovic, U Rudrapatna, and DK Jones. Measuring compartmental $$$T_2$$$-orientational dependence in human brain white matter using a tiltable RF coil and diffusion-$$$T_2$$$ correlation MRI. NI, 236:117967, 2021.
21. ET McKinnon and JH Jensen. Measuring intra-axonal $$$T_2$$$ in white matter with direction-averaged diffusion MRI. MRM, 81(5):2985–2994,2019.
22. V Sairanen, A Leemans, and CMW Tax. Fast and accurate Slice-wise OutLIer Detection (SOLID) with informed model estimation for diffusion MRI data. NI, 181:331–346, 2018.
23. E Kellner, B Dhital, VG Kiselev, and M Reisert. Gibbs-ringing artifactremoval based on local subvoxel-shifts. MRM, 76(5):1574–1581, 2016.
24. JLR Andersson, S Skare, and J Ashburner. How to correct susceptibility distortions in spin-echo echo-planar images: application to diffusion tensor imaging. NI, 20(2):870–888, 2003.
25. JLR Andersson and SN Sotiropoulos. An integrated approach tocorrection for off-resonance effects and subject movement in diffusion MR imaging. NI, 125:1063–1078, 2016.
26. MF Glasser, SN Sotiropoulos, JA Wilson, TS Coalson, B Fischl, JL Andersson, J Xu, S Jbabdi, M Webster, JR Polimeni, DC Van Essen, and M Jenkinson. The minimal preprocessing pipelines for the Human Connectome Project. NI, 80:105–124, 2013.
27. CG Koay, E Özarslan, and C Pierpaoli. Probabilistic Identification and Estimation of Noise (PIESNO): A self-consistent approach and its applications in MRI. JMR, 199(1):94–103, 2009.
28. CG Koay, E Özarslan, and PJ Basser. A signal transformationalframework for breaking the noise floor and its applications in MRI. JMR, 197(2):108–19, 2009.
29. S St-Jean, P Coupé, and M Descoteaux. Non Local Spatial and Angular Matching: Enabling higher spatial resolution diffusion MRI datasets through adaptive denoising. Medical Image Analysis, 32:115–130, 2016.
30. S St-Jean, A De Luca, CMW Tax, MA Viergever, and A Leemans. Automated characterization of noise distributions in diffusion MRI data. Medical Image Analysis, 101758, 2020.
31. J-Donald Tournier, Fernando Calamante, and Alan Connelly. Robust determination ofthe fibre orientation distribution in diffusion MRI: Non-negativity constrained super-resolved spherical deconvolution. NI, 35(4):1459–1472, 2007.
32. M Descoteaux, R Deriche, TR Knosche, and A Anwander. Deterministic and probabilistic tractography based on complex fibre orientation distributions. IEEE transactions on medical imaging, 28(2):269–286, 2008.
33. B Jeurissen, JD Tournier, T Dhollander, A Connelly, and J Sijbers. Multi-tissue constrained spherical deconvolution for improved analysis of multi-shell diffusion MRI data. NI, 103:411–426, 2014.
34. CMW Tax, B Jeurissen, SB Vos, MA Viergever, and A Leemans. Recursive calibration of the fiber response function for spherical deconvolution of diffusion MRI data. NI, 86, 2014.
35. Dmitry S. Novikov, Jelle Veraart, Ileana O. Jelescu, and Els Fieremans. Rotationally-invariant mapping of scalar and orientational metrics of neuronal microstructure with diffusion MRI. NI, 174:518–538, 2018.
36. H Akaike. A new look at the statistical model identification. IEEE Transactions on Automatic Control, 19(6):716–723, 1974.
37. KP Burnham and DR Anderson. Multimodel inference: Understanding AIC and BIC in model selection. Sociological Methods & Research, 33(2):261–304, 2004.
Figures
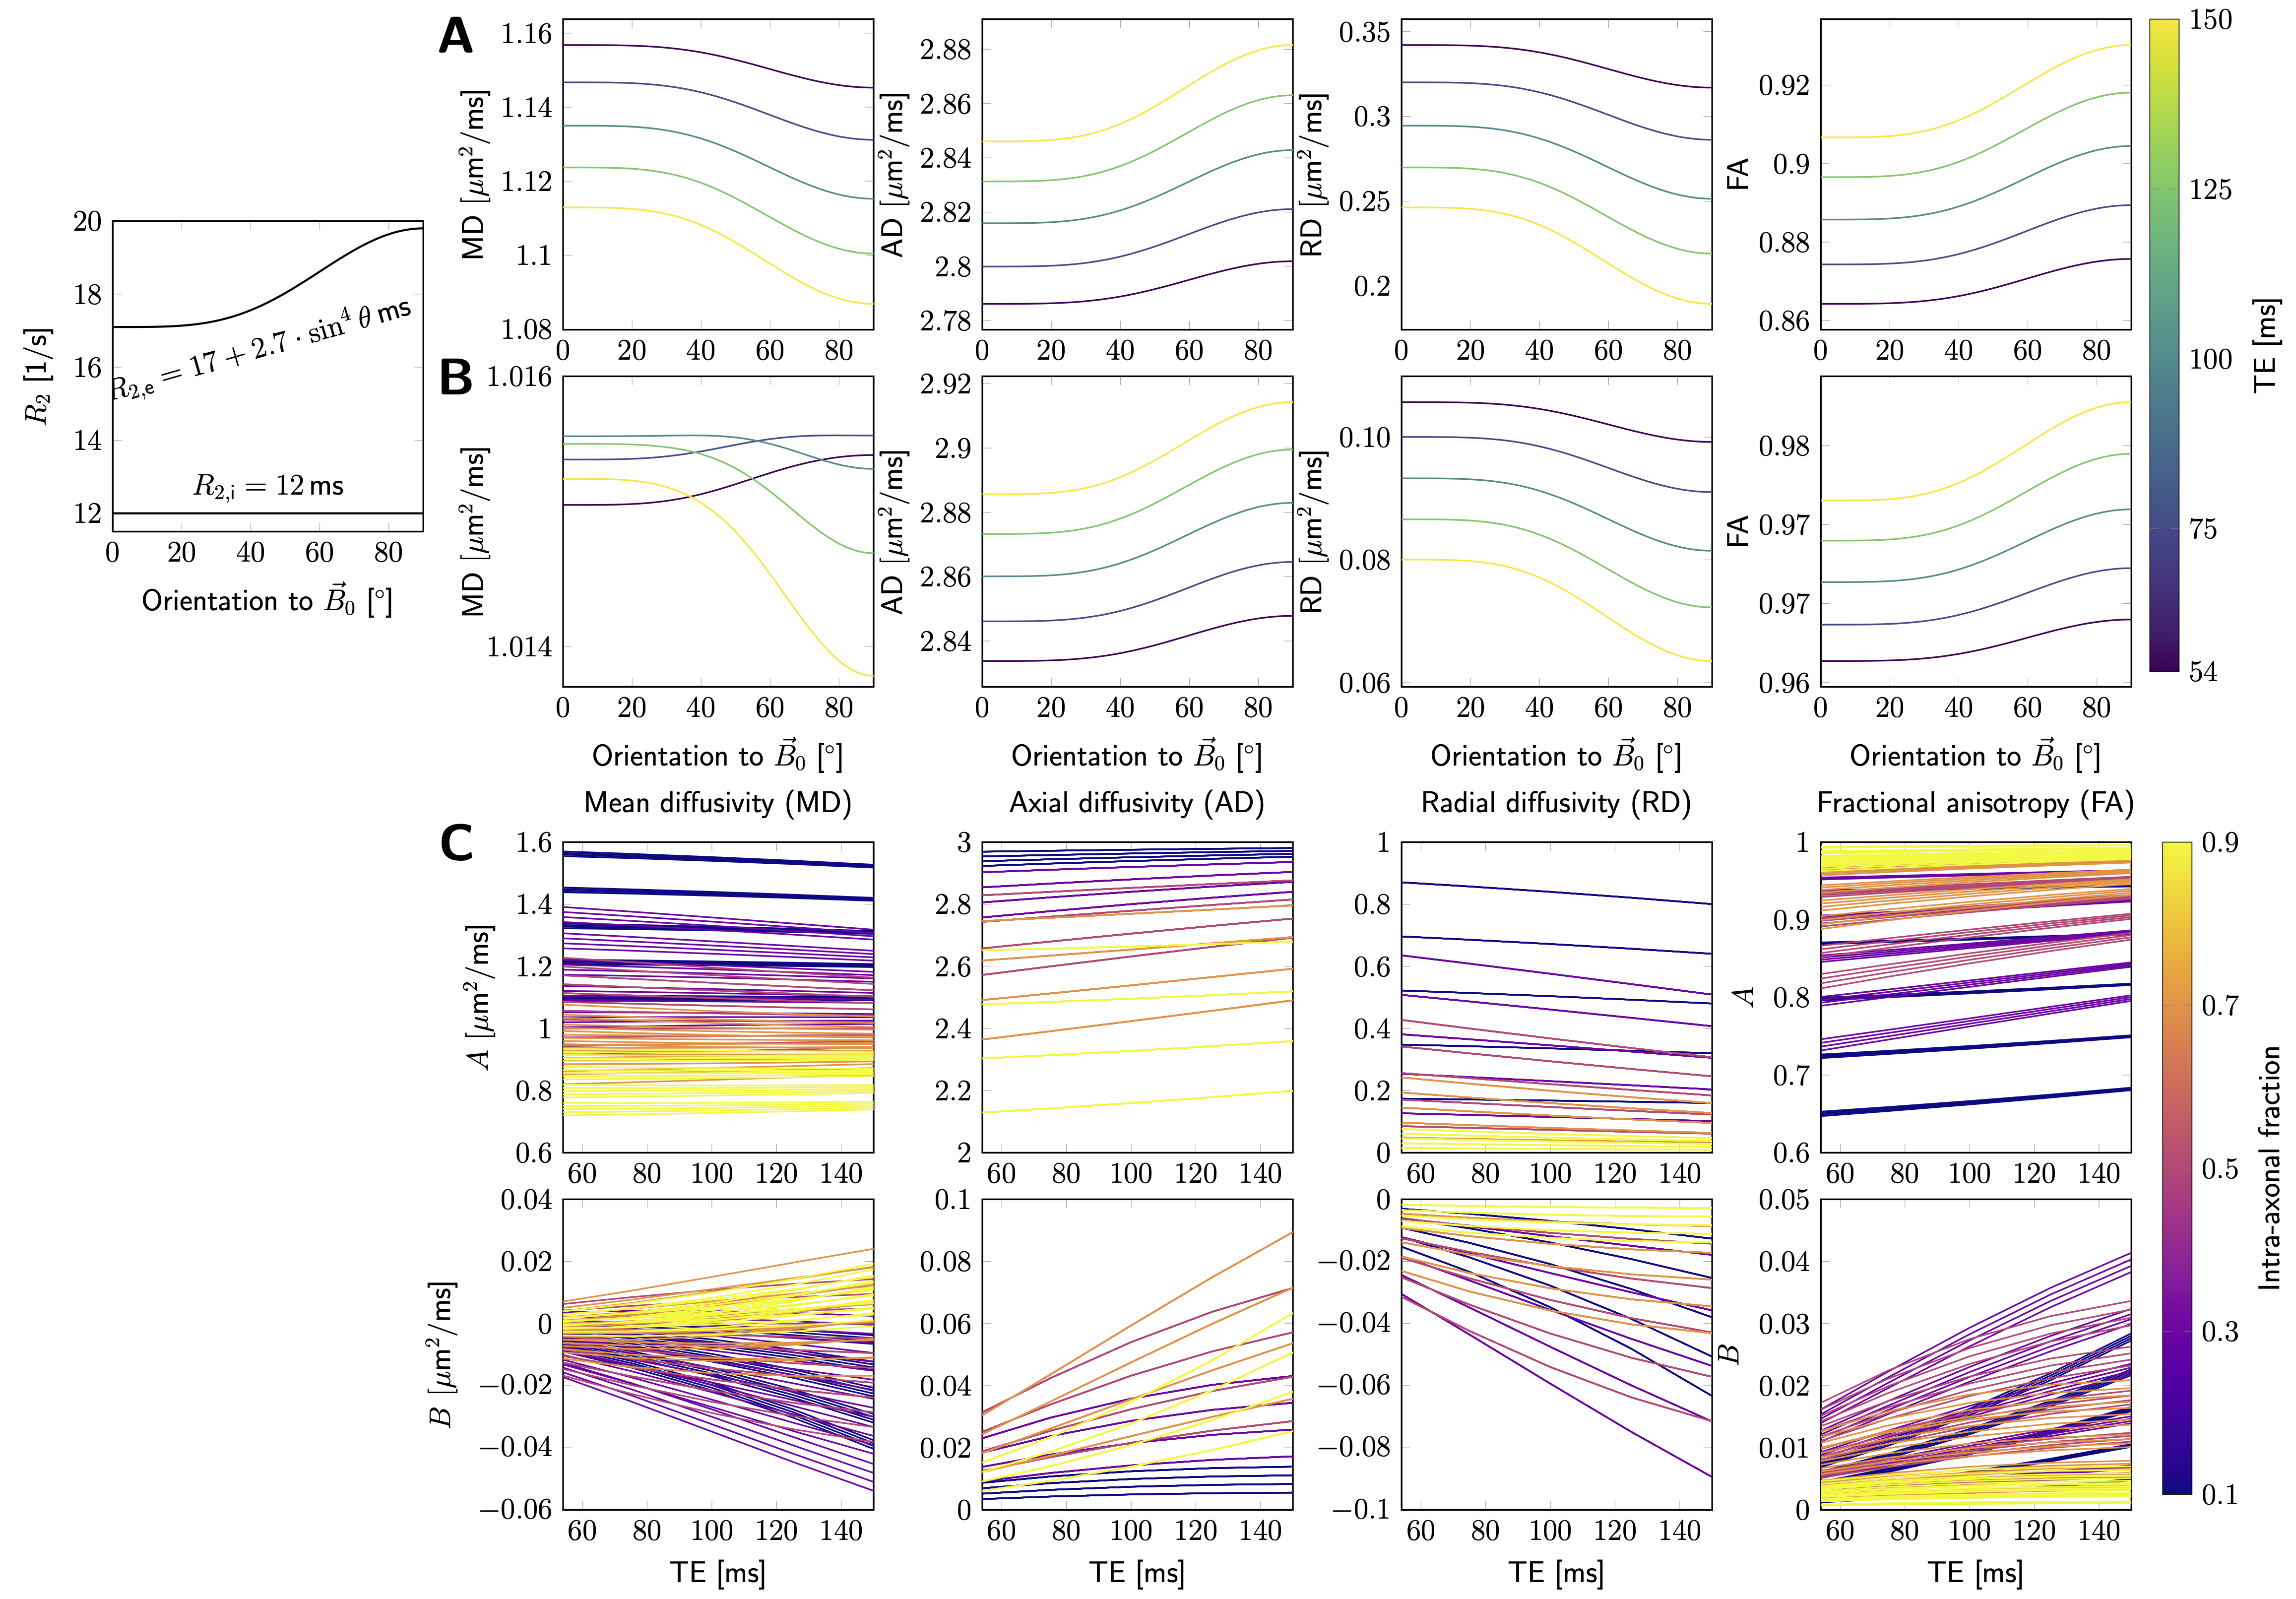
DT measures were simulated as a function of orientation θ w.r.t. B0 using Eq.3. The examples in A&B used following parameter settings: A. [Di,$$$\parallel$$$, De,$$$\parallel$$$, De,$$$\bot$$$, f]=[3,2.5,0.8,0.5]; B. [Di,$$$\parallel$$$, De,$$$\parallel$$$, De,$$$\bot$$$, f]=[3,2.5,0.2,0.4].
C. Estimated A and B (Eq.4, n=2) as a function of TE, for a range of scenarios Di,$$$\parallel$$$=3, De,$$$\parallel$$$=[2,2.2,2.4,2.6], De,$$$\bot$$$=[0.2,0.4,0.6,0.8,1], f=[0.1,0.3,0.5,0.7,0.9].
D is in μm2/ms. The settings for R2,i/e(θ) are shown in the plot.