2457
Detection of Iron Oxide Nanoparticles (IONPs)-Labeled Stem Cells Using Quantitative UTE Imaging1Radiology, University of California San Diego, San Diego, CA, United States, 2VisiCELL Medical Inc, San Diego, CA, United States, 3Radiology Service, VA San Diego Healthcare System, San Diego, CA, United States
Synopsis
Non-invasive, clinically applicable tracking of therapeutic cells by magnetic resonance imaging (MRI) offers unparalleled insight into the safety and efficacy of cell-based therapies in the body. Here we used a series of 3D quantitative UTE techniques including UTE-QSM, UTE-T1, and UTE-T2* mapping to evaluate the MR characteristics of stem cells labeled with a proprietary nanoparticle formulation that simultaneously labels cells for both optical and MR imaging. In a phantom experiment, all quantitative UTE parameters showed strong correlation with concentrations of labeled stem cells. Interestingly, in ex vivo mouse imaging, only UTE-QSM and UTE-T2* mapping detected the injected, labeled stem cells.
Introduction
Stem and immune cell therapy offers promising treatment solutions for many diseases in oncology and regenerative medicine applications, including Parkinson’s and multiple sclerosis1. Non-invasive imaging of cellular therapeutics in the subjects during and after cell therapy is critical for assessing safety and understanding efficacy for an effective treatment strategy. A variety of iron oxide nanoparticles (IONPs)-based stem cell labeling agents have been utilized for MRI-based cell tracking2–4, including ferumoxytol, a magnetically active FDA-approved intravenous iron supplement that can be used off-label as an MRI-visible stem cell labeling agent5,6. However, ferumoxytol’s T2* decreases as its concentration increases5,7, making higher densities of ferumoxytol-labeled stem cells a difficult detection target for clinical MRI. Ultrashort echo time (UTE) sequences are able to detect signals from short T2* components such as iron8–10. In this study, the efficacy of a series of 3D quantitative UTE (qUTE) techniques was investigated for the detection and quantification of IONPs-labeled stem cells.Methods
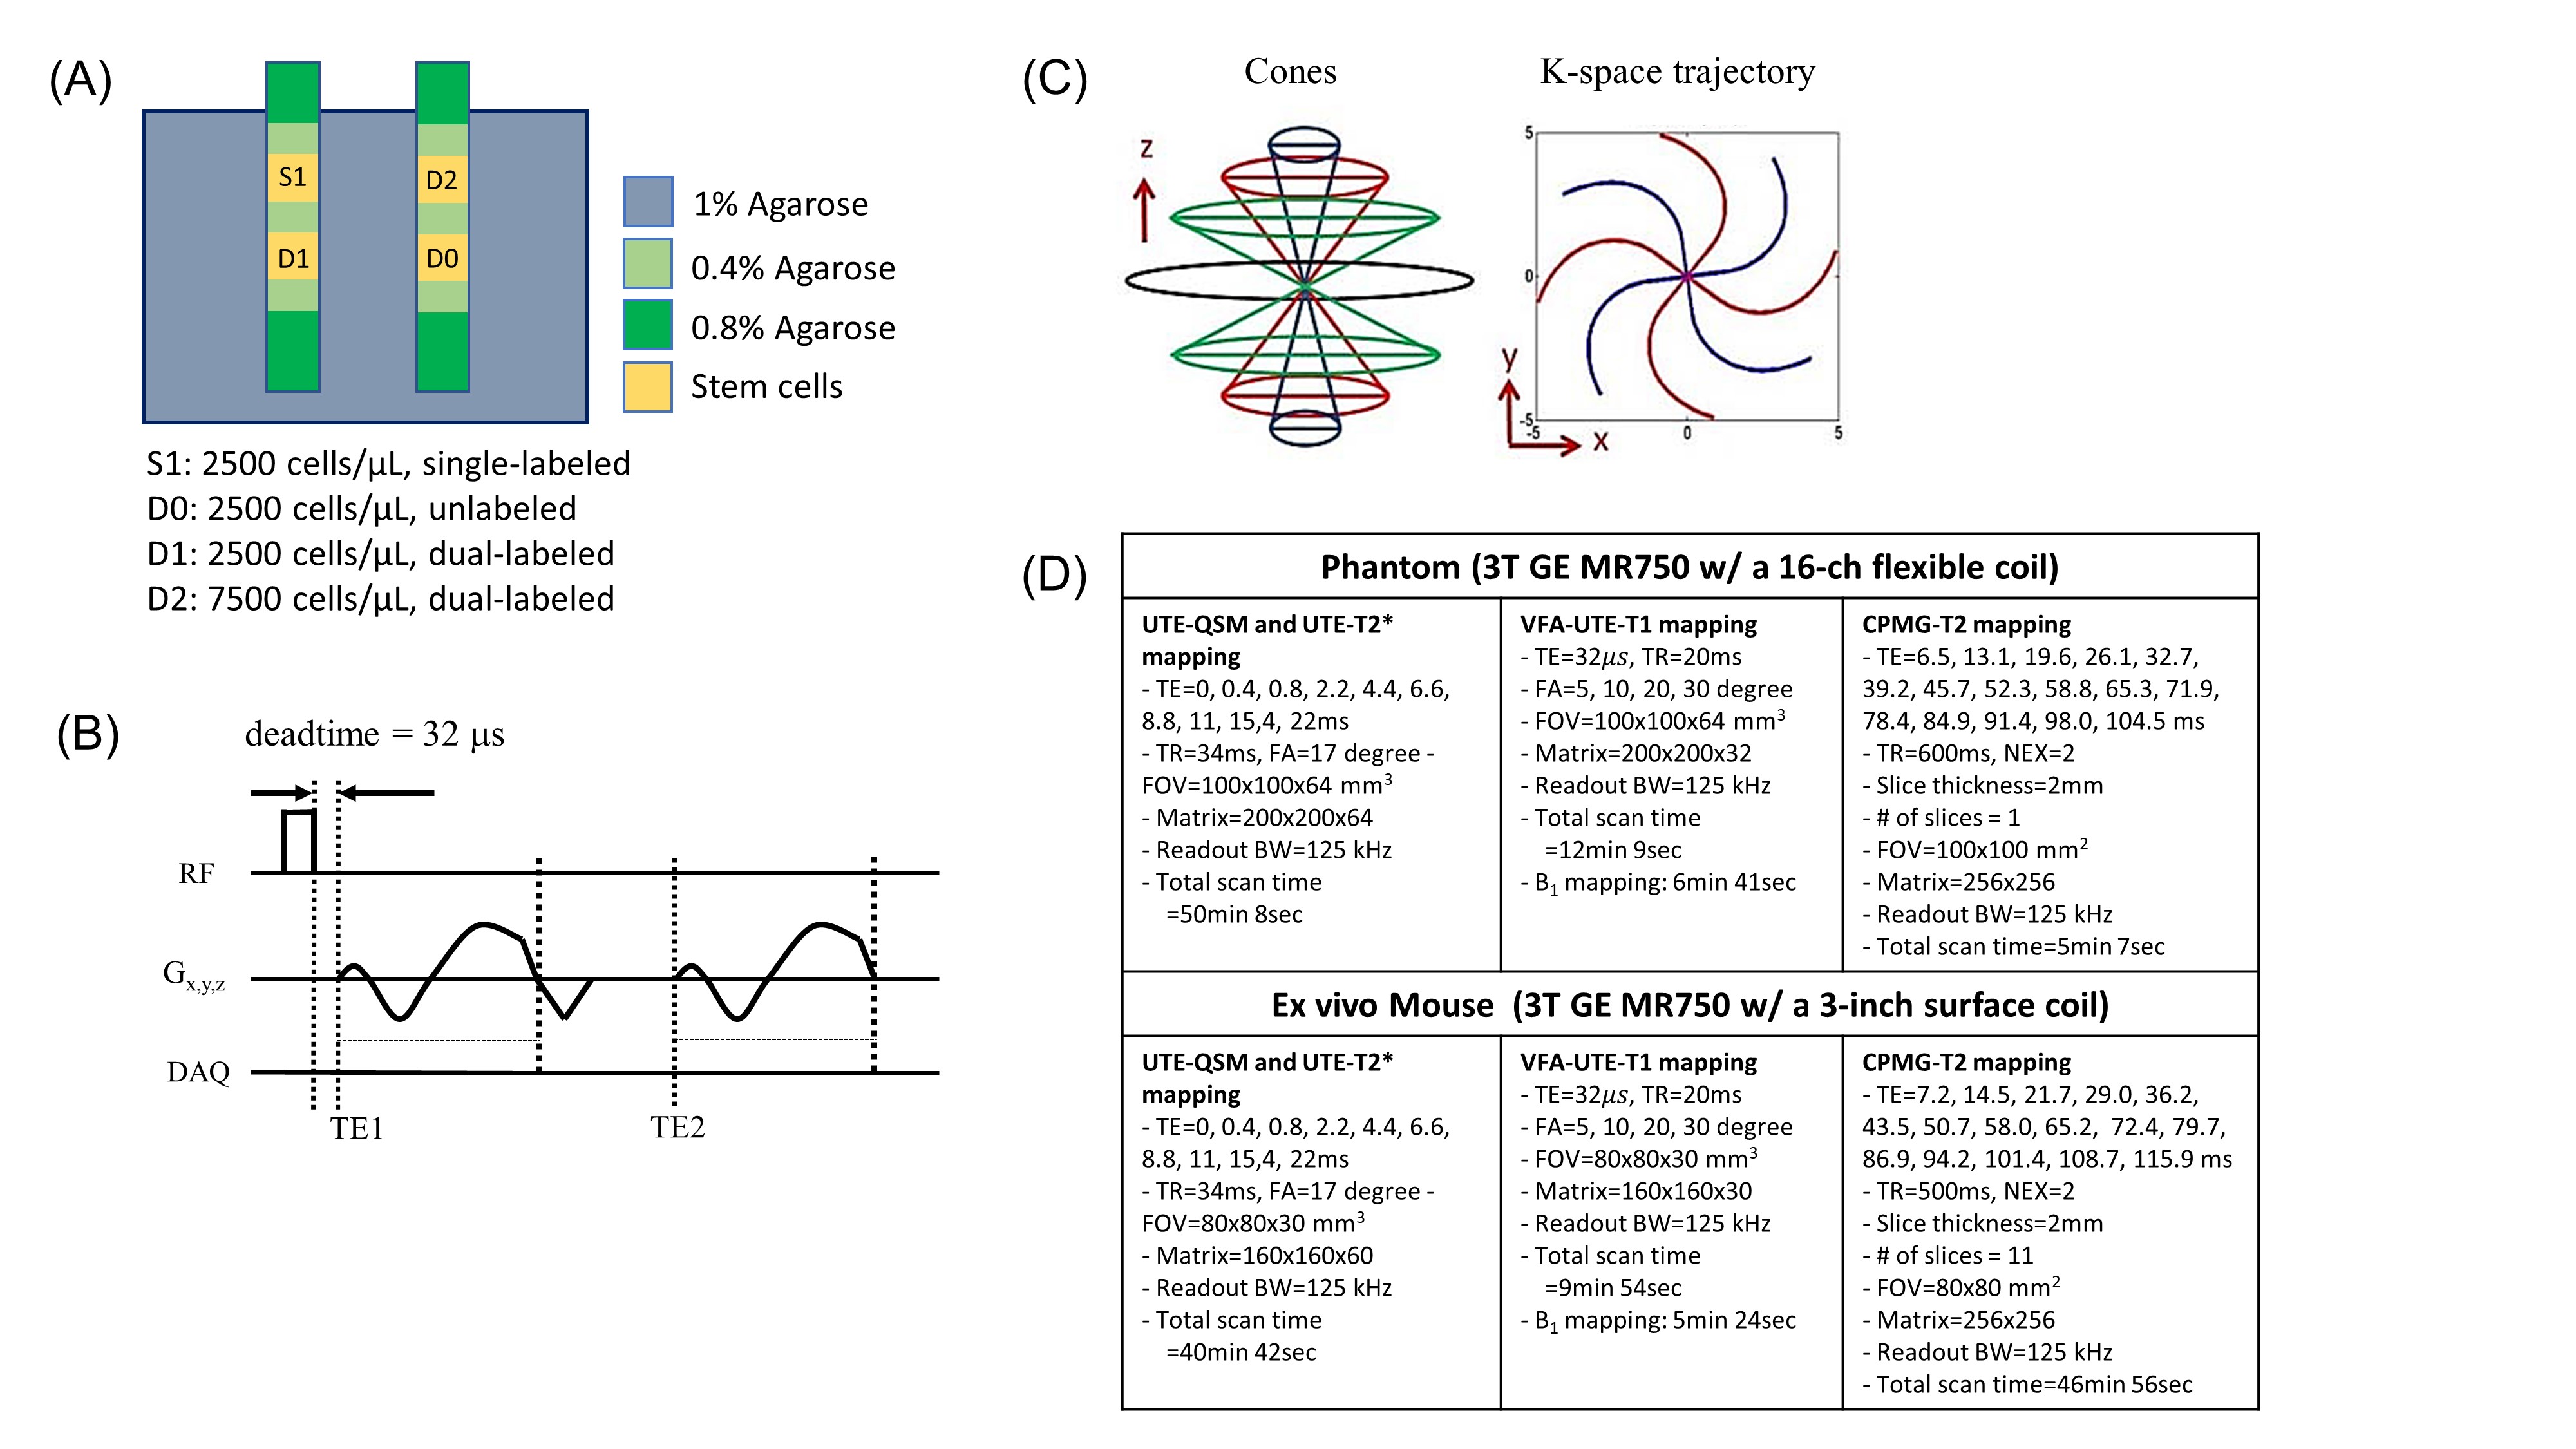
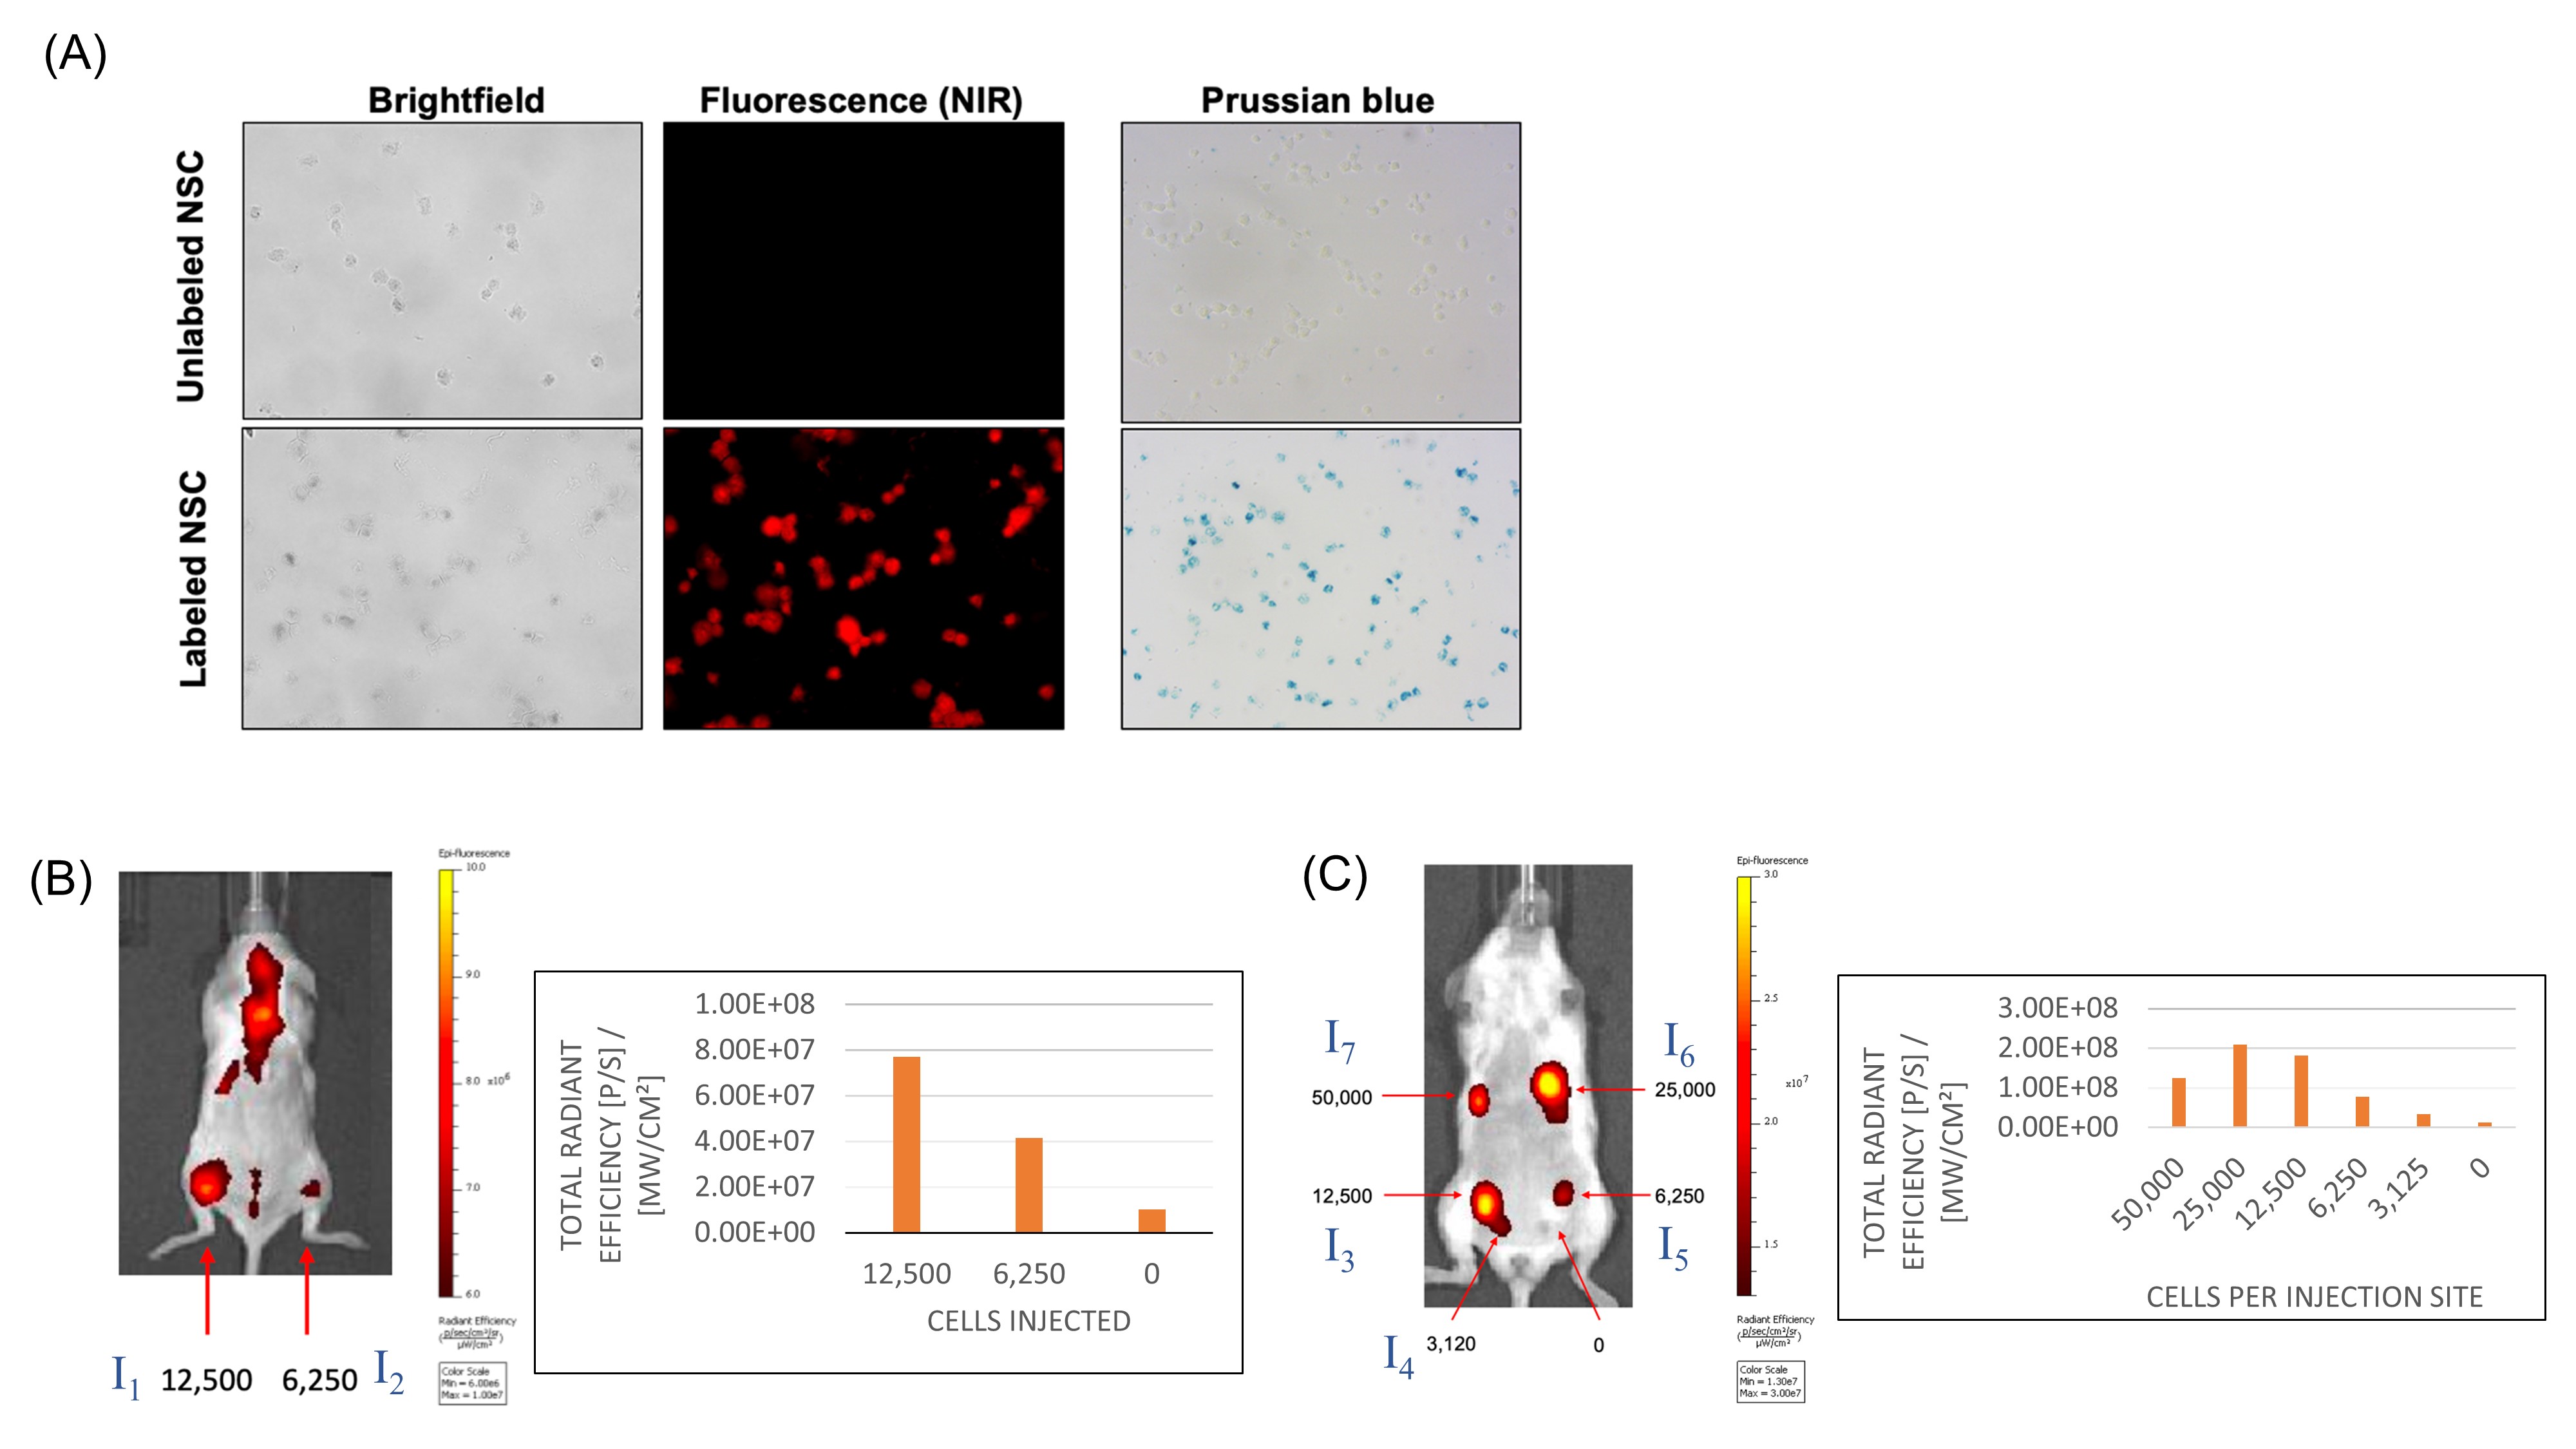
Cell labeling: Human neural stem cells (NSCs) were labeled using VMI-Trac Dual, a proprietary nanoparticle formulation that labels cells with ferumoxytol and NIR dye that together enable cell tracking through optical and magnetic resonance imaging (MRI), according to manufacturer’s protocol (Visicell Medical Inc., La Jolla, CA). Treated cells were washed to remove unincorporated nanoparticles, fixed with 4% paraformaldehyde, and examined by Prussian Blue staining and fluorescence microscopy.Phantom design: Figure 1A shows the phantom that was prepared for validation of qUTE imaging. Specified numbers of unlabeled (2500 cell/mL, D0) and dual-labeled (2500 and 7500 cell/mL, D1 and D2) NSCs were suspended in 0.4% low melt agarose and layered in 3-mL syringes. A syringe of NSCs labeled with ferumoxytol (2500 cell/mL, S1) was included as a positive control (single-labeled).
Ex vivo mouse imaging: 3120, 6250, 12500, 25000, or 50000 labeled NSCs were injected into the mammary fat pads of a 14-week-old NSG™ mouse. 6250 and 12500 labeled NSCs were also injected intramuscularly into the mouse’s gastrocnemius. All injections were 50ml. Post-injection, imaging was performed on an IVIS Spectrum. Post-imaging, the mouse was euthanized and underwent MR imaging.
MR Imaging: Images were acquired using the Carr Purcell Meiboom Gill (CPMG) T2 mapping sequence and 3D UTE-Cones-based quantitative susceptibility mapping (UTE-QSM)8, variable flip angle UTE-T1 (VFA-UTE-T1) mapping11 and UTE-T2* mapping12 sequences, as shown in Figures 1B and 1C. The MRI parameters are shown in Figure 1D.
Data Processing: The data analysis algorithm was written in MATLAB. For T1 and T2* calculation, the Levenberg-Marquardt method was used for nonlinear least-squares curve fitting. For the QSM calculation, morphology enabled dipole inversion (MEDI)13-based QSM reconstruction was utilized. The T2 map was calculated using the toolkit on the scanner along with images acquired with the CPMG sequence.
Results
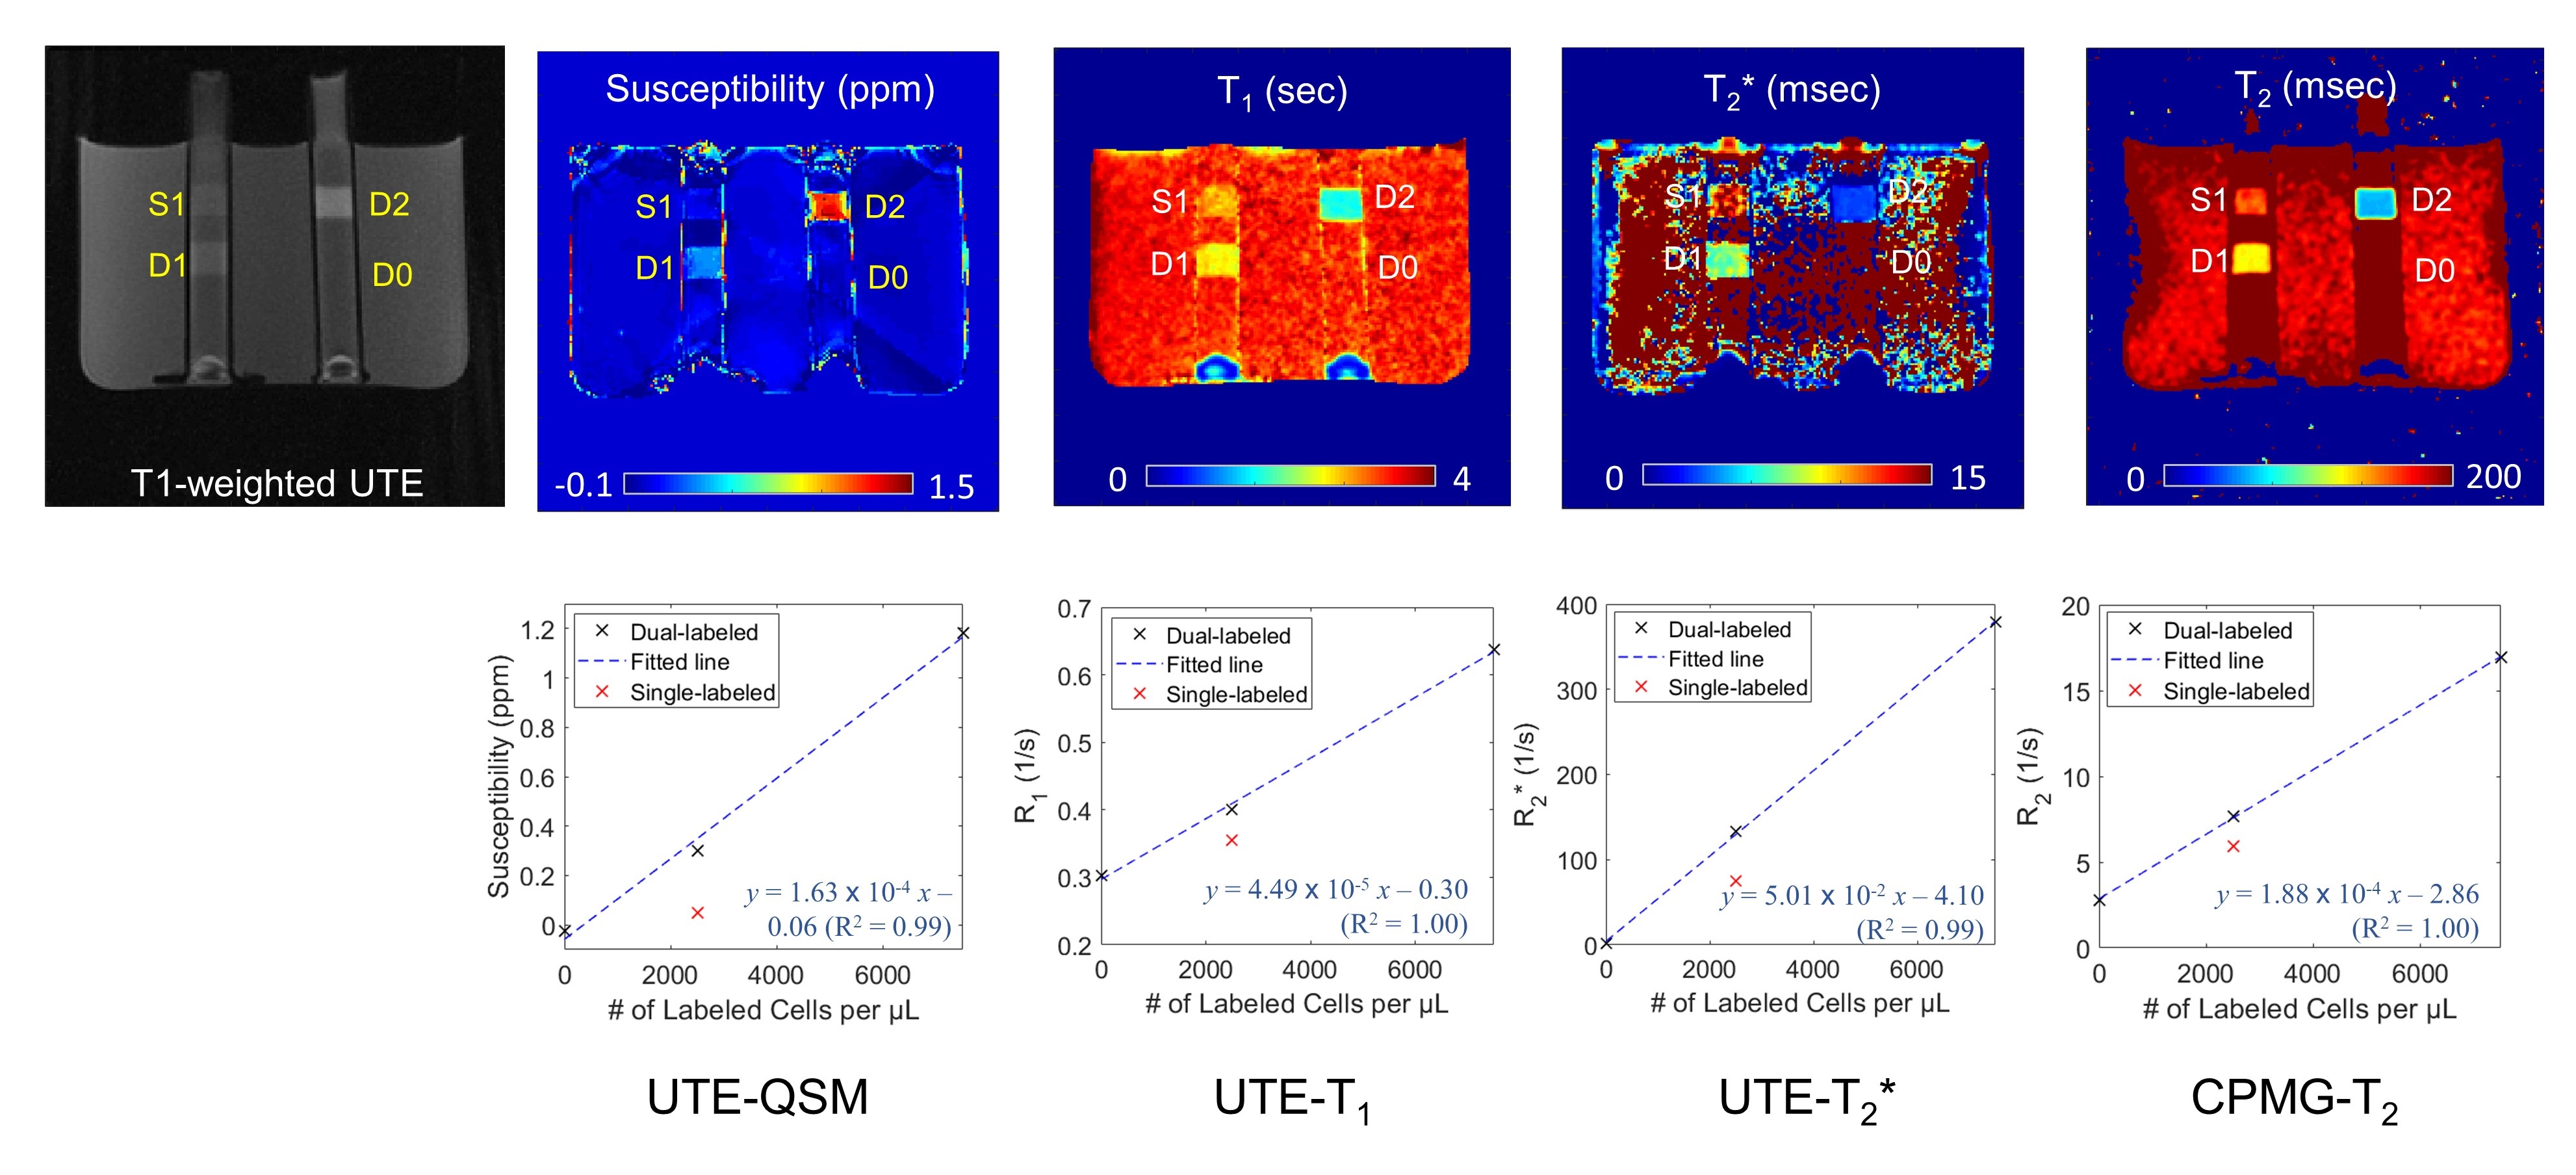
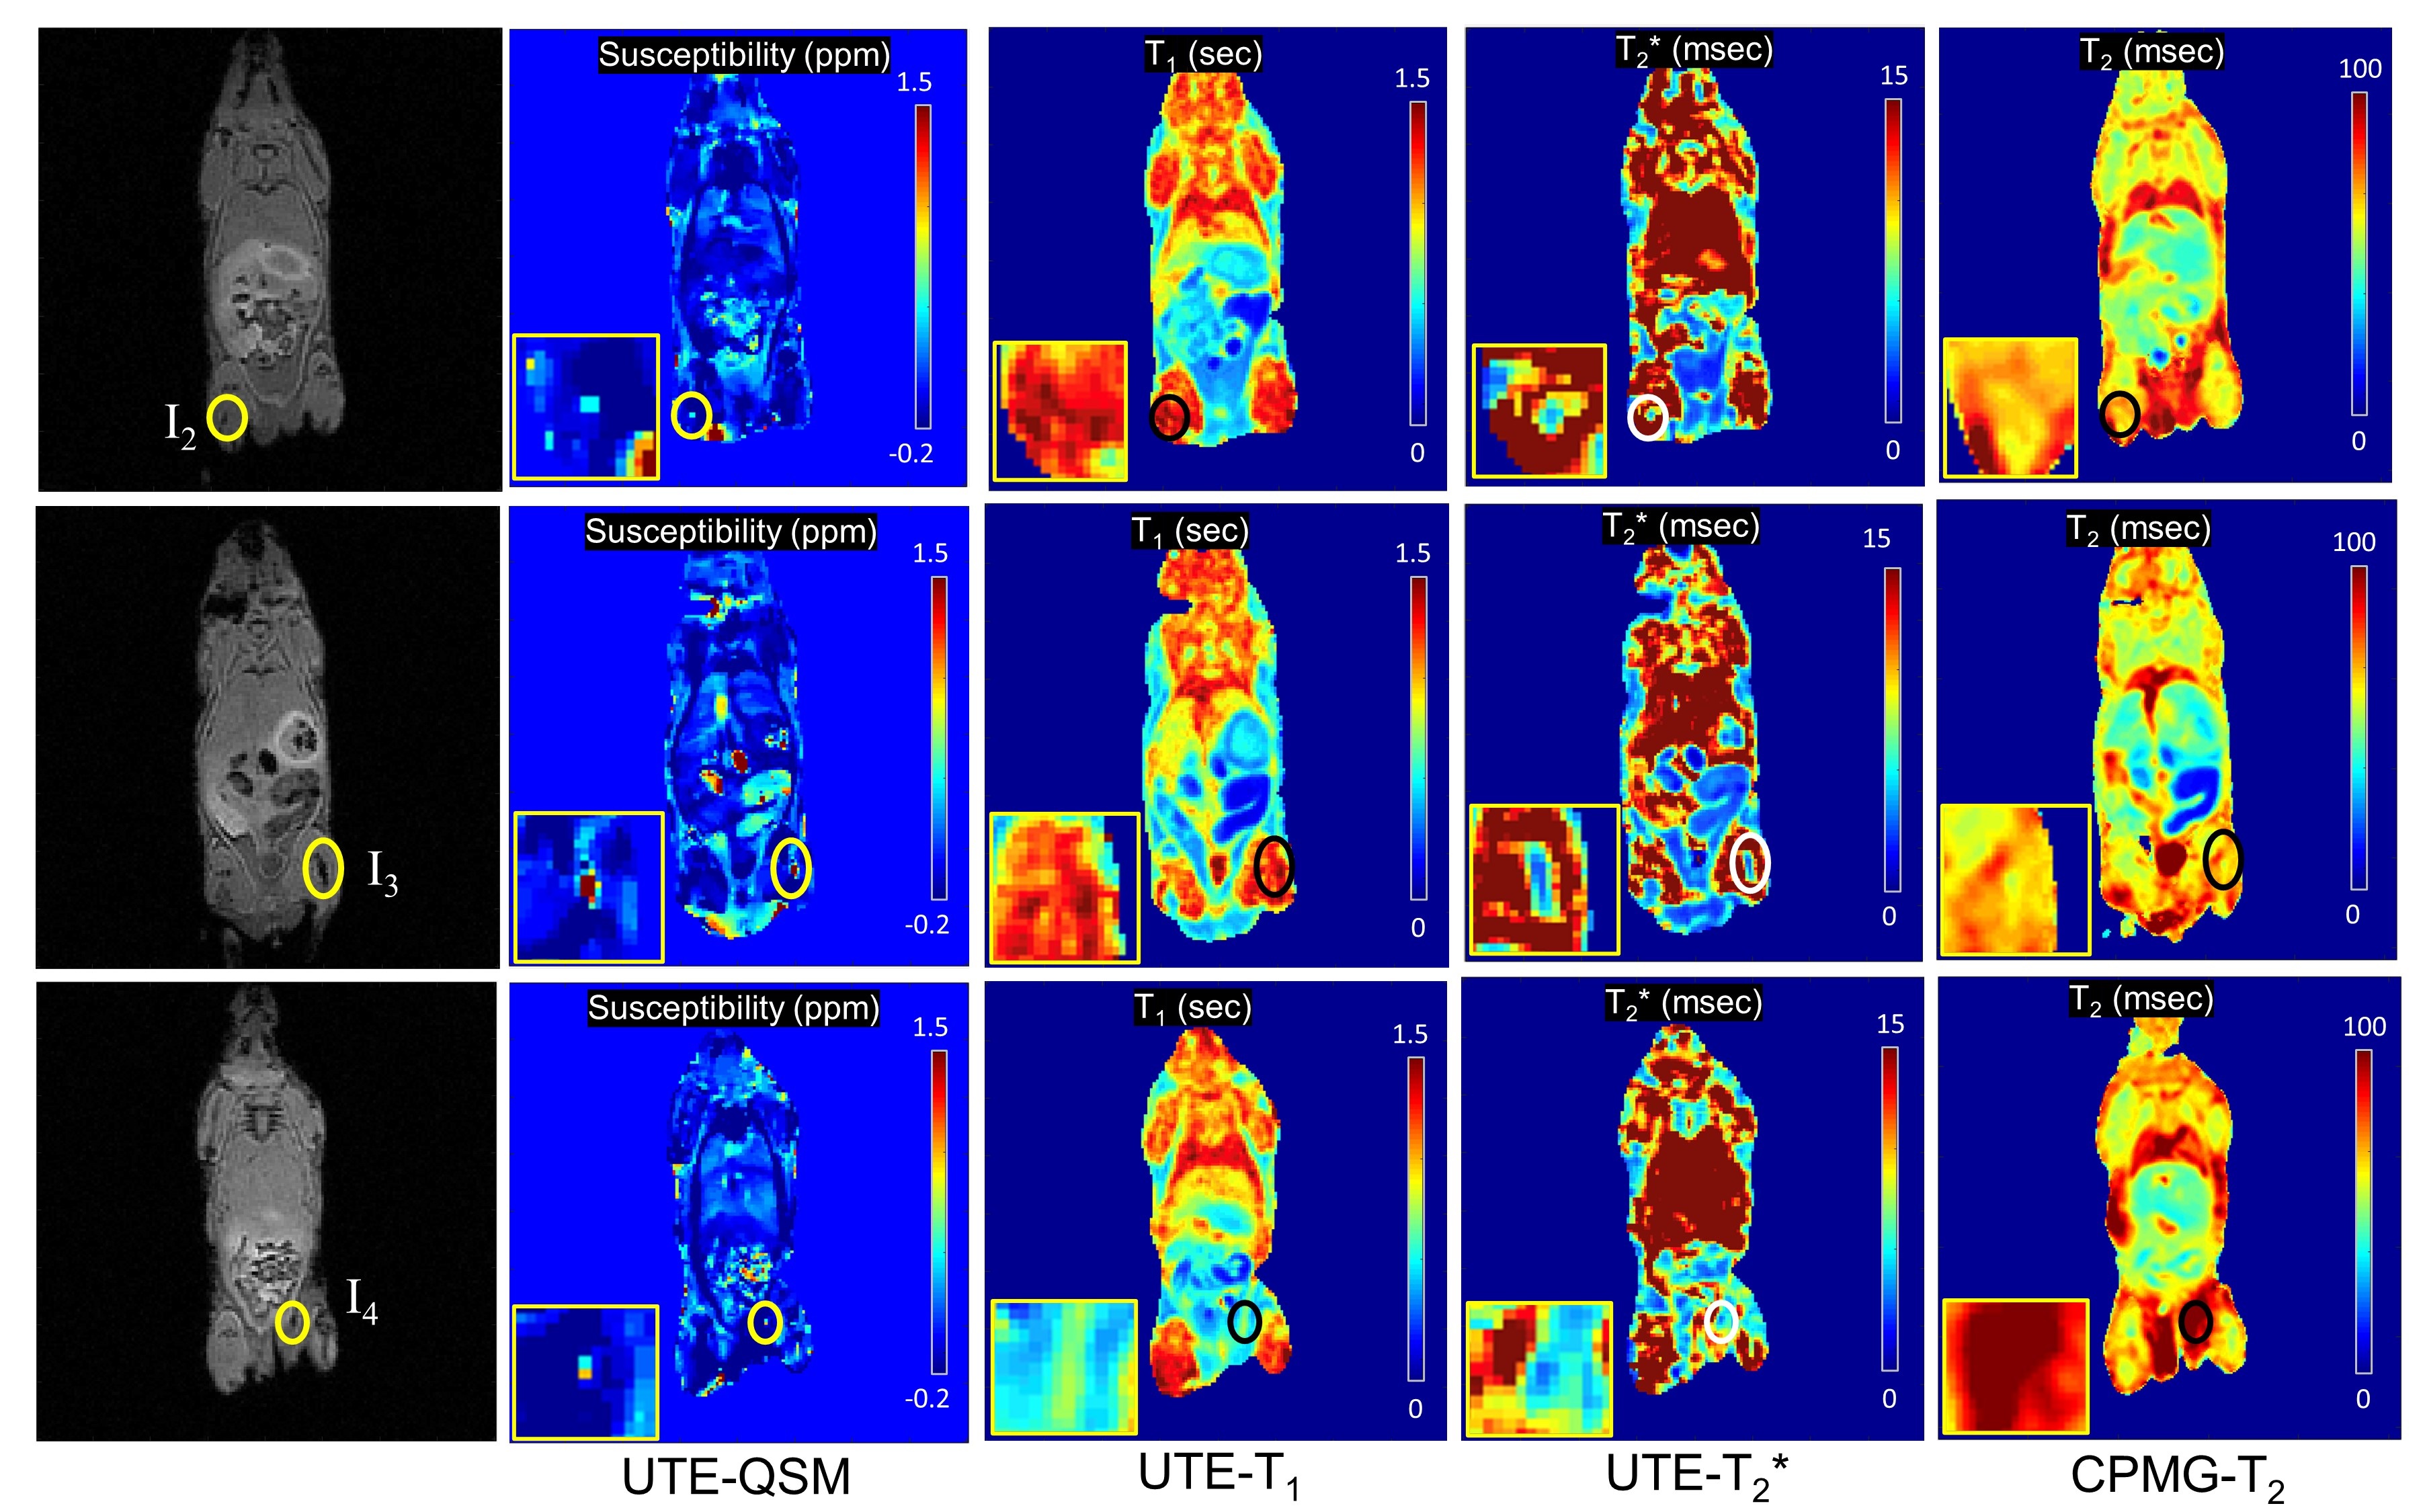
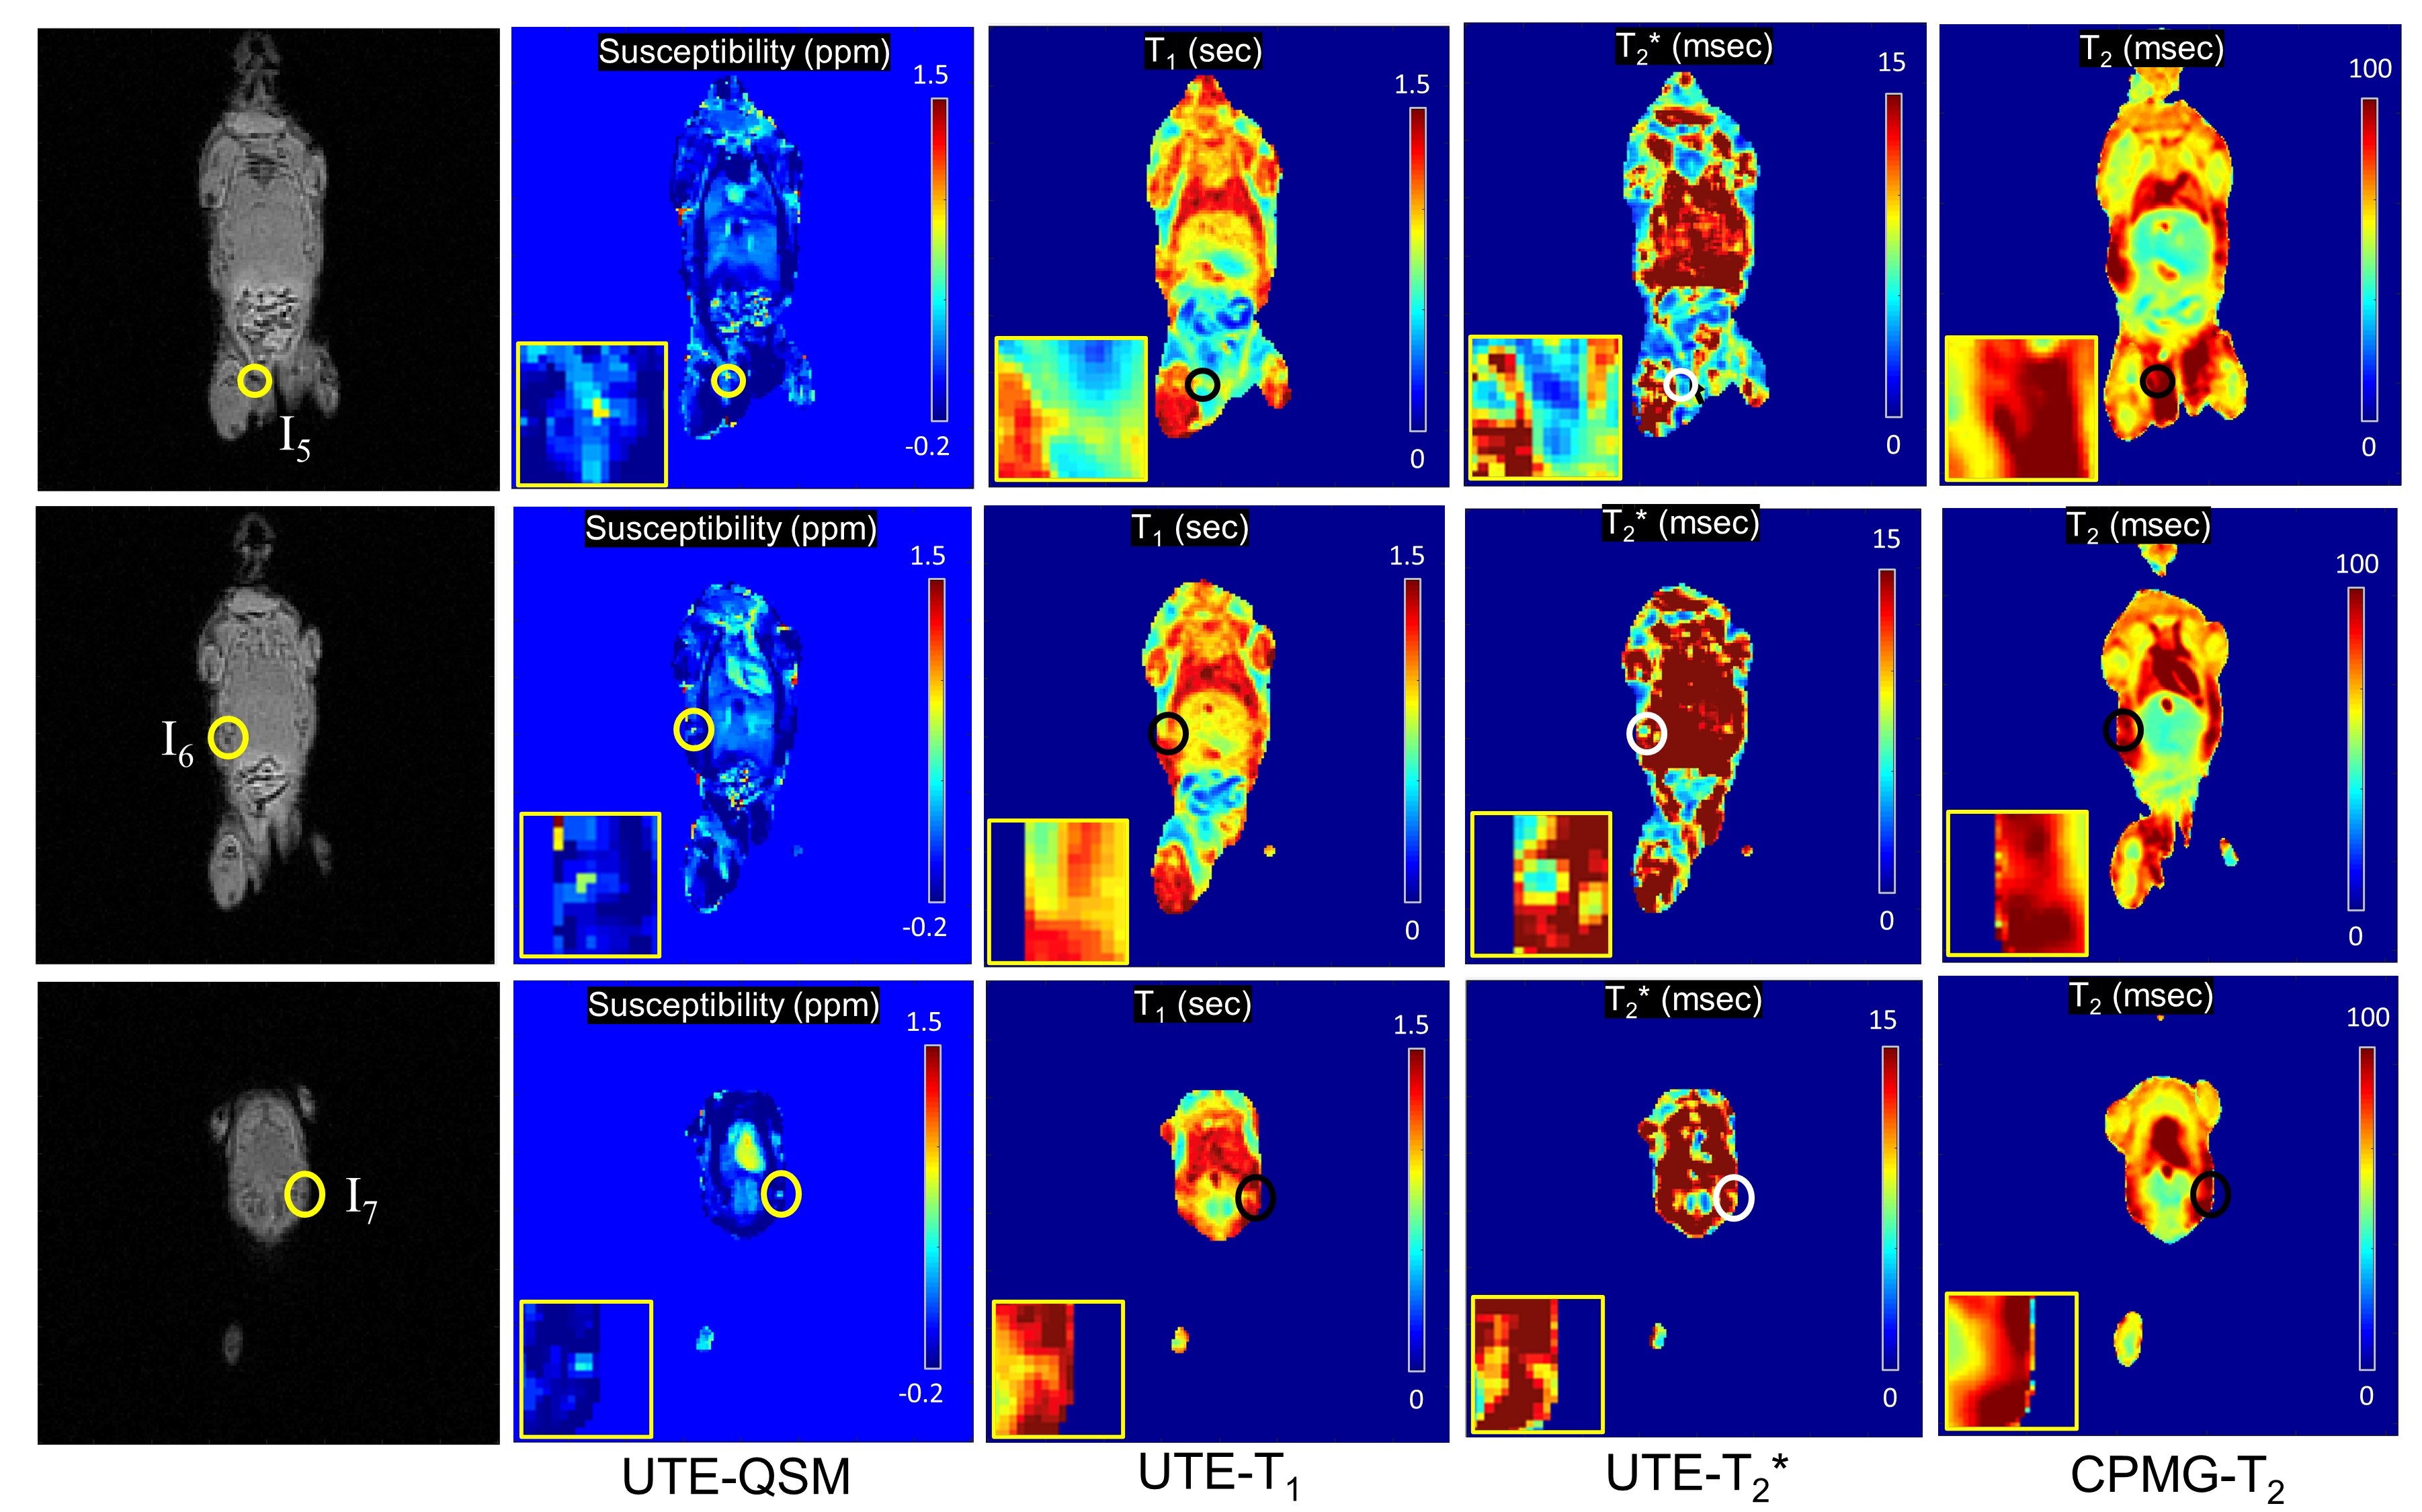
Figure 2A shows that 100% of the labeled NSCs stained positive for Prussian blue and were visualized by fluorescence microscopy, illustrating efficient loading of NIR dye and ferumoxytol into stem cells by VMI-Trac Dual. After injection into the gastrocnemius muscle (Figure 2B) or mammary fat pads (Figure 2C), labeled cells could be tracked by optical imaging on an IVIS scanner. Figure 3 shows susceptibility, UTE-T1, UTE-T2*, and CPMG-T2 parameter maps of the unlabeled and labeled stem cells in the phantom. The estimated magnetic susceptibility, R1, R2*, and R2 all showed nearly perfect linear correlations with the density of labeled cells (R2 > 0.99). In the ex vivo experiment with an NSC-injected mouse, qUTE techniques detected a total of six injected regions (I2-I7) out of seven possible regions. Figures 4 and 5 show all parameter maps in the corresponding slices. UTE-QSM showed elevated susceptibility in the regions injected with the labeled stem cells (I2-I7) more clearly than other techniques. UTE-T2* mapping exhibited decreased relaxation times in the most injected regions (I2-I7) but was obscured by surrounding tissues with high inhomogeneity. UTE-T1 and CPMG-T2 showed no significant changes in relaxation times of the injected regions.Discussion and Conclusion
In this study, we demonstrated that IONPs-labeled stem cells could be detected by qUTE-MR techniques including UTE-QSM, UTE-T1, and UTE-T2* mapping. Although this study’s qUTE and CPMG-T2 techniques showed feasibility in quantification and localization of IONPs-labeled stem cells in the phantom experiment, only UTE-QSM and UTE-T2* demonstrated quantitative changes in the injected regions of the ex vivo mouse, with UTE-QSM showing the best performance. As most soft tissues are slightly diamagnetic in a living system, paramagnetic IONPs with high positive susceptibility can provide high contrast in UTE-QSM. UTE-T2* is also an effective approach in this regard as T2* depends on susceptibility related dephasing (i.e., T2’), but because T2* only depends on the magnitude of susceptibility, not the positive or negative nature of susceptibility (e.g., bone vs. iron), T2* is prone to the inhomogeneity of the surrounding tissues. The shortest T1 (D2) measured in the phantom was 1.57 seconds. This explains why T1 was not effective in the ex vivo mouse imaging. Since most tissues showed a T1 value below 1.5 seconds, the labeled stem cells with long T1 could not be detected with high contrast. Further studies are planned to investigate these findings in further depth in vivo.Acknowledgements
The authors acknowledge grant support from the NIH (R01AR062581, R01AR068987, R01AR075825, R01AR078877, and R21AR075851), Veterans Affairs (I01RX002604, I01CX002211, and I01CX001388), and GE Healthcare.References
1. Olle Lindvall, Zaal Kokaia. Stem cells for the treatment of neurological disorders. Nature 2006;441:1094–1096.
2. Nedopil A, Klenk C, Kim C, et al. MR SignalCharacteristics of Viable and Apoptotic HUman Mesenchymal Stem Cells in MASI for Treatment of Osteoarthritis. Invest. Radiol. 2010;45:634–640.
3. Henning TD, Boddington S, Daldrup-Link HE. Labeling hESCs and hMSCs with iron oxide nanoparticles for non-invasive in vivo tracking with MR imaging. J. Vis. Exp. 2008:12–13.
4. Simon GH, Von Vopelius-Feldt J, Fu Y, et al. Ultrasmall supraparamagnetic iron oxide-enhanced magnetic resonance imaging of antigen-induced arthritis: A comparative study between SHU 555 C, ferumoxtran-10, and ferumoxytol. Invest. Radiol. 2006;41:45–51.
5. Thu MS, Bryant LH, Coppola T, et al. Self-Assembling Nanocomplexes by combining Ferumoxytol, Heparin And Protamine For Cell Tracking by MRI. Nat. Med. 2012;18:463–467.
6. Gutova M, Frank JA, D’Apuzzo M, et al. Magnetic Resonance Imaging Tracking of Ferumoxytol-Labeled Human Neural Stem Cells: Studies Leading to Clinical Use. Stem Cells Transl. Med. 2013;2:766–775.
7. Khurana A, Nejadnik H, Chapelin F, et al. Ferumoxytol: a new, clinically applicable label for stem-cell tracking in arthritic joints with MRI. Nanomedicine 2013;8:1–23.
8. Jang H, Drygalski A, Wong J, et al. Ultrashort echo time quantitative susceptibility mapping (UTE‐QSM) for detection of hemosiderin deposition in hemophilic arthropathy: A feasibility study. Magn. Reson. Med. 2020;84:3246–3255.
9. Lu X, Ma Y, Chang EY, et al. Simultaneous quantitative susceptibility mapping (QSM) and R2* for high iron concentration quantification with 3D ultrashort echo time sequences: An echo dependence study. Magn. Reson. Med. 2018;79:2315–2322.
10. Jang H, Lu X, Carl M, et al. True phase quantitative susceptibility mapping using continuous single‐point imaging: a feasibility study. Magn. Reson. Med. 2019;81:1907–1914.
11. Ma Y, Zhao W, Wan L, et al. Whole knee joint T1 values measured in vivo at 3T by combined 3D ultrashort echo time cones actual flip angle and variable flip angle methods. Magn. Reson. Med. 2018;81:1634–1644.
12. Chang EY, Du J, Iwasaki K, et al. Single- and Bi-component T2* analysis of tendon before and during tensile loading, using UTE sequences. J. Magn. Reson. Imaging 2015;42:114–120.
13. Liu J, Liu T, De Rochefort L, et al. Morphology enabled dipole inversion for quantitative susceptibility mapping using structural consistency between the magnitude image and the susceptibility map. Neuroimage 2012;59:2560–2568.
Figures