2455
Single shot multiple overlapping-echo acquisition combined with deep learning for ultra-fast T2 mapping in glioma: A preliminary study1The First Affiliated Hospital of Zhengzhou University, Zhengzhou, China, 2Department of Magnetic Resonance Imaging, The First Affiliated Hospital of Zhengzhou University, Zhengzhou, China, 3Department of Electronic Science, Xiamen University, Xiamen, China, 4Philips Healthcare, Beijing, China
Synopsis
Quantitative MRI (qMRI) are expected largely to provide more accuracy clinical diagnostic information. However, bound by the relative long duration for the routine MRI exam and much longer qMRI acquisition time, the qMRI is not widely used for diagnostic purpose. The change of MR signal caused by contrast agent extravasation is affected by many factors, which will increase difficulty in diagnosis. Quantitative MRI (qMRI) are expected to overcome this issue. Recently, an ultra-fast multi-parameters qMRI technique was developed by our group, and herein we aim to apply the proposed strategy on brain tumor imaging and to preliminary access the potential performance.
Pupose
To apply single shot ultra-fast multi-parameters quantitative MRI (qMRI) pulse sequence combined with following deep learning reconstruction method on brain tumor imaging before and after enhancement.METHODS
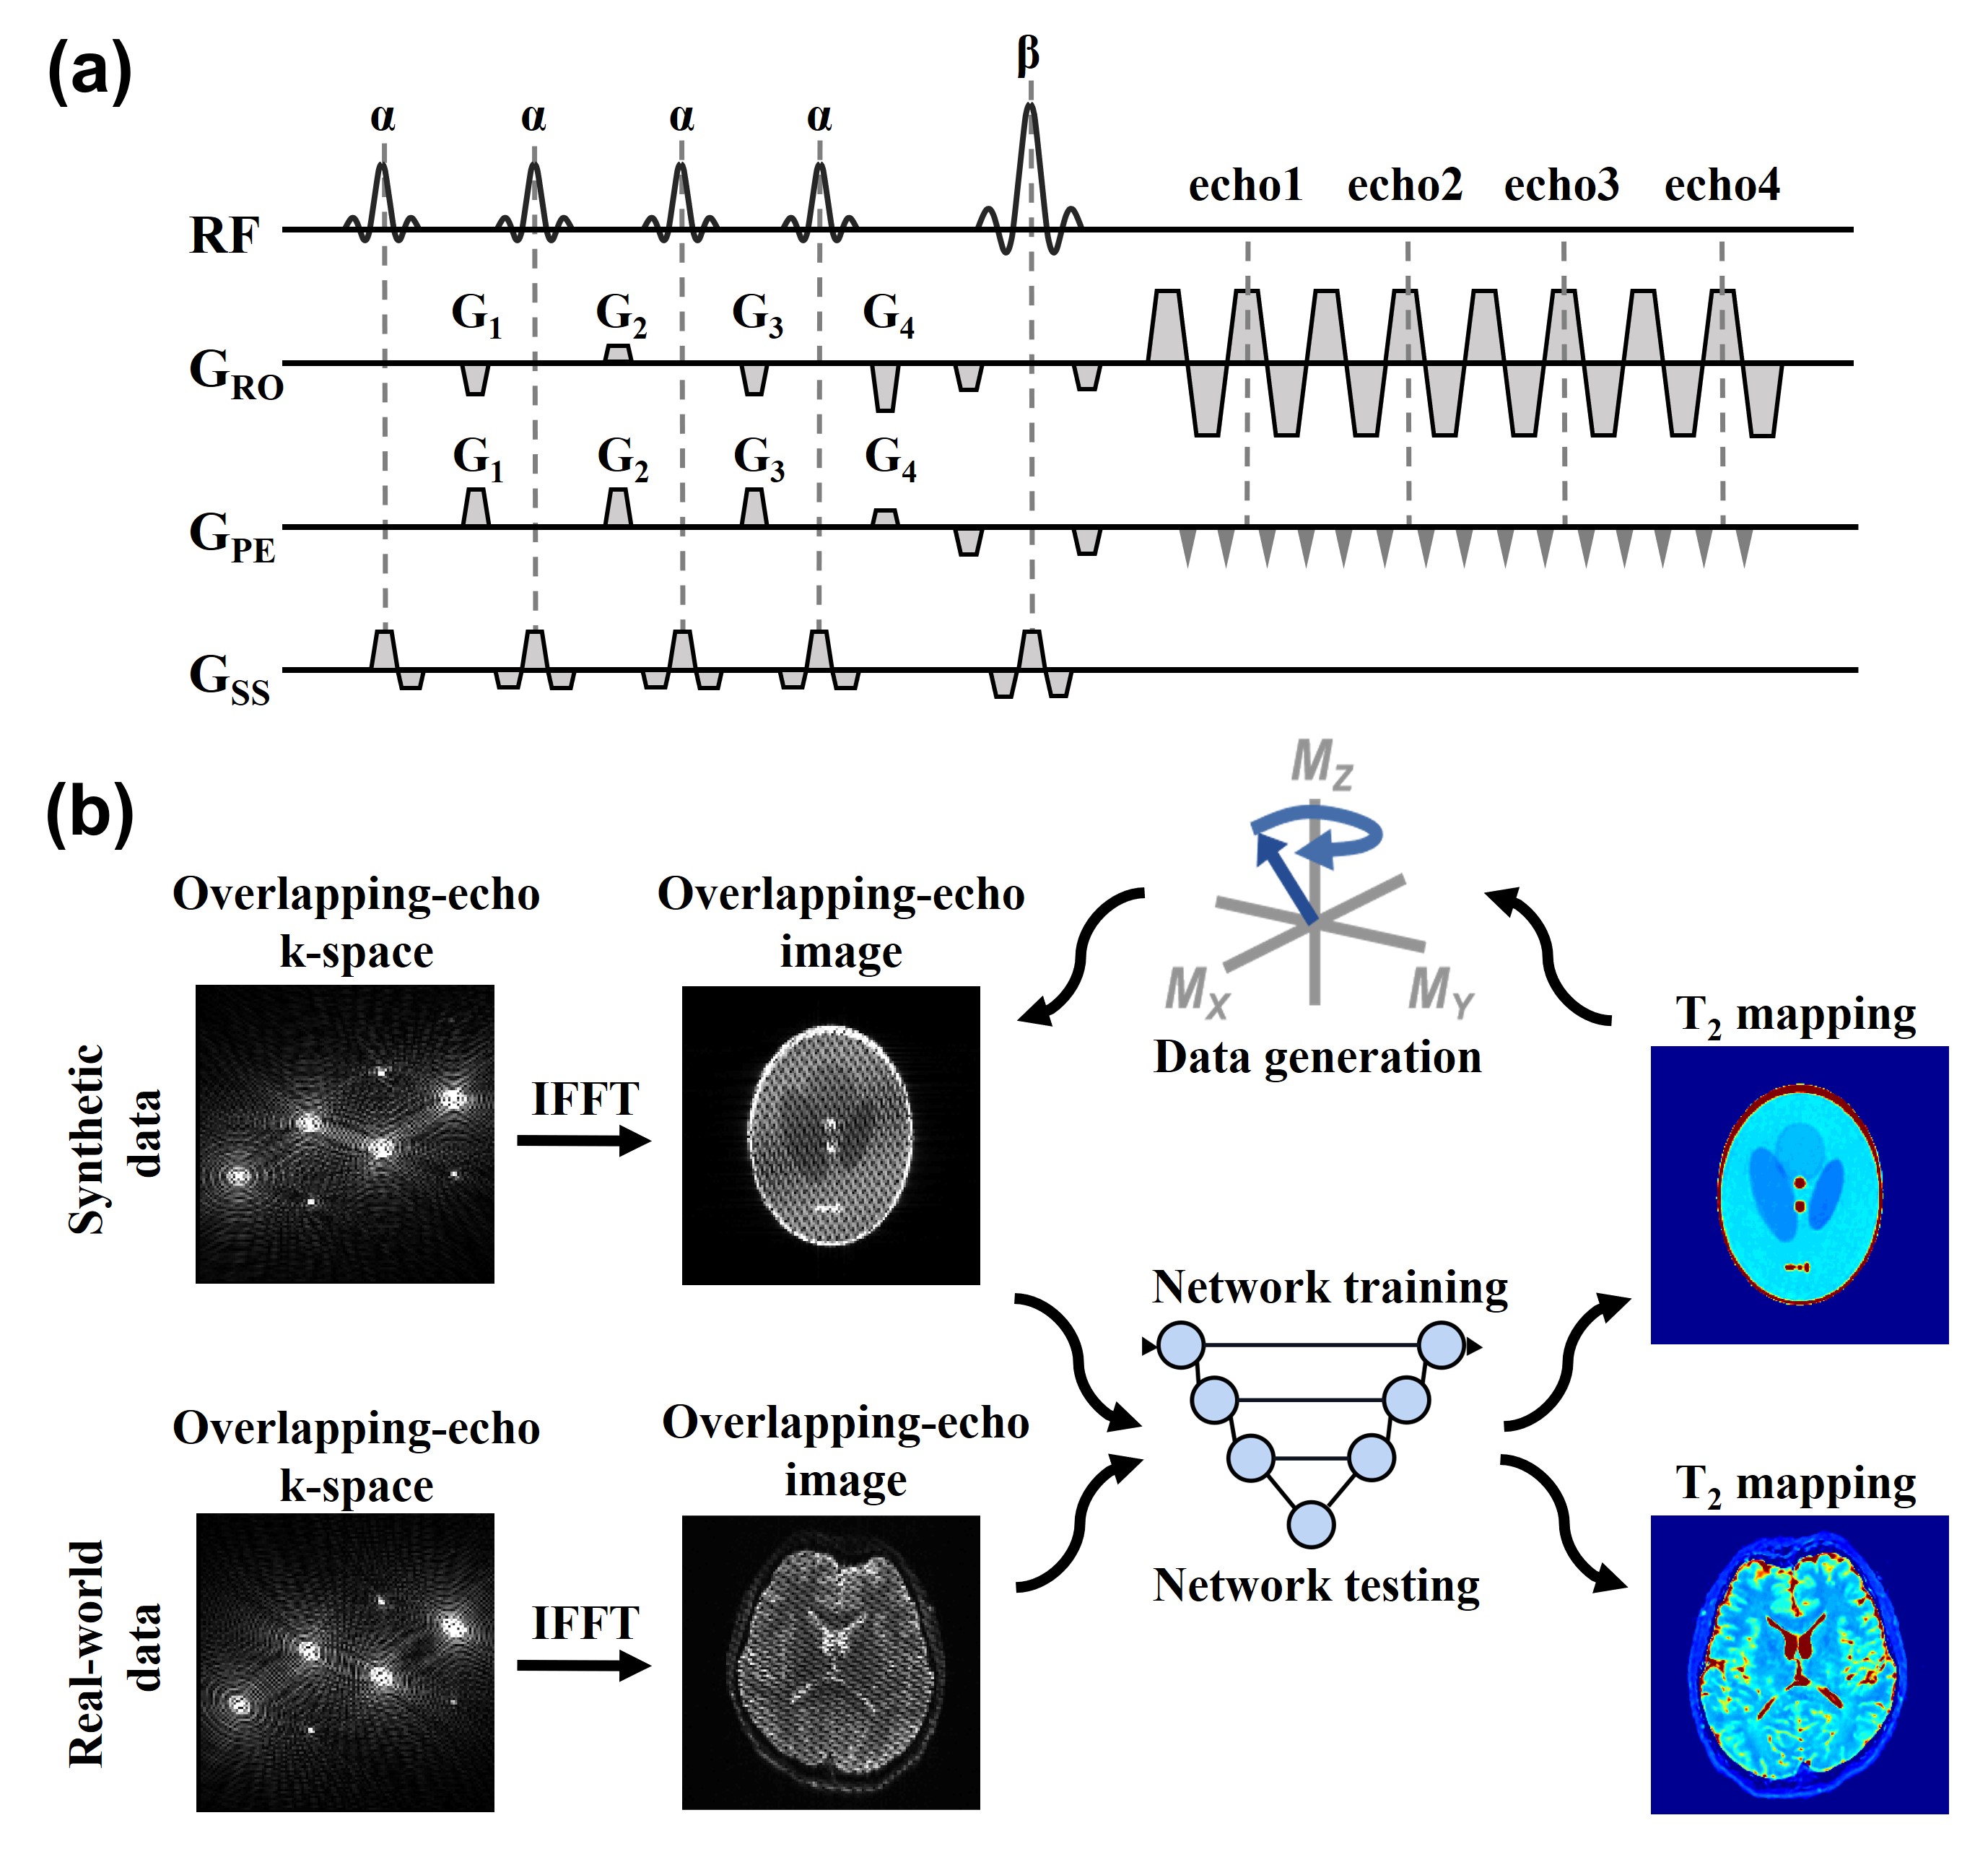
MR measurements were performed on a 3.0-T scanner with a 64-channel head coil. The image acquisition time for the single shot multiple overlapping-echo sequence1,2 is 32 s with following pamperers: TR=8000 ms, TE = 64 ms, flip angle = 30o, matrix = 128*128, bandwidth = 1302 Hz, slice thickness = 5 mm, number of excitations (NEX)= 2, strong fat suppression. The pulse sequence diagram is show in the Figure 1a. The first four α pulses are excitation pulse and the fifth β pulses are for generating echoes. G1, G2 G3 and G4 are shift gradients along phase and frequency encoding directions and paired spoiled gradients were performed before and after the β pulse. Figure 1b shows the reconstruction flowchart via deep learning. The subject is a 33-year-old male patient, diagnosed with space-occupying lesion in left the frontotemporal island. For comparison purpose, the patient was scanned both before and after the injection of the contrast agent. The patient was informed of the study protocol and procedure and provide written informed consent. This study was approved by the first Affiliated Hospital of Zhengzhou University. ROIs (in the tumor parenchyma and nearby region) based T2 measurements were applied on the T2 mapping images with referring to other modalities.RESULTS
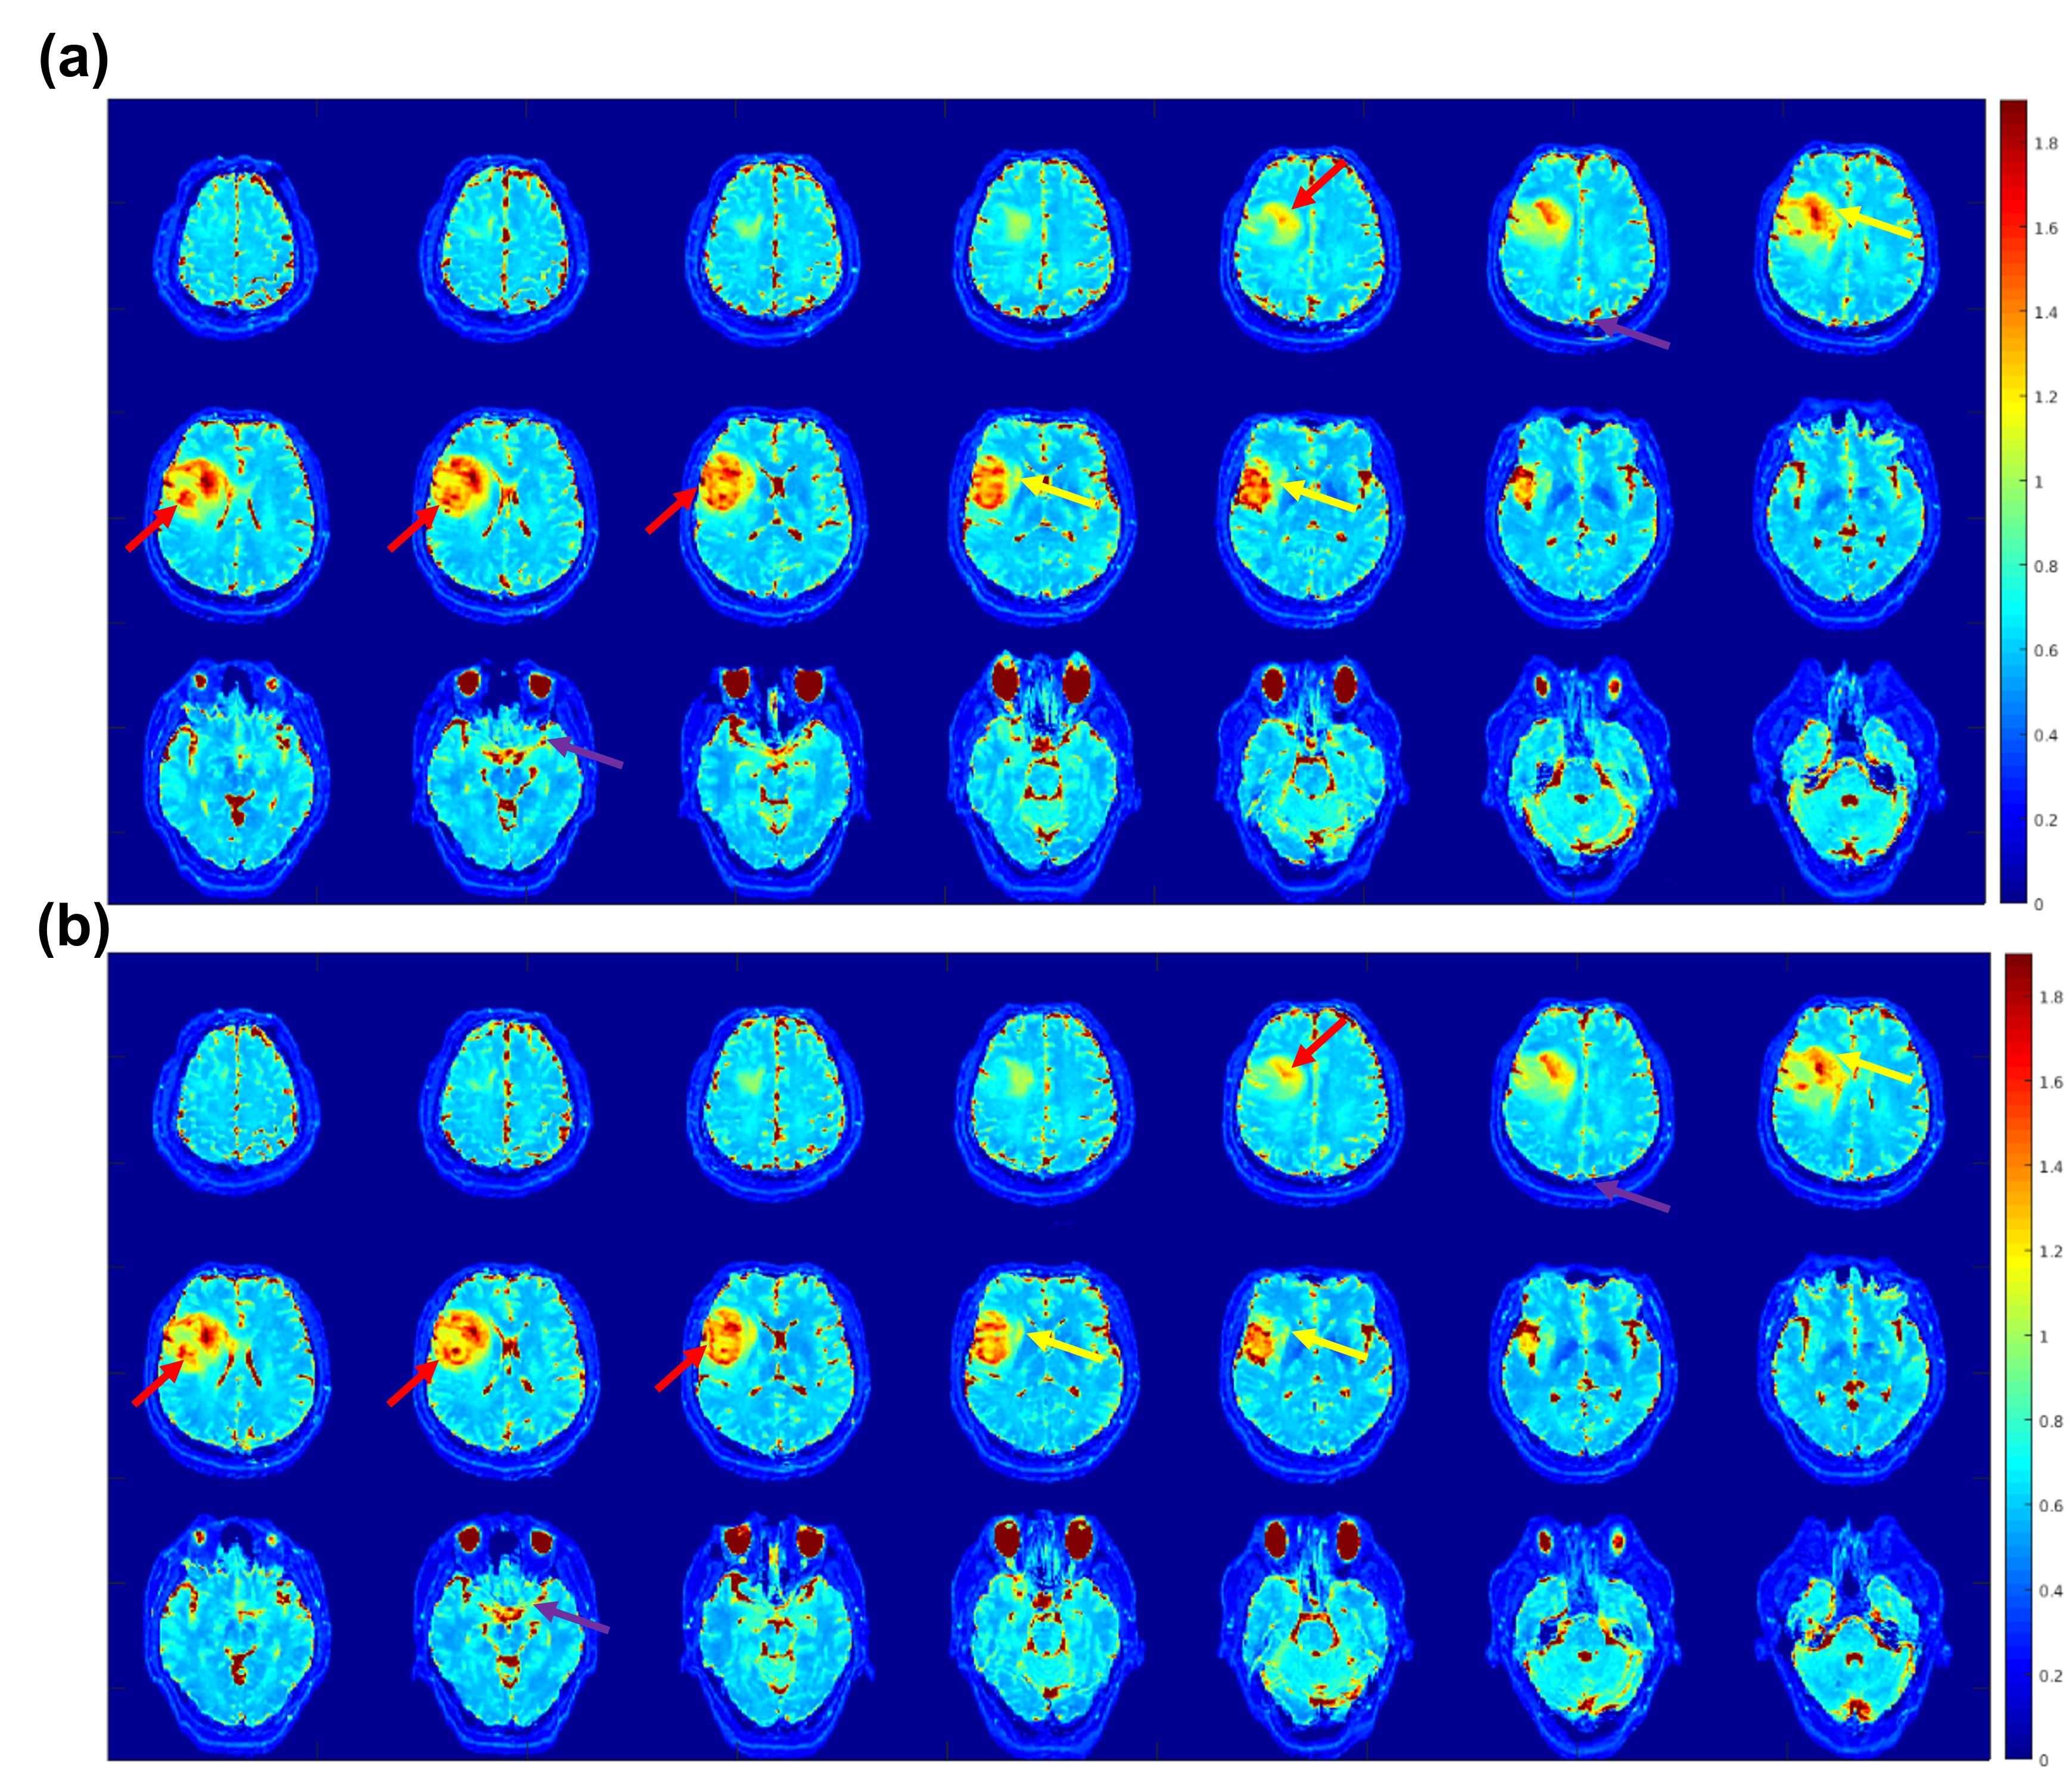
Due to the two NEX and 64-channel coil, the SNR for the raw images (not show here) seems to be sufficient for generating relaxation maps. As shown in Figure 2, the image quality is declared good and no obvious artifacts was noticeable in the experimental results. As expected, good contrast of T2 values between gray matter, white matter and CSF was observed. Before contrast injection (Figure 2a), in left the frontotemporal island, it is very clear that the round mass lesion shows relative overall high T2 value, which means the lesion may contain more free water than normal brain tissue. The T2 values is not uniform for the parenchymal tumor, and the boundary is clear. After the injection of contrast agent, T2 values in some tumor regions changes decreased (red arrows) and others are not (yellow arrows). The different patterns of T2 values changes may suggest different microvascular conditions for the brain tumors. The T2 values for the tumor parenchyma are about 178 ± 42 ms and the nearby region is about 121 ± 17 ms. There is not significantly different between pre and post injection the contrast agent for the normal appeared brain tissues.DISCUSSION AND CONCLUSION
For the first time, the whole brain T2 mapping was obtained via an ultra-fast single shot method on a tumor occupying patient and its feasibility was preliminary confirmed in this study. The quantitative T2 values may offer more diagnostic message than the weighting images. What’s more, the differences of T2 relaxion time in different tumor region between the pre and post contrast injection may suggest the permeability of the different tissues. More patients are needed in the future study to confirm the consistent relaxation time for the same kind lesions and further pathology study is need to explore the mapping relationships between the T2 values and the tumor microenvironment.Acknowledgements
This work was supported by the National Natural Science Foundation of China under grant numbers 82071913, 81601470,11775184, U1805261 and 81671674, and Leading (Key) Project of Fujian Province, 2019Y0001.
References
1. Zhang J, Wu J, Chen S, et al., Robust Single-Shot T2 Mapping via Multiple Overlapping-Echo Acquisition and Deep Neural Network. IEEE Trans Med Imaging. 2019; 38:1801-1811.2. Cai C, Wang C, Zeng Y, et al. Single-shot T2 mapping using overlapping-echo detachment planar imaging and a deep convolutional neural network. Magn Reson Med. 2018; 80: 2202– 2214.
Figures