2448
Magnetization transfer optimization to enhance 3D EPI image contrast for high-resolution fMRI applications at 7T1Wellcome Centre for Human Neuroimaging, UCL Queen Square Institute of Neurology, University College London, London, United Kingdom
Synopsis
3DEPI is widely used for cortical depth-dependent fMRI studies at 7T. However, it suffers from poor image contrast that can be problematic for fMRI post-processing steps. One solution to bolster contrast is to implement a magnetization transfer (MT) module. Here, we experimentally investigated the different MT pre-pulse characteristics to optimize image contrast, while considering power limitations at 7T. Contrast gains eased co-registration to an MP2RAGE reference, and improved cortical segmentation. Our analyses confirmed that the MT contrast is spatially variable and dependent on transmit field inhomogeneity.
Introduction
3D GE-EPI is widely used for high-resolution fMRI at 7T. Relative to 2D-EPI it offers higher SNR and avoids slice profile effects1,2, but exhibits greatly reduced image contrast which can be problematic for accurate registration3 and cortical segmentation, particularly in the context of partial coverage. EPI also suffers from spatial distortions due to low bandwidth in the phase-encoding (PE) direction, which is exacerbated by larger echo-spacing as resolution is increased.One solution is to acquire a whole-brain EPI volume with enhanced image contrast and matched spatial distortions. Recently, magnetization transfer (MT) contrast has been proposed for laminar fMRI4. Within power constraints, often a limiting factor at 7T, we examined the effect of pulse shape, duration, off-resonance frequency and flip-angle of the MT pre-pulse to optimize contrast.
Methods
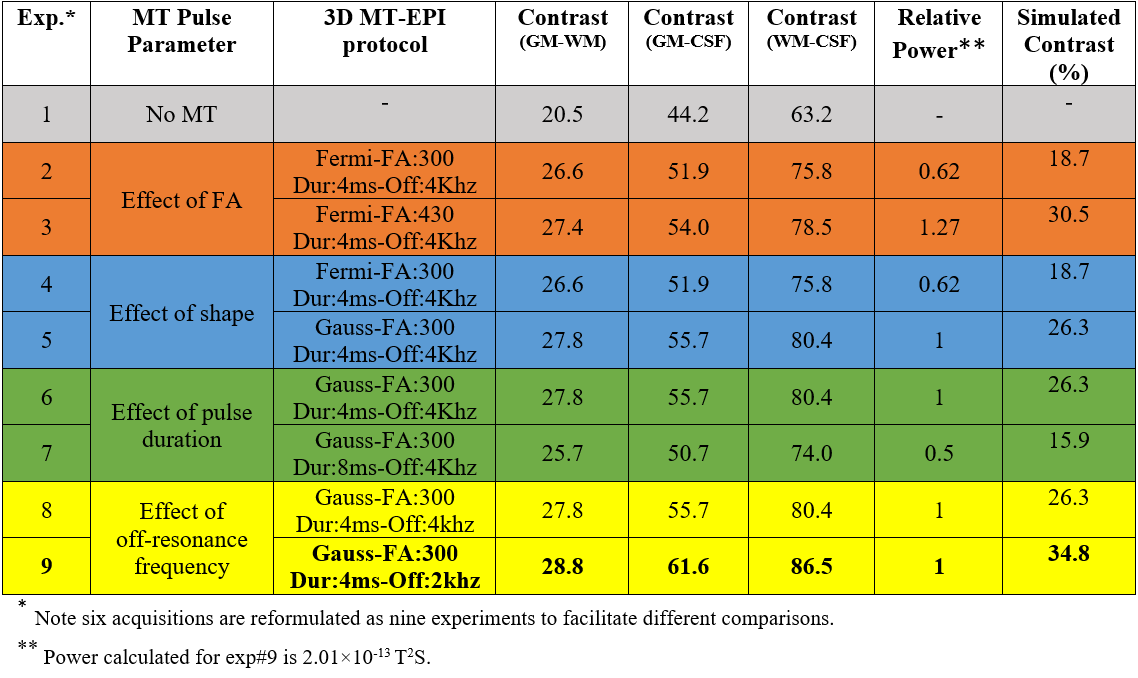
Pulse sequence: The MT module consisted of two components: an off-resonance pulse to selectively saturate the bound-pool and a spoiler gradient on the second PE direction to spoil any inadvertent on-resonance excitation (Fig.1a).Data acquisition: A healthy volunteer was scanned at 7T (Siemens-Terra) using an 8 transmit-channel and 32 receive-channel head coil (Nova-Medical). The MT-3DEPI was acquired with: TE/TR =16.2/100ms, FA=80, voxel-size=0.8mm-isotropic, GRAPPA=4, Partial-Fourier=0.75, in-plane segmentation=2, coverage=192×192×128mm3. Acquisition time was 224s for two volumes with reversed-PEs to facilitate distortion correction. An MP2RAGE was acquired as an anatomical reference. Data were acquired with and without the MT pre-pulse. To explore MT dynamics, two different pulse shapes (Gaussian and Fermi) and durations (4ms and 8ms) were investigated. Power was explored by varying FA (300o and 430o) and duration (4ms and 8ms) and data were acquired with two off-resonance frequencies (2kHz and 4kHz). A total of six different acquisitions were obtained (see Table1). The highest contrast acquisition was repeated in a second volunteer, along with a no pre-pulse reference and a transmit field (B1+) map based on the Bloch-Siegert effect5, to quantify contrast dependence on transmit field efficiency.
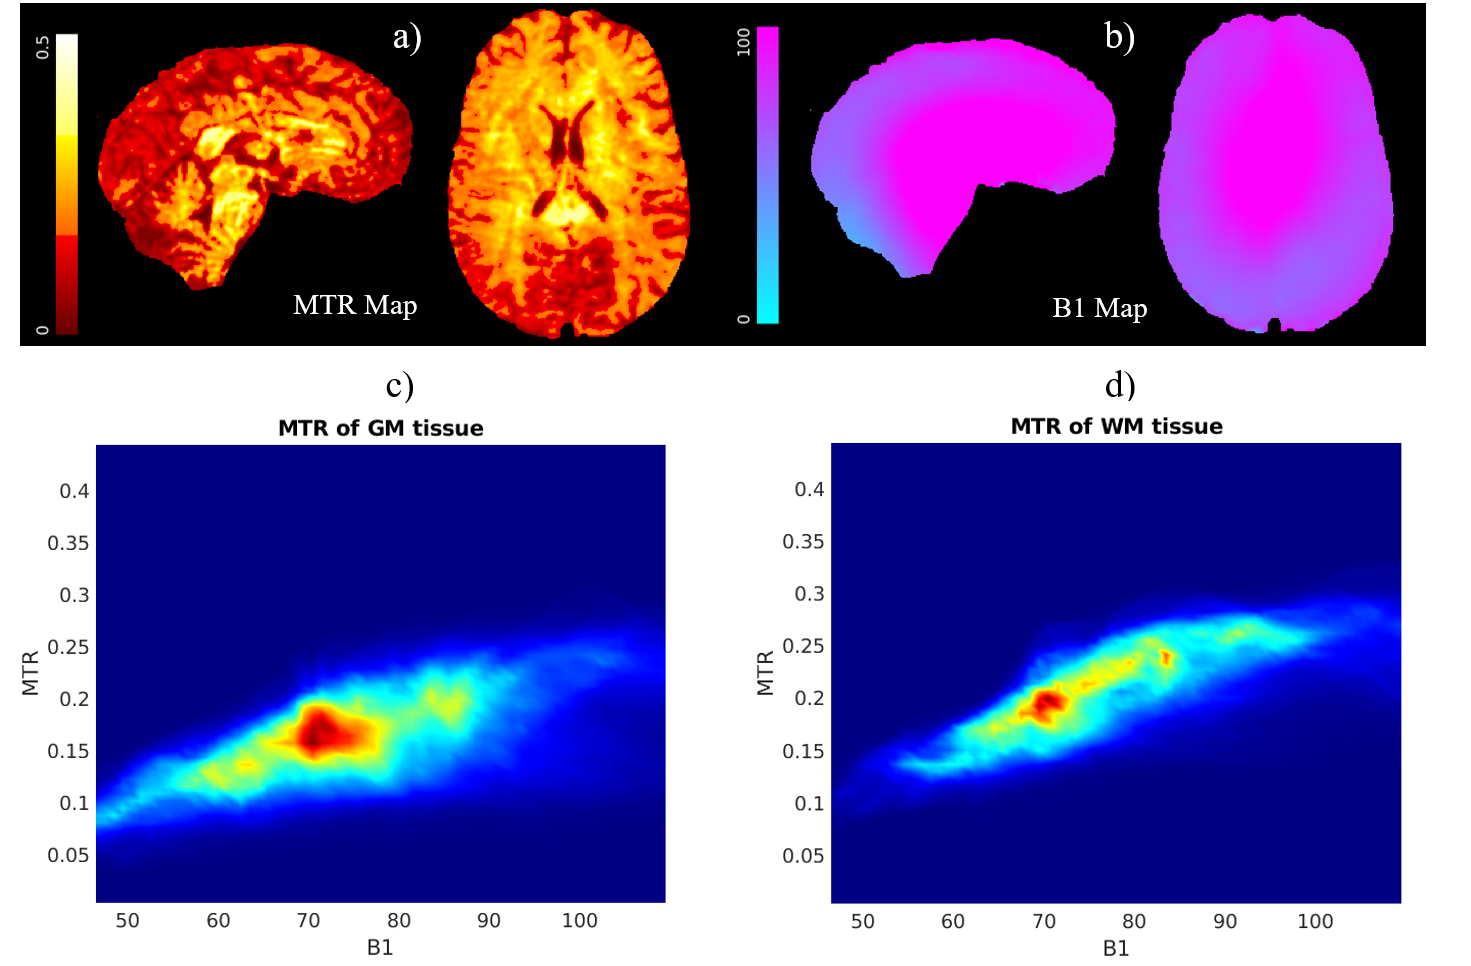
Analysis: Pre-processing was performed using FSL and SPM12. First, distortion correction was performed using topup6 followed by co-registration to the MP2RAGE. Tissue masks obtained by segmenting the MP2RAGE image were used to define a brain mask. Voxels with extreme signal dropout were excluded from the analysis. Tissue contrast was computed using Eq.1 to 3, together with power for each experimental condition7. Eq.4 was used to compute the contrast improvement (effectively the MT-ratio, MTR) from the second experiment and plotted against B1+ efficiency.
ContrastGM-WM=2*(SGM-SWM)/(SGM+SWM) [1]
ContrastGM-CSF=2*(SGM-SCSF)/(SGM+SCSF) [2]
ContrastGM-WM=2*(SWM-SCSF)/(SWM+SCSF) [3]
MTR=(Sno-MT-SMT)/Sno-MT [4]
Modelling: For each of the experiments, simulations were performed using the EPG-X framework8 to quantify the percent signal decrease expected in white-matter (WM) due to MT effects. Tissue parameters were as described in Corbin&Callaghan9, but neglected diffusion effects.
Results
Example images without (exp#1, Table1) and with (exp#9, Table1) an MT-prepulse are shown in Fig.1a together with signal profiles along a section passing through CSF, GM and WM (Fig.2b.) As expected, based on relative macromolecular content, the signal intensity change is substantial in WM but minimal in CSF.Tissue contrast and relative power are reported in Table1. Contrast generally increased linearly with pulse power with the exceptions that a) the Fermi pulse in exp#3 produced lesser contrast despite higher power and b) for matched power contrast was higher with lower off-resonance frequency (exp#8 vs. exp#9).
These findings were replicated by simulations (Table1, final column). Of particular note, exp#3 was predicted to have greater contrast per unit power in WM than exp#5 and the contrast was predicted to be largest for exp#9.
To assess the effect of contrast on GM segmentation, the MT (exp#9) and no-MT 3DEPI images were segmented and overlaid on the MP2RAGE image (Fig.3). Segmentation was improved by MT-induced contrast (yellow arrows in three exemplar regions). However, some segmentation failure remained (blue arrows). Fig.4 confirms that the contrast improvement (MTR) achieved varies spatially with the transmit field efficiency.
Discussion
In this study, the contrast improvement from employing MT-weighting with a standard pre-pulse module was investigated empirically and via simulation. Our parameter selections were motivated by the desire to maximise contrast while keeping within power (SAR) constraints. While power is a key determinant of contrast (Fig.4), it can also be affected by the dynamics of the magnetisation transfer between the bound and free pool. The good correspondence between simulation and experiment suggests that efficient optimisation of parameter space could be achieved numerically.Of the conditions tested empirically, the greatest contrast was achieved with a 4ms long Gaussian pulse with FA=300o and off-resonance frequency=2kHz. Although a lower off-resonance frequency bolstered contrast, this risks inadvertent on-resonance excitation if the spoiler gradient is insufficient. However, the Gaussian pulse had a comparatively sharp spectral response (Fig.1b) and no artefacts were visible in the images.
Our analysis confirmed that the contrast imparted by the MT pre-pulse is spatially variable and largely driven by transmit field inhomogeneity. This may be particularly problematic at 7T due to increased field inhomogeneity. A future direction would therefore be to develop more B1+-robust solutions that also meet SAR constraints.
MT-weighting improved contrast, segmentation and eased co-registration of EPI data to the more anatomically faithful MP2RAGE reference, all of which are key steps in cortical depth-resolved fMRI applications.
Acknowledgements
Acknowledgements: The Wellcome Centre for Human Neuroimaging is supported by core funding from the Wellcome [203147/Z/16/Z].References
1. Huber, L. et al. Techniques for blood volume fMRI with VASO: From low-resolution mapping towards sub-millimeter layer-dependent applications. Neuroimage 164, 131-143 (2018).
2. Poser, B. A., Koopmans, P. J., Witzel, T., Wald, L. L. & Barth, M. Three dimensional echo-planar imaging at 7 Tesla. Neuroimage 51, 261-266, doi:10.1016/j.neuroimage.2010.01.108 (2010).
3. Greve, D. N. & Fischl, B. Accurate and robust brain image alignment using boundary-based registration. Neuroimage 48, 63-72, doi:10.1016/j.neuroimage.2009.06.060 (2009).
4. Chai, Y. et al. Magnetization transfer weighted EPI facilitates cortical depth determination in native fMRI space. Neuroimage 242, 118455, doi:10.1016/j.neuroimage.2021.118455 (2021).
5. Corbin, N., Acosta‐Cabronero, J., Malik, S. J. & Callaghan, M. F. Robust 3D Bloch‐Siegert based mapping using multi‐echo general linear modeling. Magn Reson Med 82, 2003-2015 (2019).
6. Andersson, J. L. R., Skare, S. & Ashburner, J. How to correct susceptibility distortions in spin-echo echo-planar images: application to diffusion tensor imaging. Neuroimage 20, 870-888, doi:10.1016/S1053-8119(03)00336-7 (2003).
7. Bernstein, M. A., King, K. F. & Zhou, X. J. Handbook of MRI pulse sequences. (Elsevier, 2004).
8. Malik, S. J., Teixeira, R. P. A. & Hajnal, J. V. Extended phase graph formalism for systems with magnetization transfer and exchange. Magn Reson Med 80, 767-779 (2018).
9. Corbin, N. & Callaghan, M. F. Imperfect spoiling in
variable flip angle T1 mapping at 7T: Quantifying and minimizing impact. Magn Reson Med 86, 693-708 (2021).
Figures
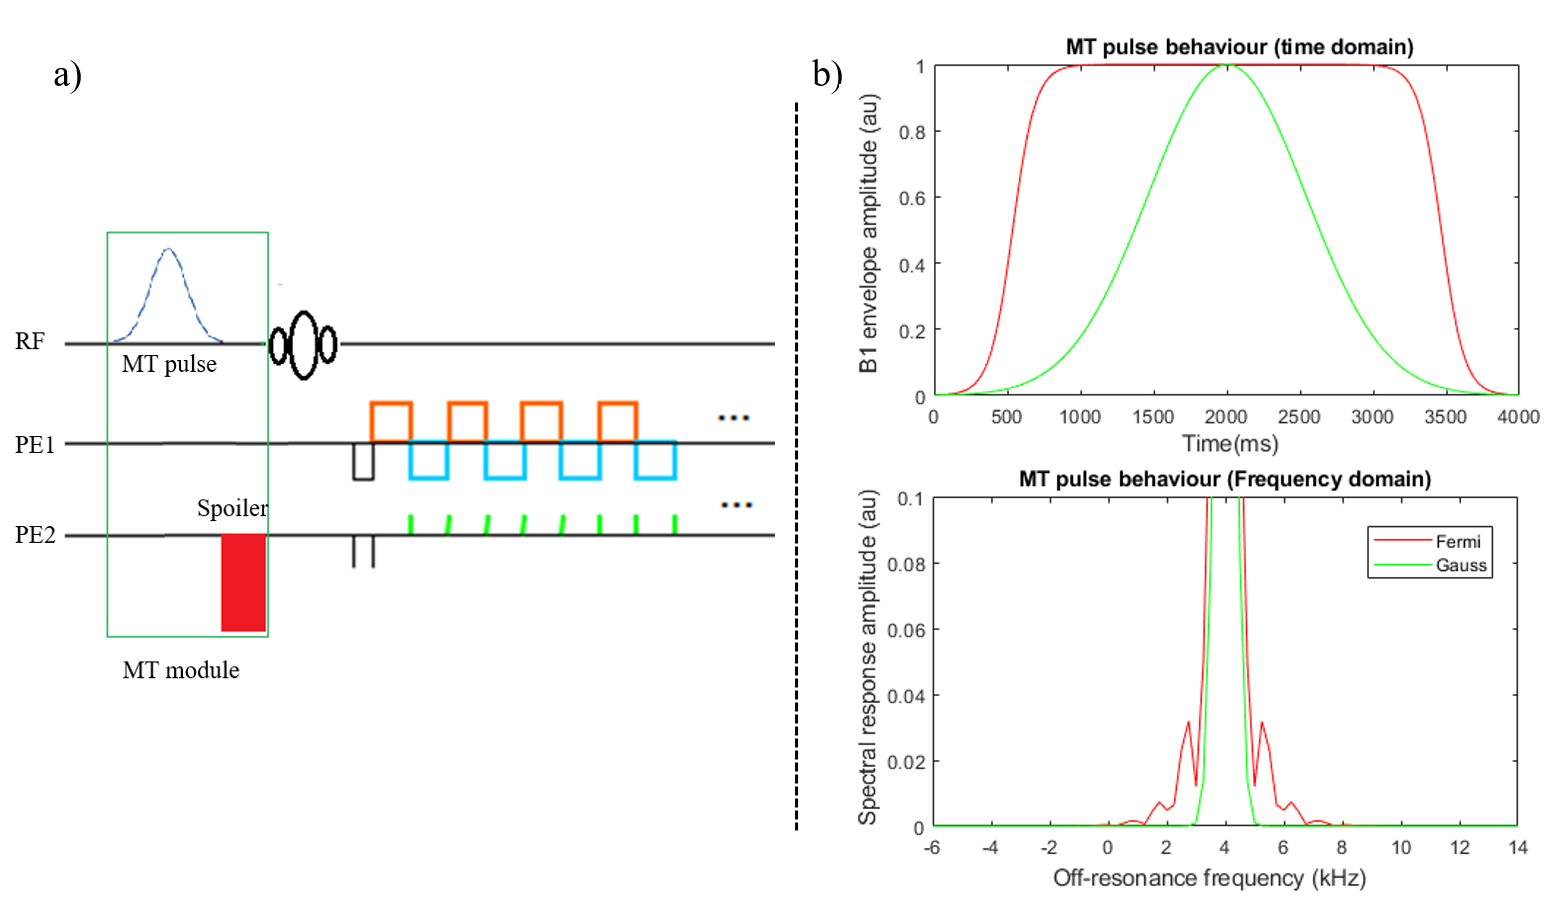
Figure 1. a) Schematic of the MT-3DEPI sequence for the whole brain data acquisition at 7T. b) Simulation of the MT pulse behaviour in both time and frequency domains for Gaussian and Fermi pulse shapes.
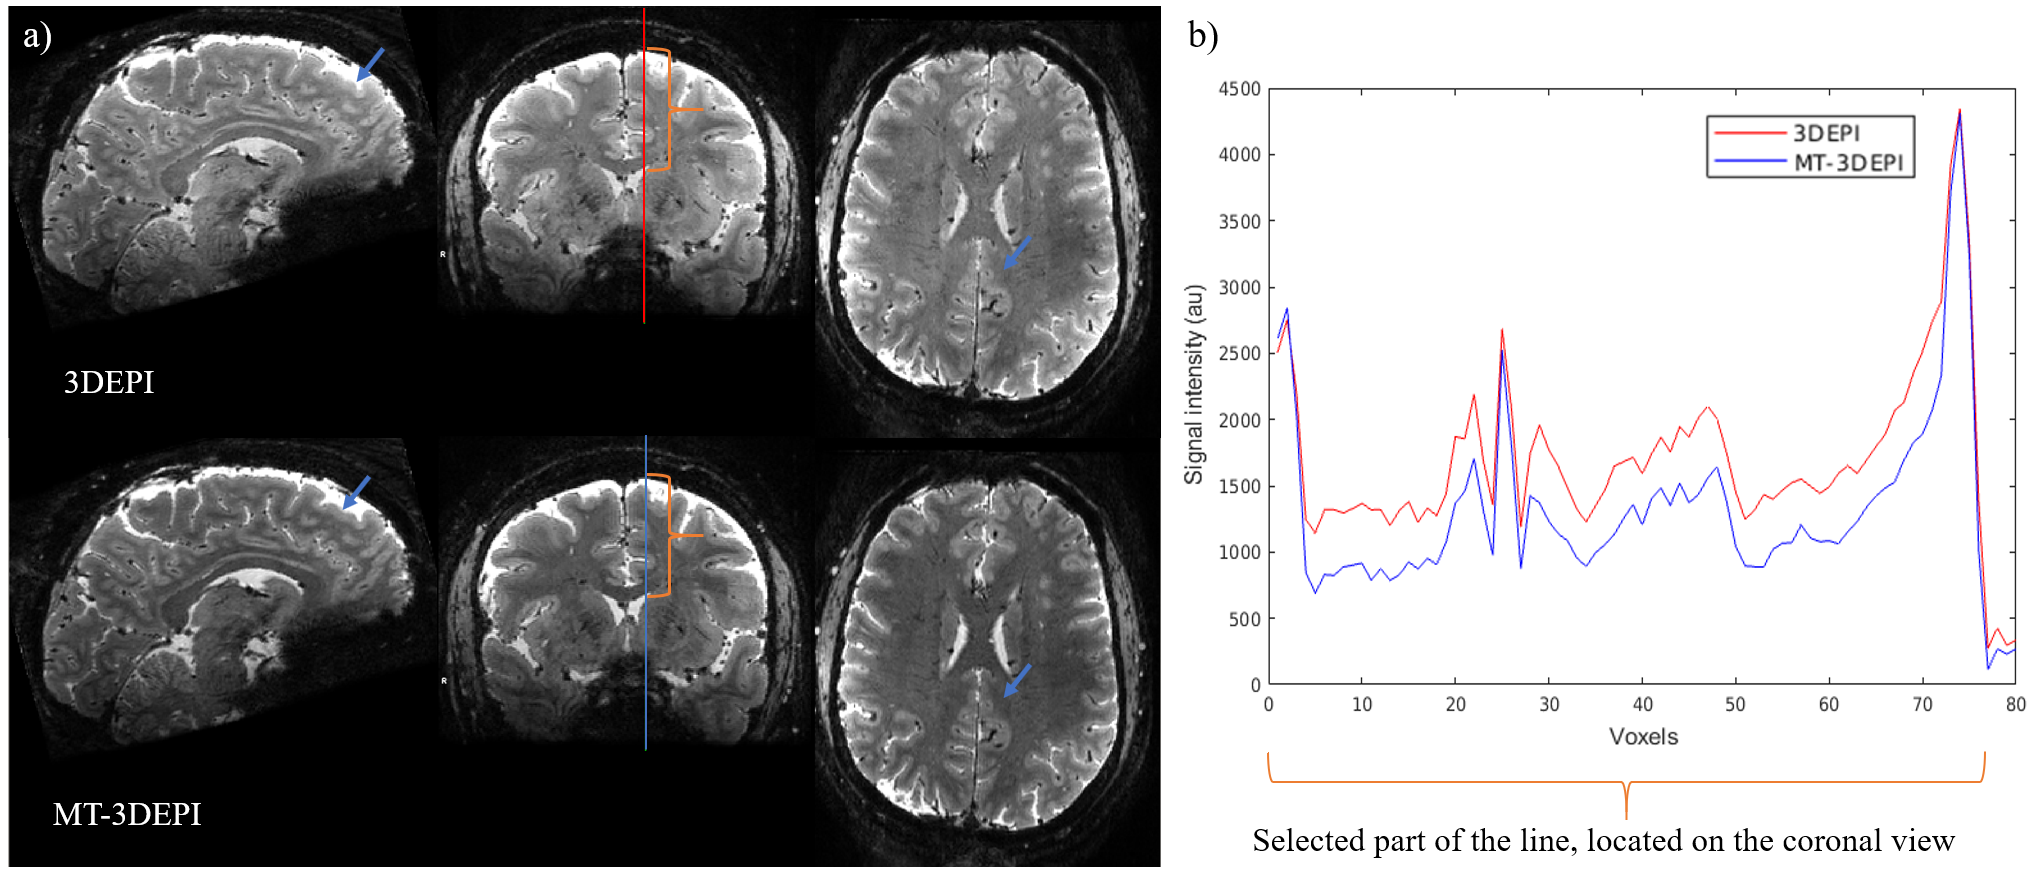
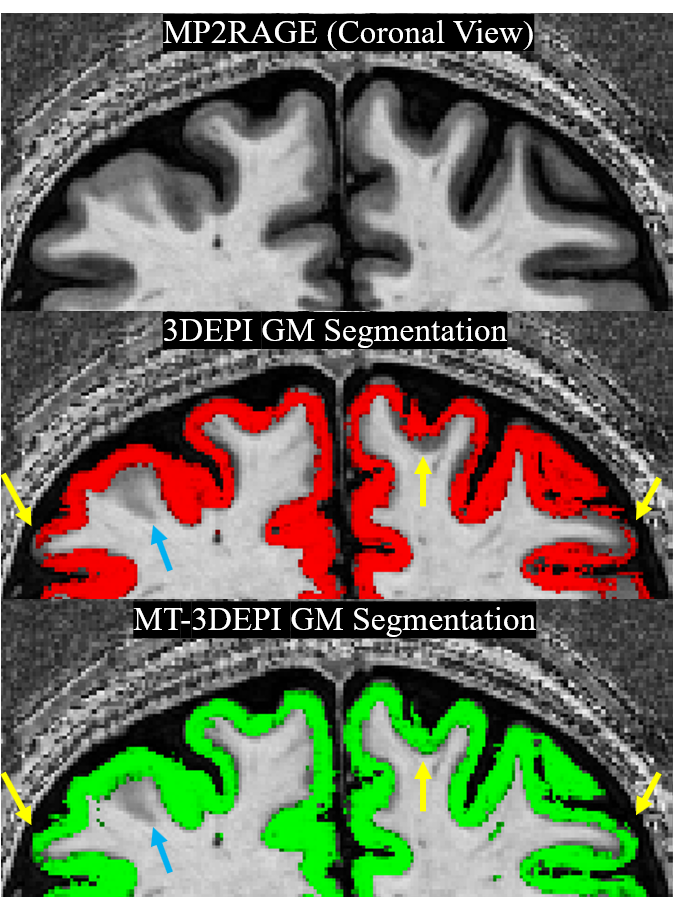
Figure 3. GM tissue segmentation of the 3DEPI and MT-3DEPI overlaid on the MP2RAGE “UNI” image. Segmentation on the MT-3DEPI outperformed the no-MT 3DEPI data as indicated by yellow arrows in three cortical regions. A blue arrow highlights an example of segmentation failure irrespective of MT weighting.