2446
BOLD PSF: Impact of k-space sampling on T2* contrast1Institute for Biomedical Engineering, ETH Zurich and University of Zurich, Zurich, Switzerland, 2Translational Neuromodeling Unit, Institute for Biomedical Engineering, University of Zurich and ETH Zurich, Zurich, Switzerland
Synopsis
The timing of BOLD-fMRI is typically chosen such that TE matches T2*. This assumes contrast being exclusively elicited by signal differences at TE. While sensible for short or TE-symmetric readouts, such as EPIs, it oversimplifies contrast generation for longer or TE-asymmetric trajectories, such as spirals.
We propose the concept of a BOLD PSF for a more comprehensive perspective on the imaging characteristics of a functional experiment. Our findings indicate that TE can be reduced for spiral-out without sacrificing BOLD-sensitivity when compared to EPI. Furthermore, we characterize the intrinsic trade-off between specificity and resolution of the BOLD response under varying TE.
Introduction
The timing of conventional BOLD fMRI experiments is chosen such that the k-space center (=TE) coincides with $$$T_2^*$$$. This is where the BOLD contrast curve as it manifests for grey matter (GM) at the respective field strength1-3 peaks under the assumption of a mono-exponential signal decay.Spirals exploit the gradient system more efficiently than EPI. However, the exclusive focus on TE for the choice of timing holds back spiral capabilities in BOLD fMRI. It induces an overly long dead time for spiral-out and a resolution-limited timing inflexibility for spiral-in trajectories.
The assumption of BOLD contrast being encoded in the center of k-space is a good approximation when the acquisition time is shorter than the timescale on which BOLD contrast changes significantly. Furthermore, it is a reasonable perspective if the k-space center is sampled in the center of the acquisition window, as it is the case for EPI. Yet, it does not fully capture the situation for extended readouts that sample the k-space center at any one time within the acquisition window. Like the image itself, BOLD contrast and its spatial representation are determined by contributions from all of k-space.
In the present work, the impact of this trajectory-dependent mixture on different characteristics of the BOLD contrast is investigated by introducing the concept of a ‘BOLD point spread function (PSF)’, which is the Fourier transform (FT) of BOLD weighting across k-space. Characterizing only the imaging process, it is different from other notions of the PSF in BOLD imaging that describe the translation of neuronal activation to oxygenation change of hemoglobin4–8 and also from the PSF of gradient echo (GE) imaging per se9,10.
Methods
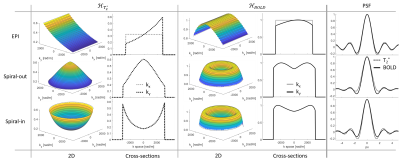
In MR Fourier encoding, the PSF is the inverse FT of the k-space filter11\begin{equation}PSF(\boldsymbol{x})=\mathcal{F}^{-1}(H(\boldsymbol{k}))\end{equation}with $$$\boldsymbol{k}=[k_x k_y k_z]^T$$$. The k-space filter $$$H(\boldsymbol{k})$$$ comprises the sampling of k-space at discrete points and on a finite support, as well as any signal weighting that is superimposed.\begin{equation}H(k)=H_{sampling}(\boldsymbol{k})\cdot H_{weight}(\boldsymbol{k})\end{equation}In GE experiments, assuming a mono-exponential decay12, the weighting reads$$H_{weight}(\boldsymbol{k})=H_{T_2^*}(\boldsymbol{k})=e^{-\frac{t(\boldsymbol{k})}{T_2^*}}$$
In a BOLD experiment, the interesting output is not the images themselves but their differences, originating in temporal changes. Therefore, BOLD imaging is characterized by a differential PSF (Fig.1).\begin{equation}\label{eq2}\begin{split}PSF_{BOLD}(\boldsymbol{x},T_2^*,ΔT_2^*)&=PSF_{GE}(\boldsymbol{x},T_2^*+ΔT_2^*)-PSF_{GE}(\boldsymbol{x},T_2^*)\\&=\frac{∂PSF_{GE}(\boldsymbol{x},T_2^* )}{∂T_2^*}ΔT_2^*\end{split}\end{equation}Since FT is a linear operation, we may interchange it with the derivative and as the sampling filter does not depend on $$$T_2^*$$$, only the weighting function must be adapted:\begin{equation}H_{weight}^{BOLD}(\boldsymbol{k})=\frac{∂H_{T_2^*}(\boldsymbol{k})}{∂T_2^*}=\frac{t(\boldsymbol{k})}{{T_2^*}^2}e^{-\frac{t(\boldsymbol{k})}{T_2^*}}\end{equation}The full BOLD PSF then reads\begin{equation}PSF_{BOLD}(\boldsymbol{x},T_2^*,ΔT_2^*)=\mathcal{F}^{-1}(H_{sampling}(\boldsymbol{k})\frac{t(\boldsymbol{k})}{{T_2^*}^2}e^{-\frac{t(\boldsymbol{k})}{T_2^*}})ΔT_2^*\end{equation}Like the GE imaging PSF, the BOLD PSF is not shift-invariant due to its spatially variable dependence on $$$T_2^*$$$. However, it may be assumed that in a BOLD experiment at a given field strength, the interesting signal changes stem from regions with similar $$$T_2^*$$$.
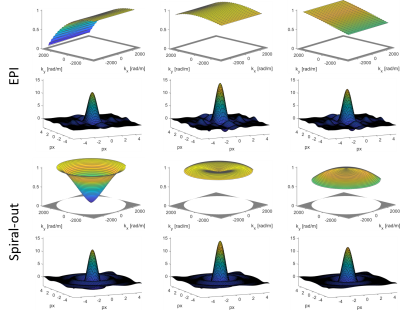
We computed the BOLD PSF (Fig.2) for EPI and spirals (1mm and 2mm resolution). In each case, the covered k-space area and the readout duration (36ms and 11ms respectively) were matched such that the EPI had a slightly higher undersampling factor. $$$t(\boldsymbol{k})$$$ was gridded onto a rectangular grid using a sufficiently wide kernel to make up for the undersampling. The real part of the resulting PSF7 was assessed through three different measures:
- Resolution: FWHM of the main lobe, as the diameter of a disk with area equal to the half height area of the main lobe.
- Sensitivity: integral over the main lobe inside an isoline of 20 % of its peak value.
- Specificity: relative side lobe suppression as the relation between the integral over the main lobe and the L2-Norm of the side lobes.
Results
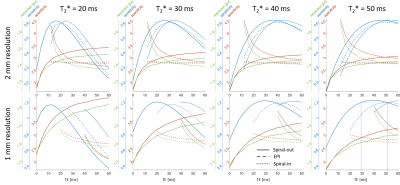
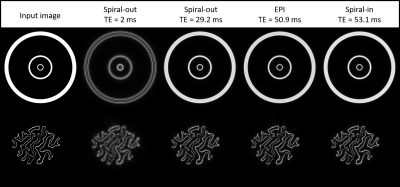
Spirals have a higher BOLD sensitivity peak than EPI (Fig.3). The optimum BOLD sensitivity is reached at earlier TEs for spiral-out than for EPI and at later TEs for spiral-in. This effect is more pronounced for the longer 1mm readouts. Higher resolution always goes along with reduced specificity and vice versa. The curves for EPI are, in general, flatter.Optimization example 1mm resolution @$$$T_2^*$$$=50ms (typical for GM at 3T14,15): Max. BOLD sensitivity for EPI at TE=50.9ms, for Spiral-out at TE=39.1ms, resulting in 6.2ms longer slice-TR for spiral-out. Levelling sensitivity: Spiral-out TE=29.2ms, resulting in 3.7ms shorter slice-TR for spiral-out than for EPI.
Fig. 4 illustrates effects of the BOLD PSF on exemplary artificial activation patterns.
Discussion
The BOLD PSF results suggest that the timing chosen in a BOLD experiment should depend not only on the field strength but also on the sampling strategy, the length of the readout train, and, ultimately, the target application. The basis of this lies in viewing the BOLD contrast curve less as a guide to optimize TE, but rather as a BOLD image filter corresponding to a BOLD PSF.Our model assumes a mono-exponential signal decay, which does not describe the relaxation process in brain tissue entirely accurately16,17. Furthermore, we only considered gradient echo formation. However, the theory should be equally applicable to spin echo sequences with an accordingly modified signal filter.
Acknowledgements
The authors would like to gratefully acknowledge helpful discussions with Jakob Heinzle and Samuel Bianchi.References
1. Lipschutz B, Friston KJ, Ashburner J, Turner R, Price CJ. Assessing Study-Specific Regional Variations in fMRI Signal. NeuroImage 2001;13:392–398 doi: 10.1006/nimg.2000.0687.
2. Deichmann R, Josephs O, Hutton C, Corfield DR, Turner R. Compensation of Susceptibility-Induced BOLD Sensitivity Losses in Echo-Planar fMRI Imaging. NeuroImage 2002;15:120–135 doi: 10.1006/nimg.2001.0985.
3. Fera F, Yongbi MN, Gelderen P van, Frank JA, Mattay VS, Duyn JH. EPI-BOLD fMRI of human motor cortex at 1.5 T and 3.0 T: Sensitivity dependence on echo time and acquisition bandwidth. Journal of Magnetic Resonance Imaging 2004;19:19–26 doi: 10.1002/jmri.10440.
4. Shmuel A, Yacoub E, Chaimow D, Logothetis NK, Ugurbil K. Spatio-temporal point-spread function of fMRI signal in human gray matter at 7 Tesla. NeuroImage 2007;35:539–552 doi: 10.1016/j.neuroimage.2006.12.030.
5. Engel SA, Glover GH, Wandell BA. Retinotopic organization in human visual cortex and the spatial precision of functional MRI. Cereb Cortex 1997;7:181–192 doi: 10.1093/cercor/7.2.181.
6. Cheng K. What We Have Learned about Human Primary Visual Cortex from High Resolution Functional Magnetic Resonance Imaging. MRMS 2016;15:1–10 doi: 10.2463/mrms.2015-0008.
7. Chaimow D, Yacoub E, Uğurbil K, Shmuel A. Spatial specificity of the functional MRI blood oxygenation response relative to neuronal activity. NeuroImage 2018;164:32–47 doi: 10.1016/j.neuroimage.2017.08.077.
8. Parkes LM, Schwarzbach JV, Bouts AA, et al. Quantifying the spatial resolution of the gradient echo and spin echo BOLD response at 3 Tesla. Magnetic Resonance in Medicine 2005;54:1465–1472 doi: 10.1002/mrm.20712.
9. Chaimow D, Shmuel A. A more accurate account of the effect of k-space sampling and signal decay on the effective spatial resolution in functional MRI. bioRxiv 2016:097154 doi: 10.1101/097154.
10. Qin Q. Point Spread Functions of the T2 Decay in k-Space Trajectories with Long Echo Train. Magn Reson Imaging 2012;30:1134–1142 doi: 10.1016/j.mri.2012.04.017.
11. Haacke EM, Brown RW, Thompson MR, Venkatesan R. Filtering and Resolution in Fourier Transform Image Reconstruction. In: Magnetic Resonance Imaging. John Wiley & Sons, Ltd; 2014. pp. 261–296. doi: 10.1002/9781118633953.ch13.
12. Haacke EM, Brown RW, Thompson MR, Venkatesan R. Introductory Signal Acquisition Methods. In: Magnetic Resonance Imaging. John Wiley & Sons, Ltd; 2014. pp. 113–139. doi: 10.1002/9781118633953.ch8.
13. Huber L, Finn ES, Handwerker DA, et al. Sub-millimeter fMRI reveals multiple topographical digit representations that form action maps in human motor cortex. NeuroImage 2020;208:116463 doi: 10.1016/j.neuroimage.2019.116463.
14. Wansapura JP, Holland SK, Dunn RS, Ball WS. NMR relaxation times in the human brain at 3.0 tesla. Journal of Magnetic Resonance Imaging 1999;9:531–538 doi: 10.1002/(SICI)1522-2586(199904)9:4<531::AID-JMRI4>3.0.CO;2-L.
15. Krüger G, Glover GH. Physiological noise in oxygenation-sensitive magnetic resonance imaging. Magnetic Resonance in Medicine 2001;46:631–637 doi: 10.1002/mrm.1240.
16. Fullerton GD, Potter JL, Dornbluth NC. NMR relaxation of protons in tissues and other macromolecular water solutions. Magnetic Resonance Imaging 1982;1:209–226 doi: 10.1016/0730-725X(82)90172-2.
17. van Gelderen P, de Zwart JA, Lee J, Sati P, Reich DS, Duyn JH. Non-exponential T2* decay in White Matter. Magn Reson Med 2012;67:110–117 doi: 10.1002/mrm.22990.
Figures


