2433
Accelerated Quantitative 3D UTE-Cones Imaging using Compressed Sensing1Radiology, University of California San Diego, San Diego, CA, United States, 2Radiology Service, VA San Diego Healthcare System, San Diego, CA, United States
Synopsis
Quantitative ultrashort echo time (qUTE) imaging suffers from long acquisition time due to multiple acquisitions required for parameter estimation. In this study, feasibility of accelerated qUTE Cones imaging with compressed sensing (CS) reconstruction is investigated for fast variable flip angle UTE-T1 mapping, adiabatic UTE-T1ρ mapping, and UTE quantitative magnetization transfer (MT) modelling of macromolecular fraction (MMF). We explored these biomarkers for qUTE-Cones imaging of in vivo human knee joints at various undersampling rates. The performance of CS-reconstruction and parameter mapping was evaluated in tendons, ligaments, menisci, and cartilage.
Introduction
The ultrashort echo time (UTE) sequences allow direct imaging of short-T2 components due to the use of significantly shortened echo times1. Recently, quantitative UTE (qUTE) imaging techniques such as UTE-T12, UTE-adiabatic-T1ρ (UTE-Adiab-T1ρ)3 and UTE quantitative magnetization transfer4 (UTE-qMT) modelling have surfaced as new biomarkers to characterize short-T2 musculoskeletal (MSK) tissues such as the deep cartilage, menisci, ligaments, tendons and bone which show little or no signal with conventional MRI sequences.3D UTE-T1 mapping based on a variable flip angle (VFA) approach has been demonstrated to reliably quantify T1 relaxation times of both short-T2 and long-T2 knee joint tissues2. UTE-Adiab-T1ρ allows magic angle-insensitive evaluation of T1ρ relaxation times of various knee joint tissues5. Moreover, UTE-qMT modelling allows magic angle-insensitive assessment of macromolecular fraction (MMF) for all the principal knee joint tissues6. Unfortunately, qUTE imaging typically requires multiple acquisitions with a long acquisition time, which is a major challenge in translating these techniques into clinical use.
Compressed sensing (CS) exploits sparsity in MR image space. Wavelet-based CS with parallel imaging (PI) has proven to be successful in MRI reconstruction7. While many studies have focused primarily on Cartesian imaging 8,9, this work deals with non-Cartesian 3D spiral cones imaging. In this study, feasibility of wavelet-CS reconstruction combined with PI was investigated, aiming quantitative parameter mapping of T1, adiab-T1ρ, and MMF for 3D qUTE-Cones knee imaging.
Methods
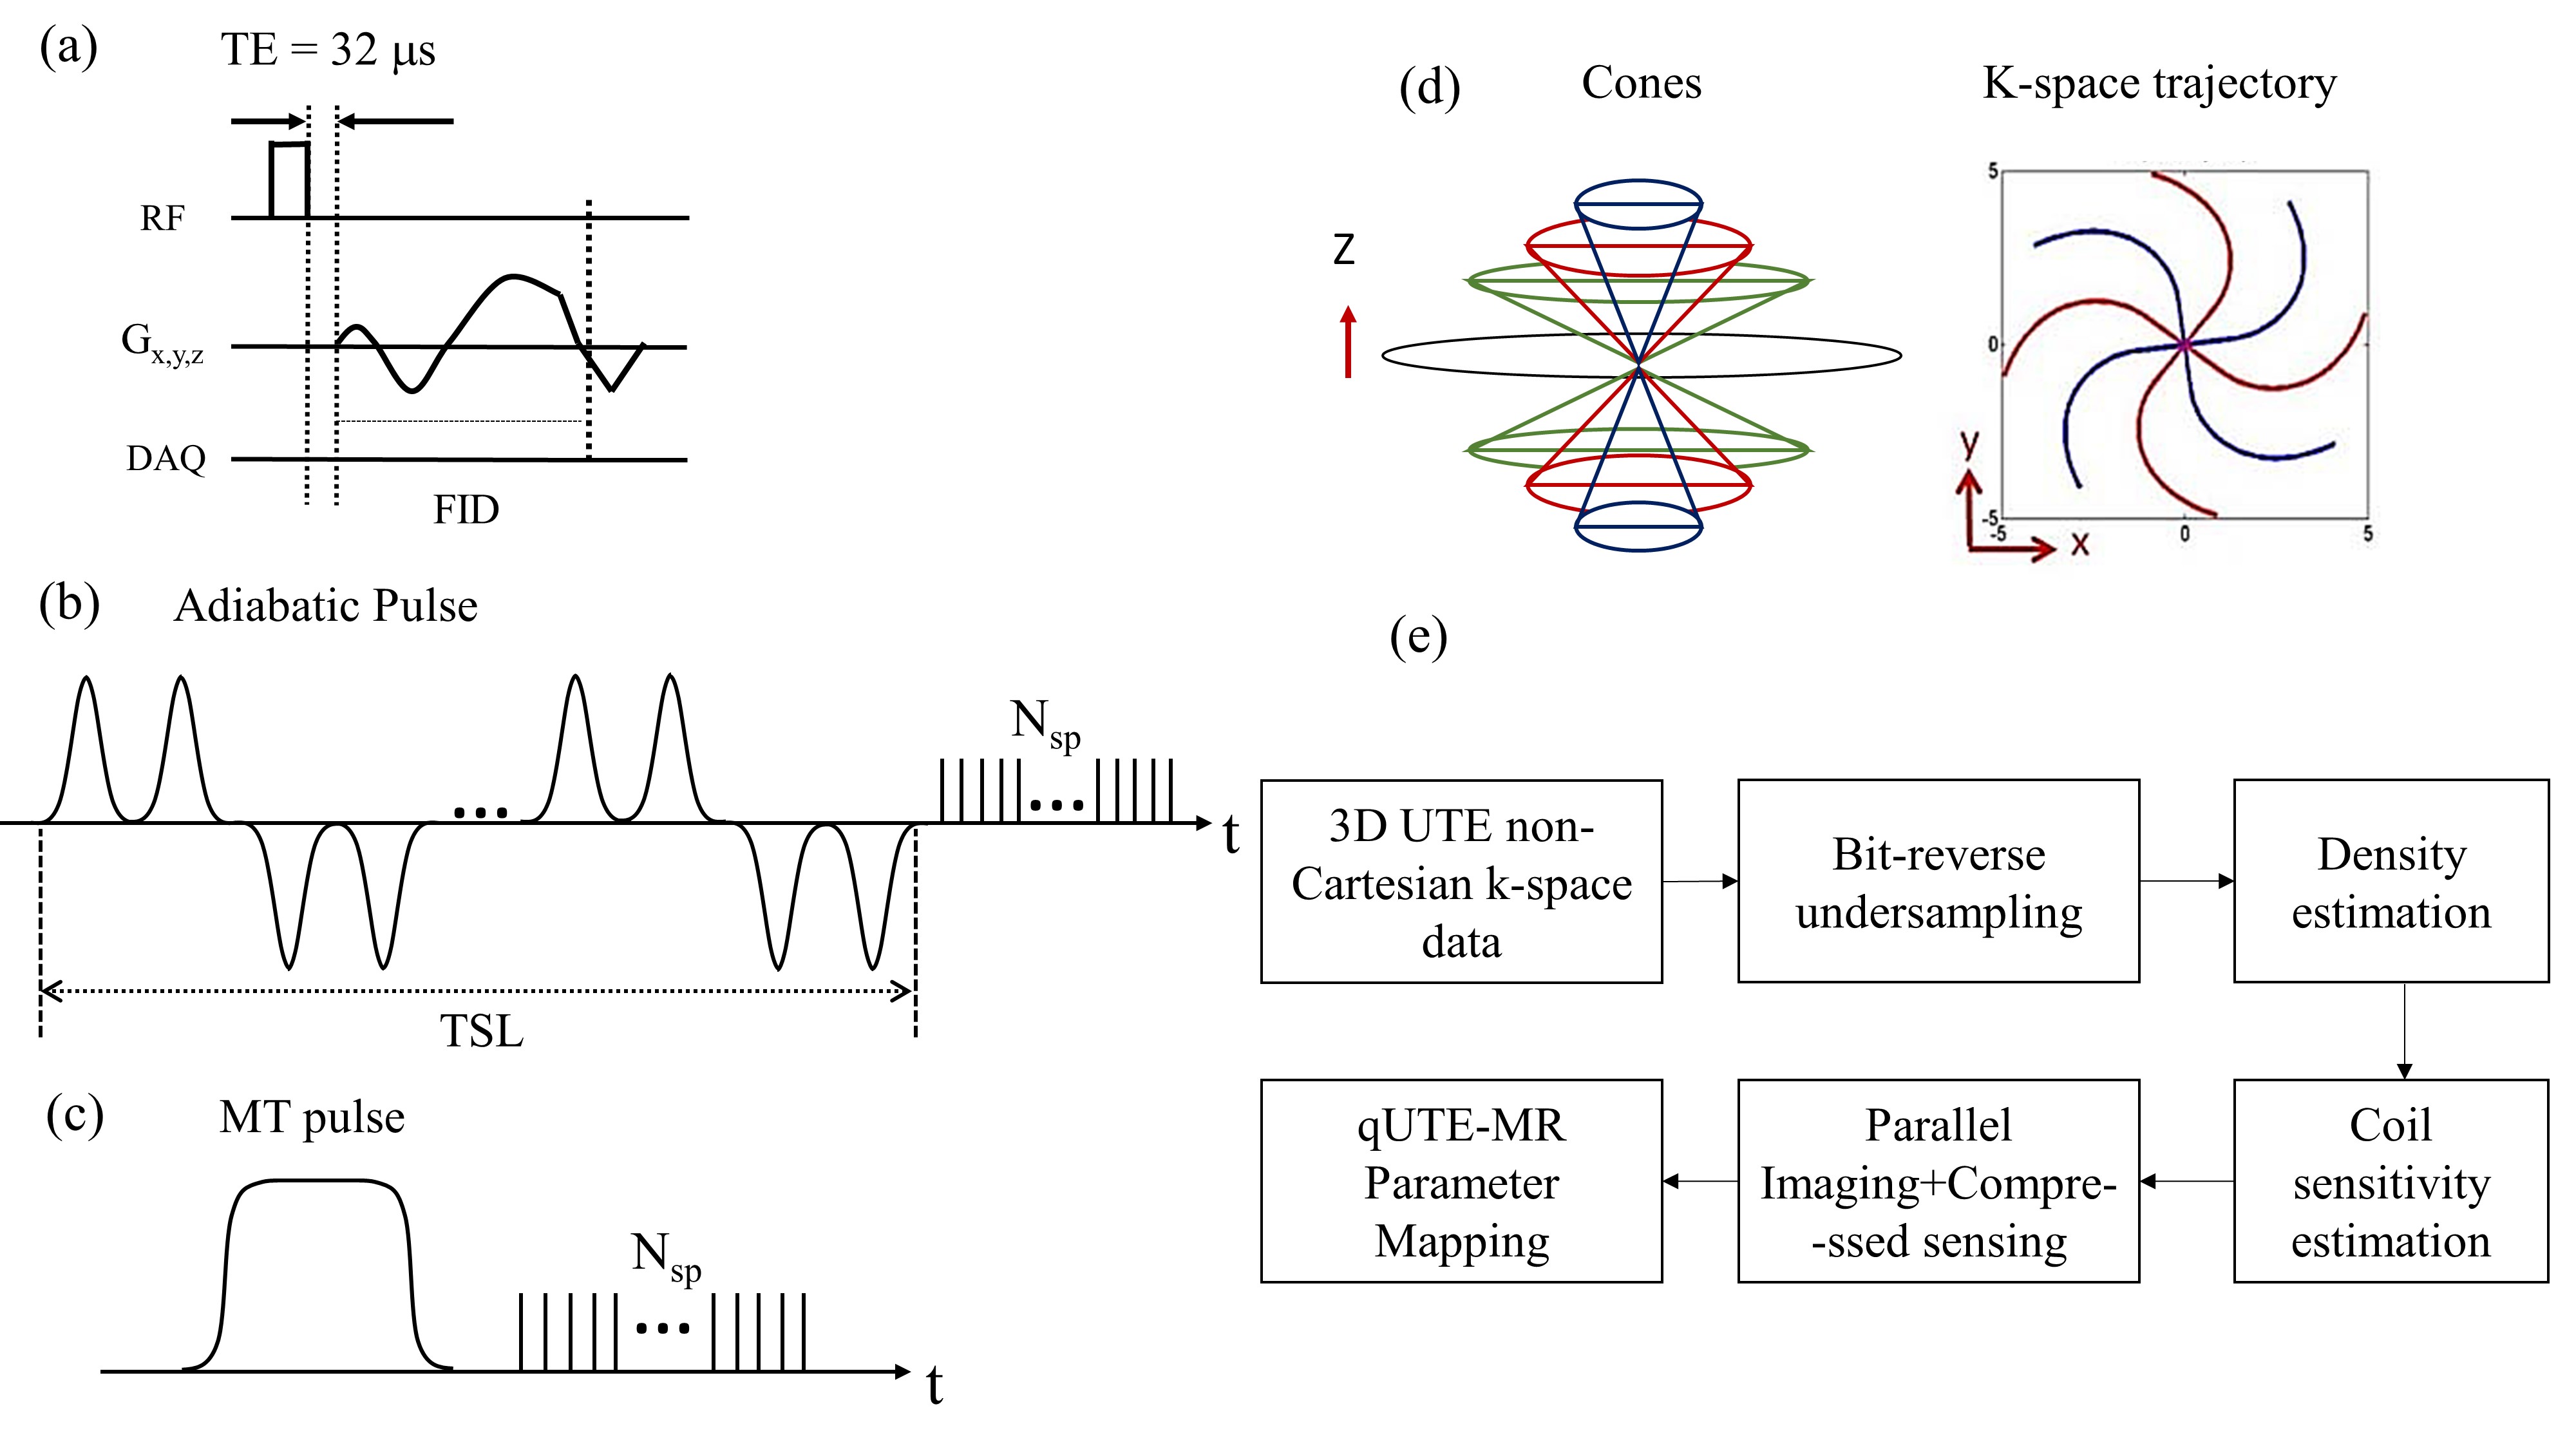
In this study, 15 healthy volunteers were recruited following guidelines issued by our Institutional Review Board for knee MRI on a 3T GE-MR750 scanner. An 8-channel knee coil was used for RF transmission and signal reception. The 3D UTE-Cones sequence was used to acquire k-space data for each knee joint with full-sampling using the following imaging parameters: field of view (FOV)=15×15×10.8 cm3, matrix=256x256x32, receiver bandwidth =166 kHz; 1) VFA-UTE-T1: TR=20 ms, flip angle (FA)=5°, 15°, 30°, scan time=6min 8sec; 2) UTE-Adiab-T1ρ: FA=10°, number-of-spokes per preparation (Nsp)=25, TR=500ms, spin-locking time (TSL)=0, 24, 48, 96ms, scan time=8min 54sec; 3) UTE-qMT: MT power=1500°, 500°, MT frequency offsets=2, 5, 10, 20, 50kHz, scan time=9min 38sec. Figure 1(a) shows the 3D UTE-Cones sequence used for imaging. Figures 1(b) and 1(c) show pulse sequences used for UTE-Adiab-T1ρ and UTE-qMT imaging. Figure 1(d) shows cones trajectory.The k-space data were retrospectively undersampled at three different levels (i.e., 25%, 50% and 61%) using a pseudo-random, bit reversal ordering scheme. This was followed by iterative density compensation10 which is crucial due to non-Cartesian nature of cones trajectory that does not possess uniform distribution of data points. Coil sensitivity was estimated using the complex image reconstructed with zero-filling in each channel using non-uniform FFT11. CS reconstruction with penalties based on l1 norm was posed as :
$$\left | PFSx-y \right |_{2}^{2}+\lambda \left | \phi x \right |_{1}$$
Where: $$$F$$$ - Fourier transform; $$$P$$$ - Sampling operator; $$$S$$$ - Coil sensitivity; $$$x$$$ - Image to be reconstructed; $$$y$$$ – k-space data; $$$\lambda$$$ – Regularization parameter; $$$\phi$$$ – Wavelet transform operator.
BART12 toolbox was used to perform Wavelet-CS reconstruction .The regularization parameters, $$$\lambda$$$, was optimized empirically to suit the current application and remained constant for all subjects. The reconstructed images were input to the subsequent quantification process. Figure 1(e) shows a complete block diagram representation for the entire flow.
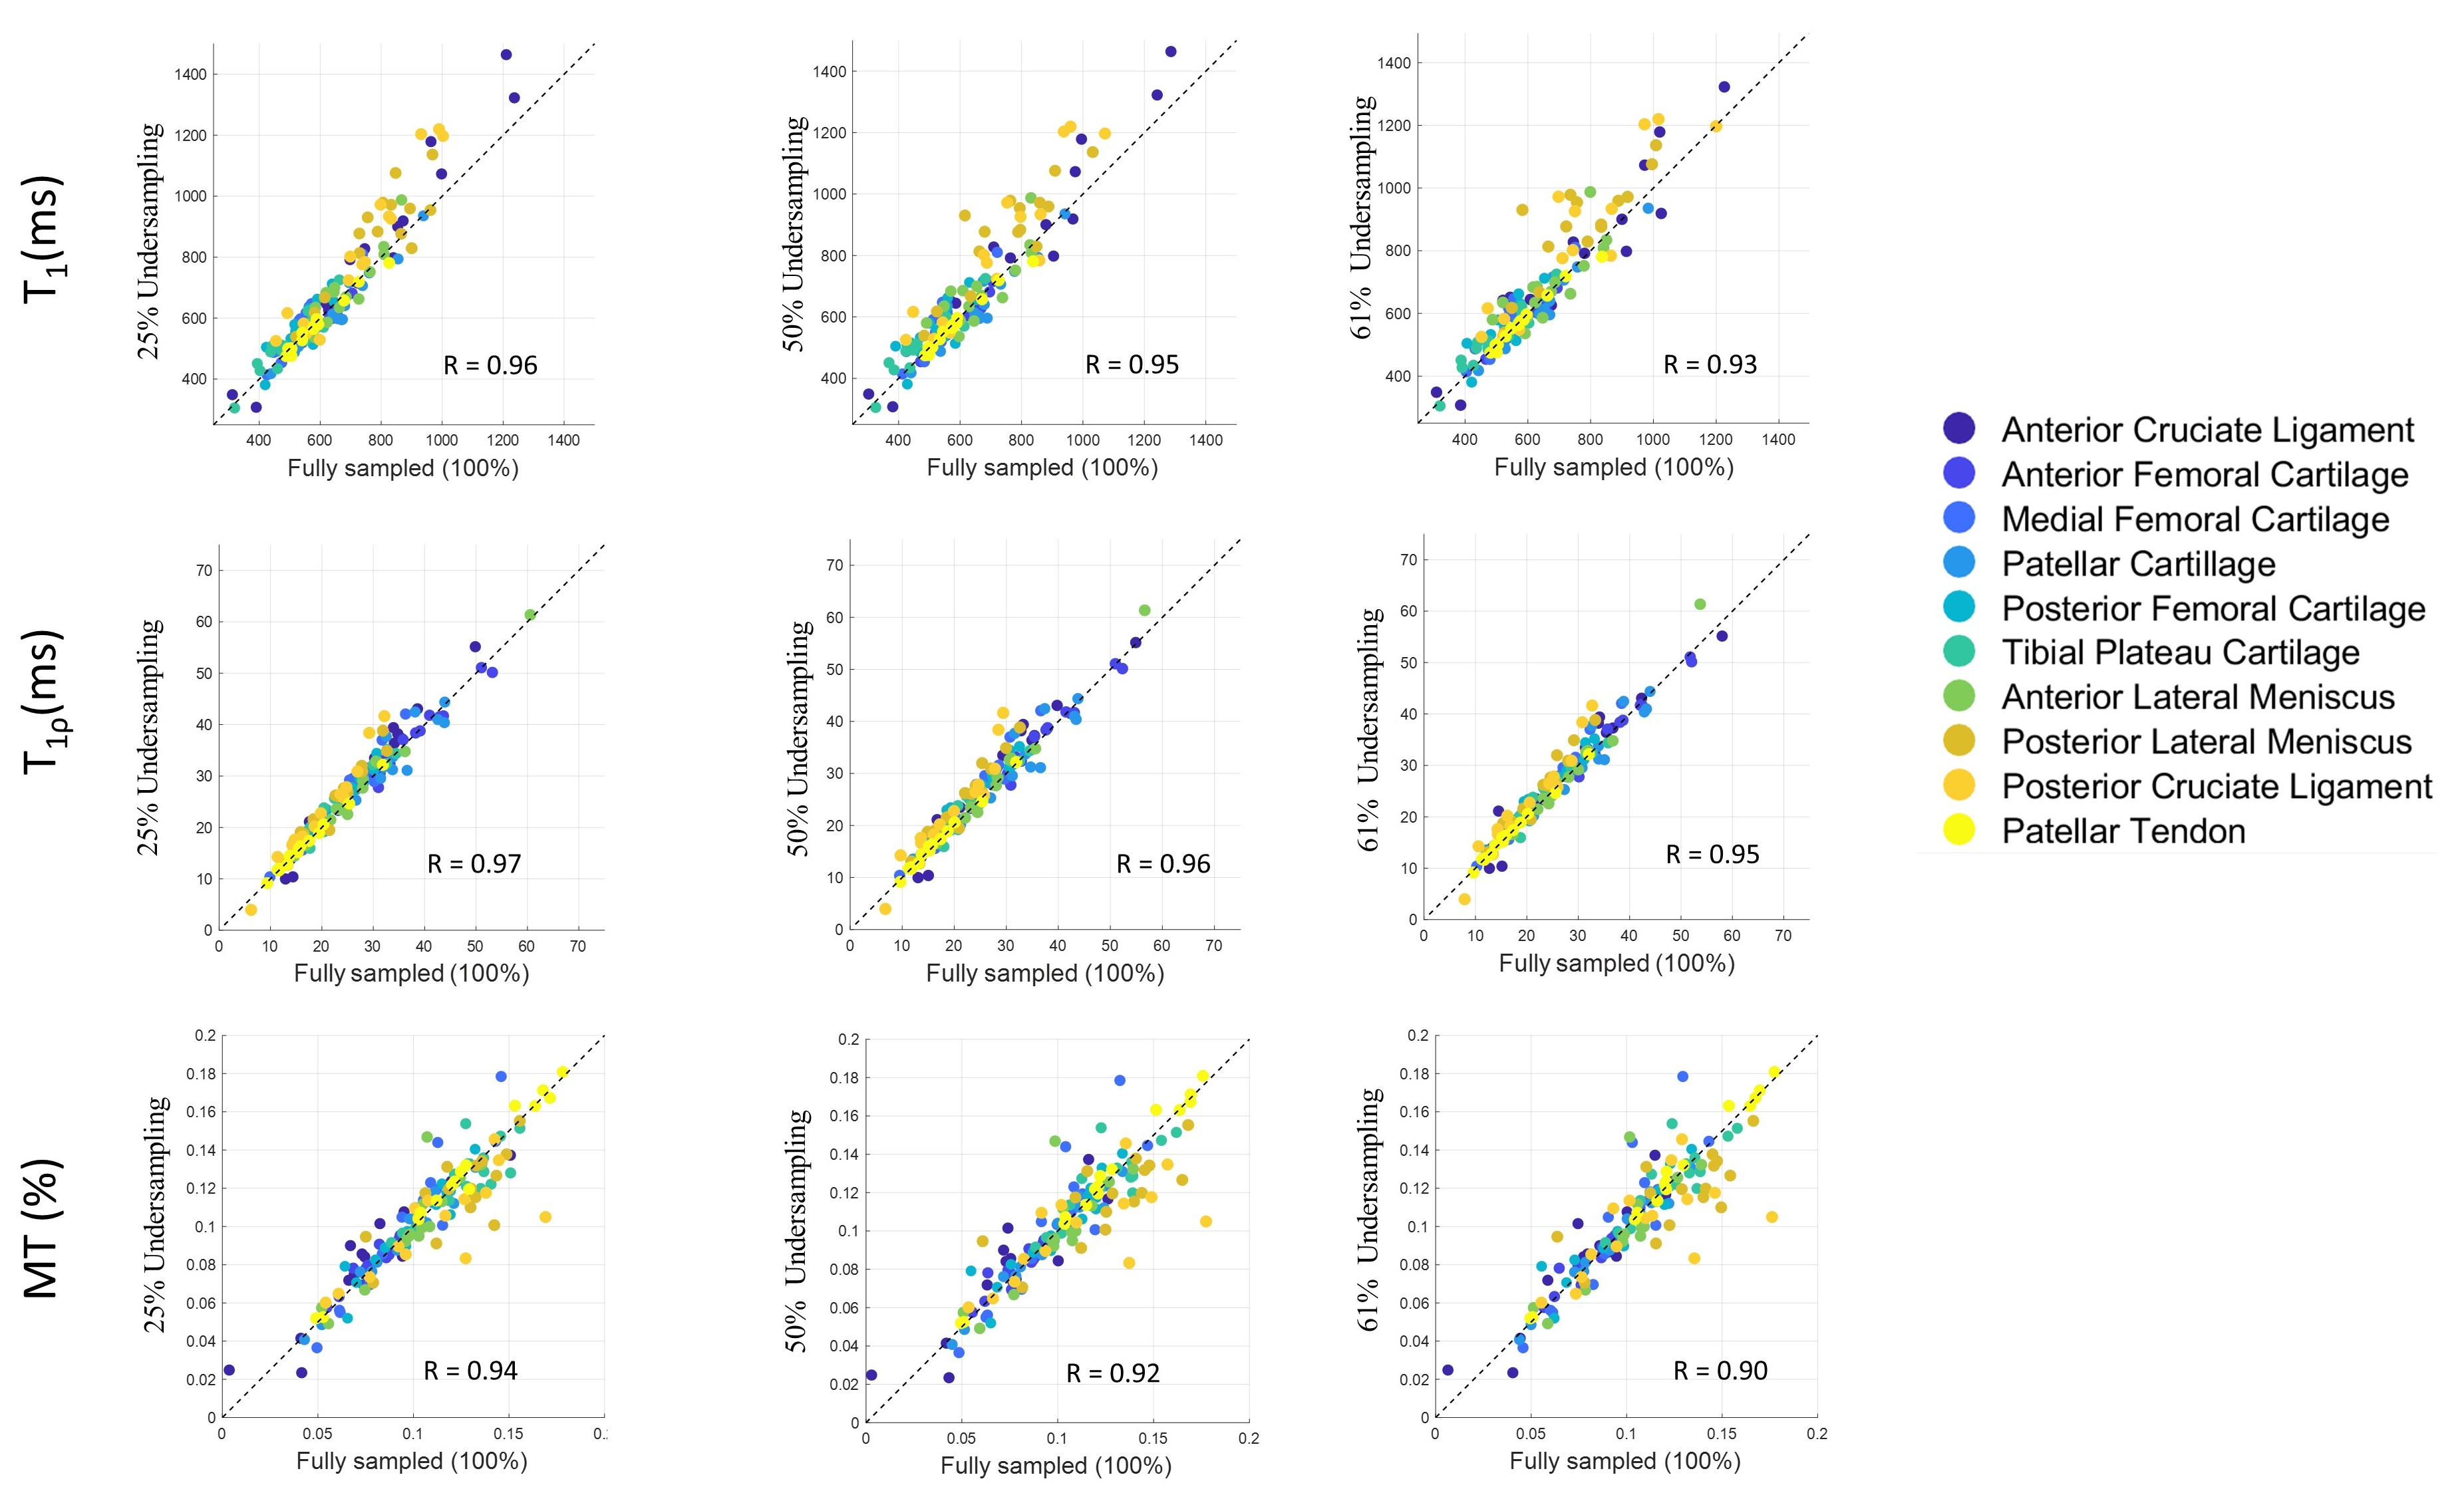
Data analysis was performed using MATLAB. Ten different regions of interest (ROIs) (i.e., anterior cruciate ligament (ACL), anterior femoral cartilage (AFC), medial femoral cartilage (MFC), patellar cartilage, posterior femoral cartilage (PFC), tibial plateau cartilage (TPC), anterior meniscus, posterior meniscus, posterior cruciate ligament (PCL), and patellar tendon) were drawn in the in vivo knee samples from 15 subjects, and mean and standard deviation were calculated. Pearson’s correlations were calculated between parameters with fully-sampled and undersampled data using mean parameter values in all ROIs.
Results
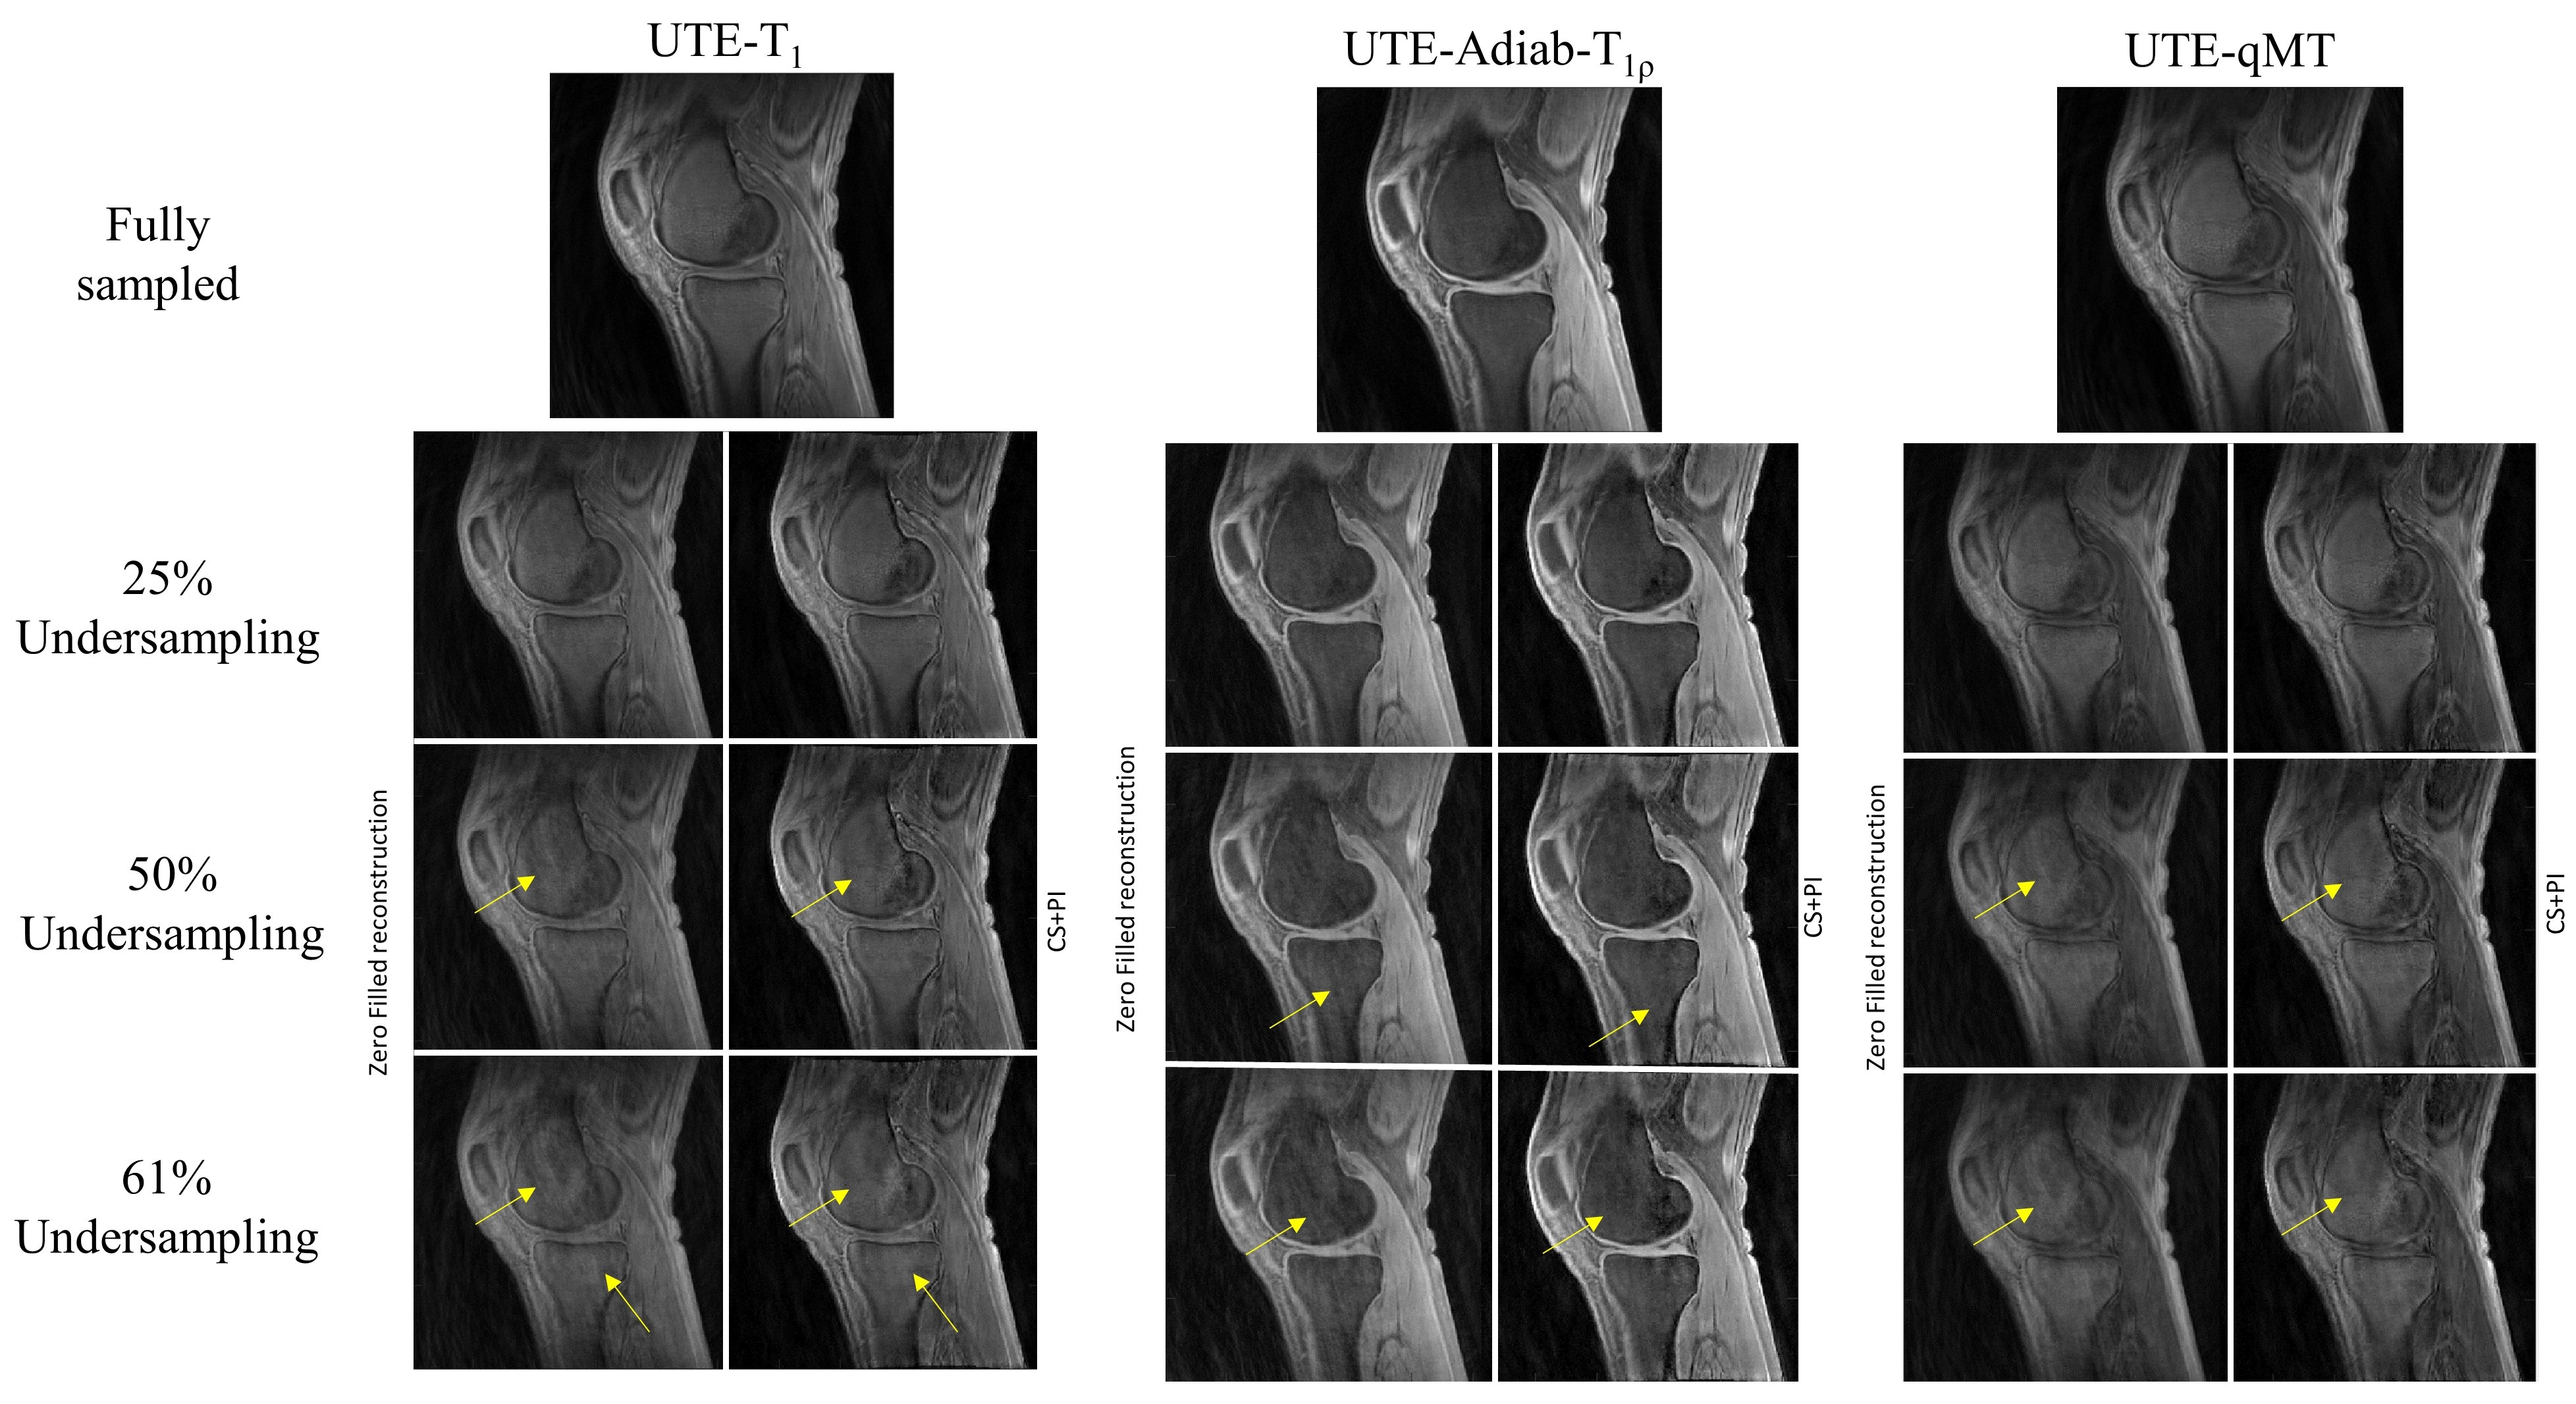
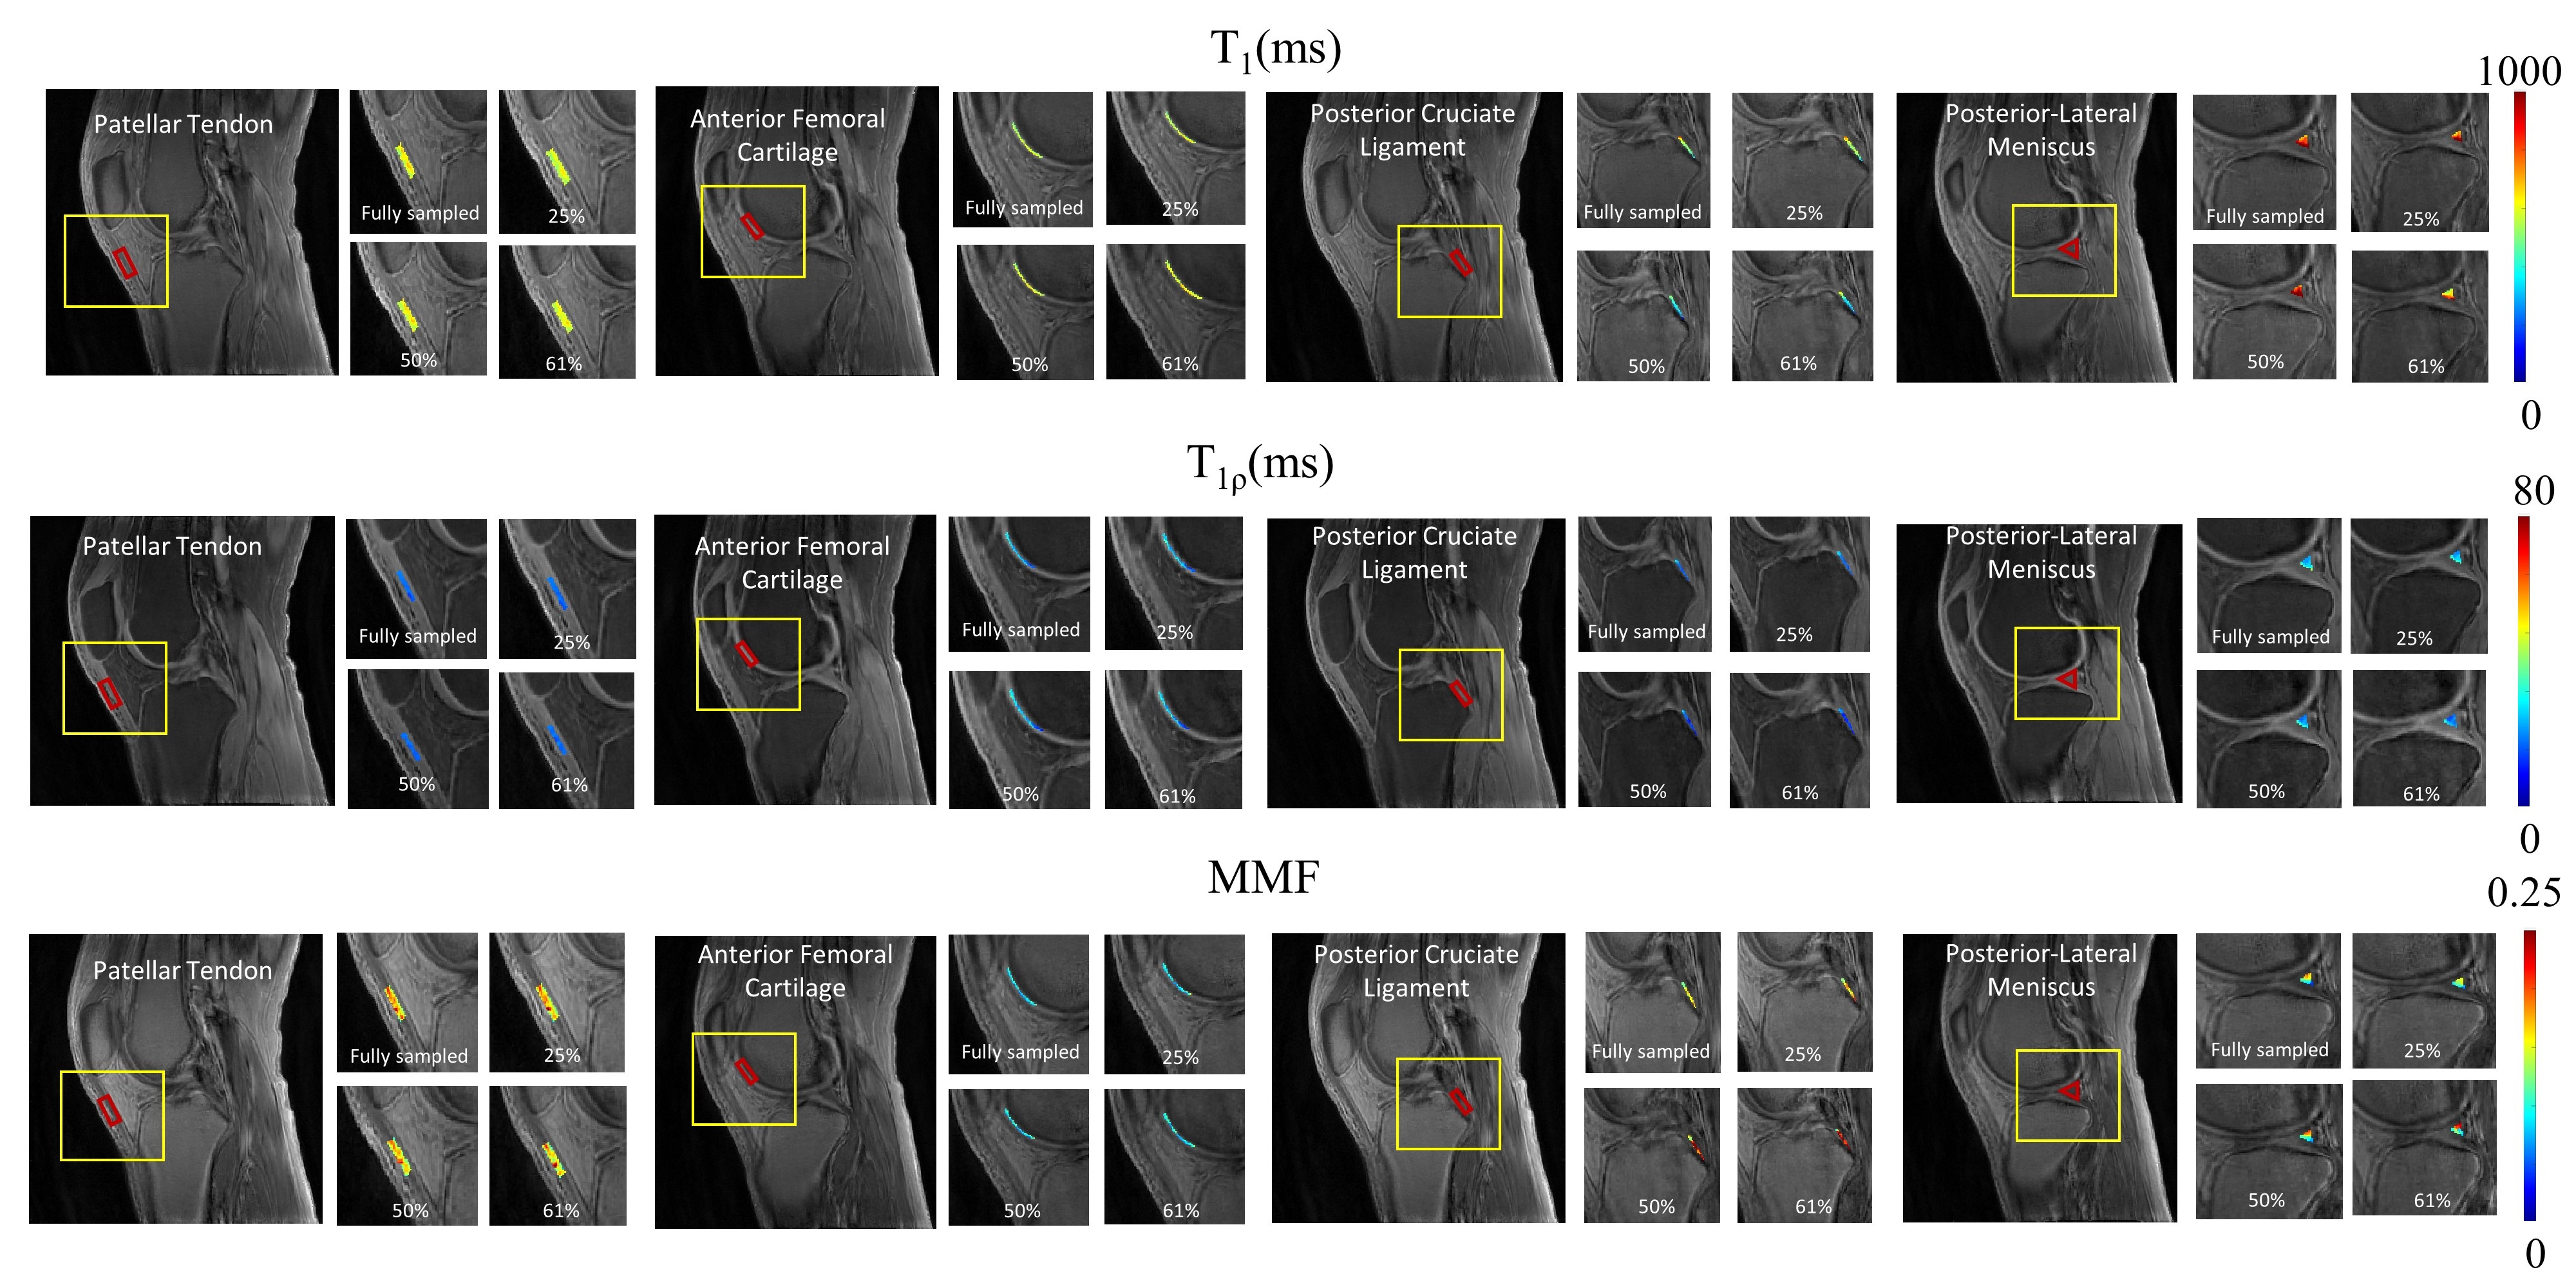
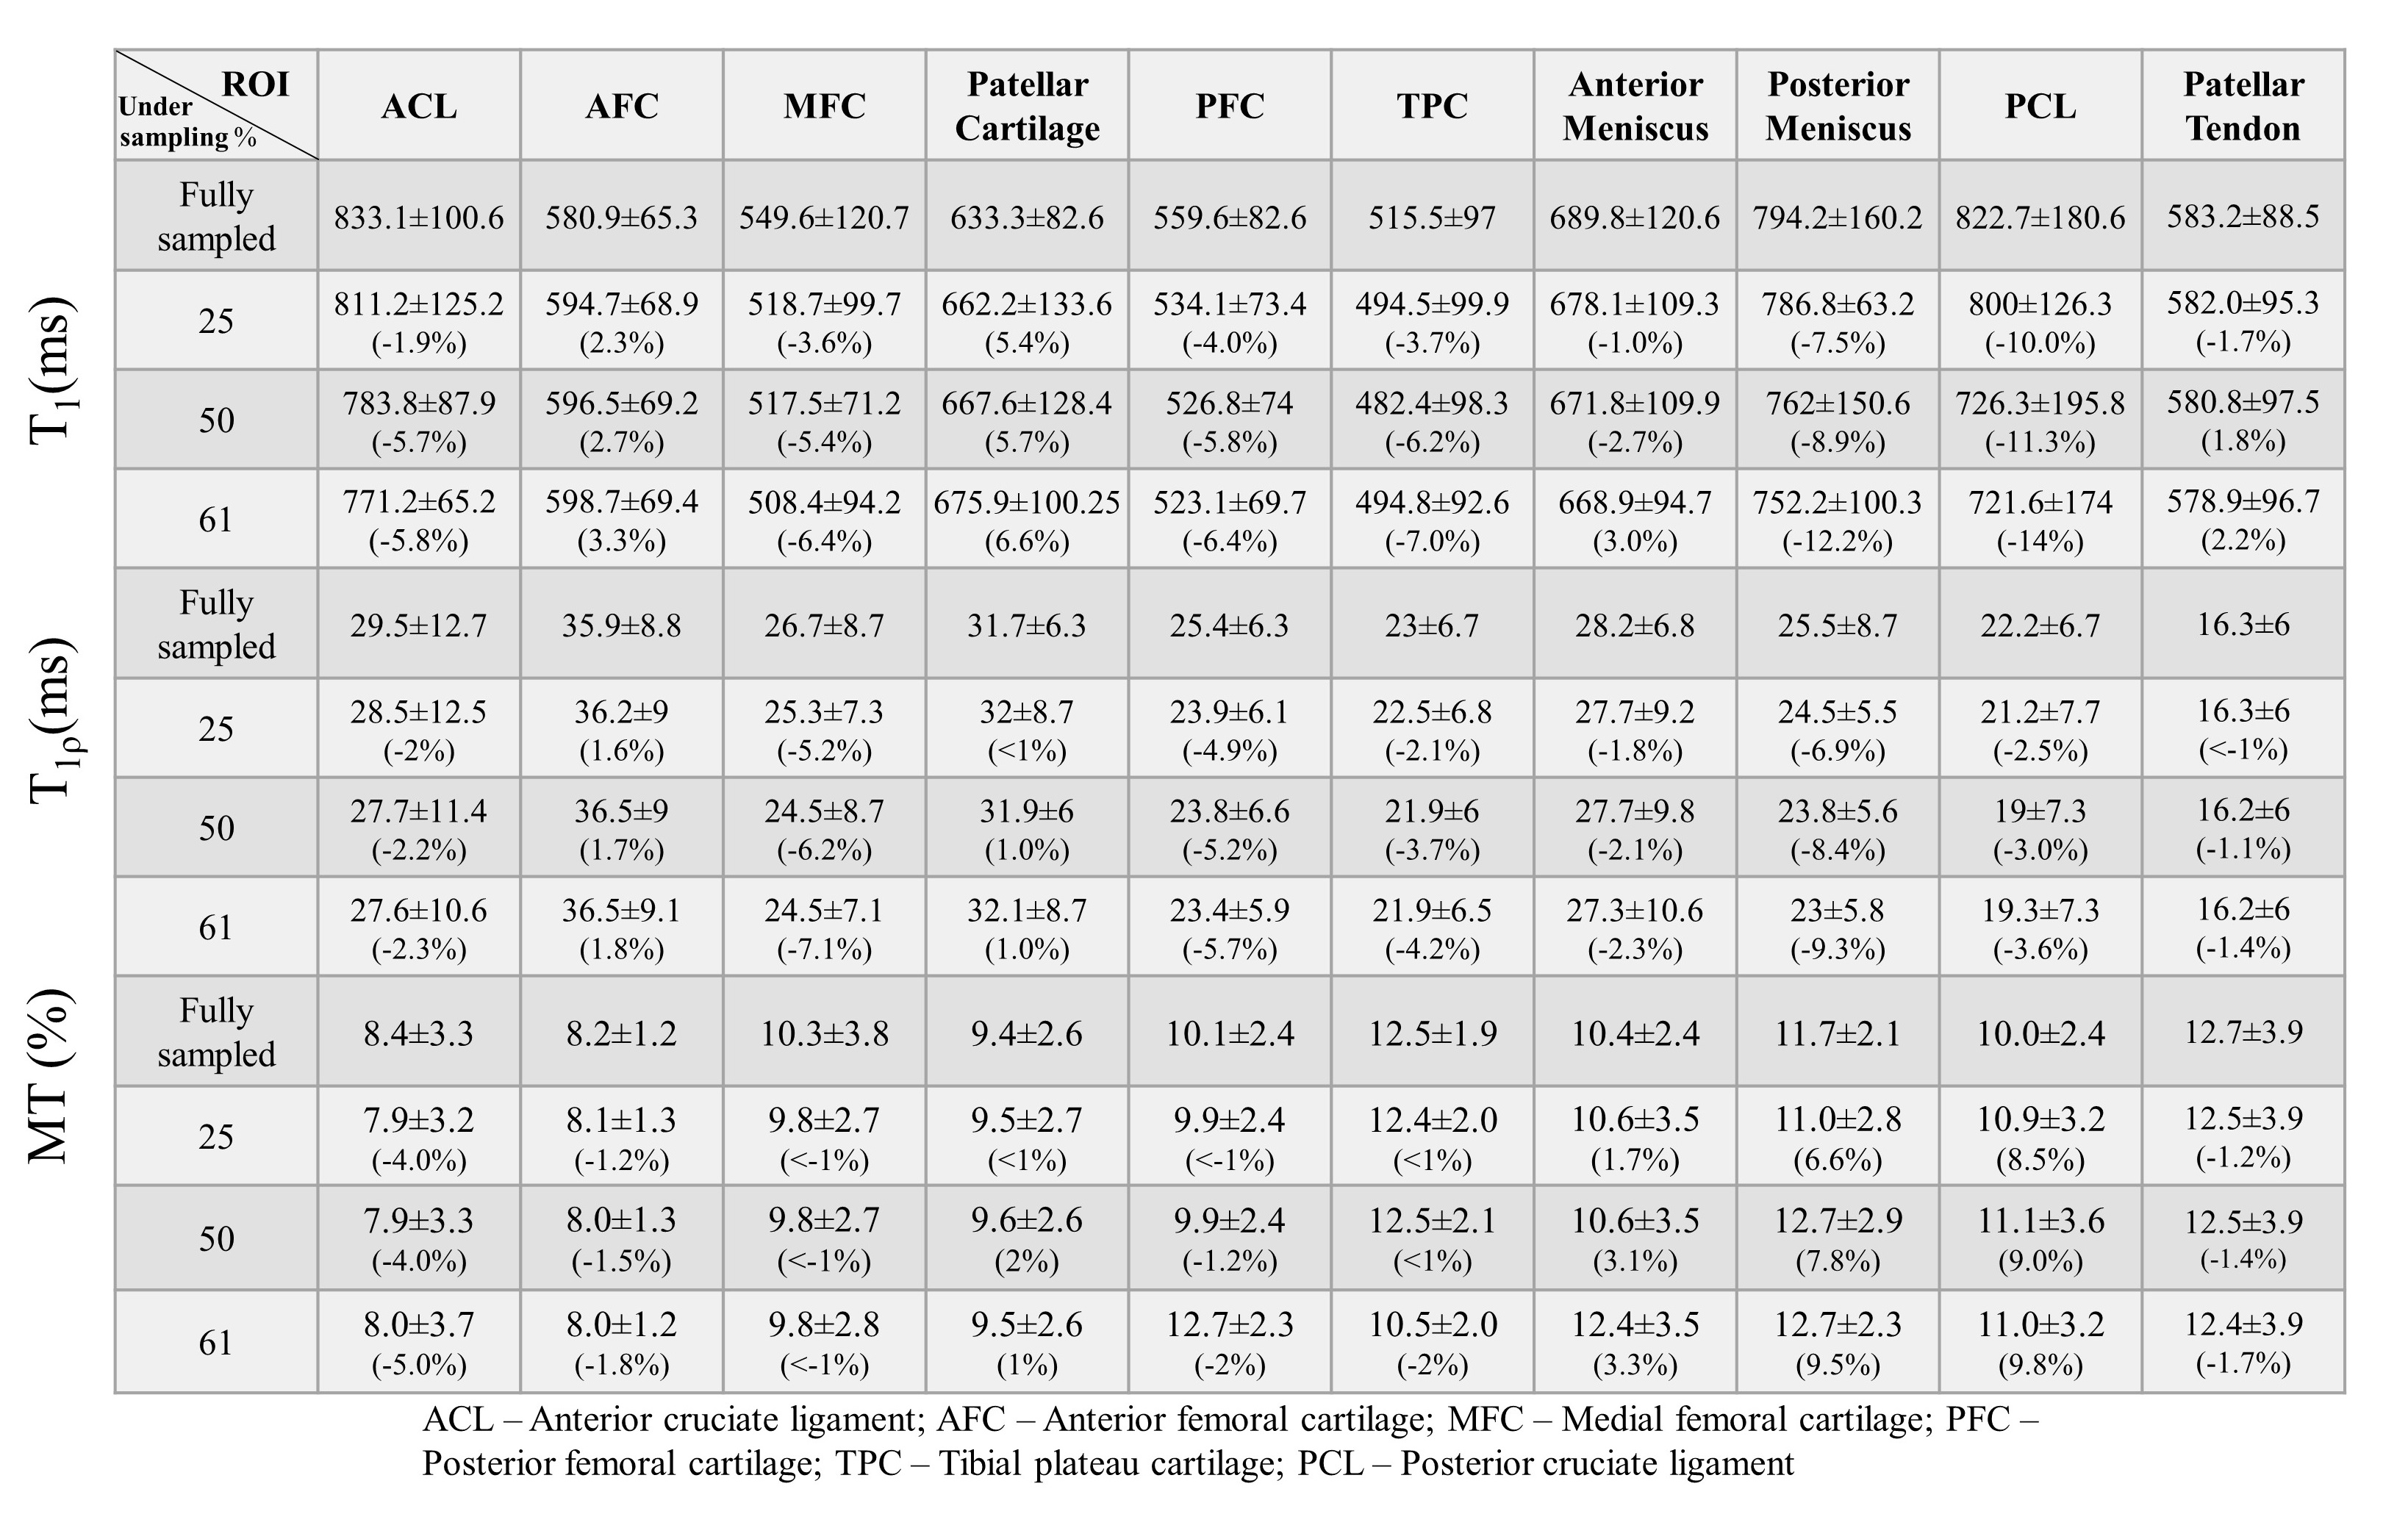
For all reconstructed datasets, CS provided a discernible morphological improvement in reconstruction. Figure 2 shows images from a representative volunteer with various undersampling rates. Zero-filled reconstruction has pronounced streaking artifacts at higher undersampling rates than its counterpart. Figure 3 illustrates the ROI based mapping of T1, T1ρ and MMF parameters. Figure 4 provides the mean and standard deviation values as well as mean percent error obtained in ROIs for each parameter at different undersampling level. Most of the ROIs exhibited percent error below 5%. PCL and posterior meniscus exhibited relatively higher error presumably due to the partial volume effect and the small tissue size, more susceptible to the reconstruction errors. Figure 5 depicts the scatter plots with Pearson’s correlation for different parameters at various undersampling levels. Each ROI is coded with different color to identify the outlier points. Amongst all ROIs, PCL seemed to possess a larger number of outliers at different quantification maps due to abovementioned reasons.Discussion and Conclusion
We have demonstrated the feasibility and efficacy of CS reconstruction for quantitative 3D UTE-Cones imaging of the knee. The results showed that images can be reconstructed from undersampled data with highly reasonable imaging standard to allow robust UTE parameter mapping with minimal error (correlation > 0.95 with 50% undersampling). With 50% undersampling, CS reconstruction is expected to shorten the scan time down to 3min 4 sec, 4 min 27sec and 4min 49sec for UTE-T1, Adiab-UTE-T1ρ, and UTE-qMT respectively, which is more suitable for clinical MRI workflow.Acknowledgements
The authors acknowledge grant support from the NIH (R01AR062581, R01AR068987, R01AR075825, R01AR078877, and R21AR075851), Veterans Affairs (I01RX002604, I01CX002211, and I01CX001388), and GE Healthcare.References
1. Holmes, J. E. & Bydder, G. M. MR imaging with ultrashort TE (UTE) pulse sequences: Basic principles. Radiography 11, 163–174 (2005).
2. Ma, Y. J. et al. Whole knee joint T1 values measured in vivo at 3T by combined 3D ultrashort echo time cones actual flip angle and variable flip angle methods. Magn. Reson. Med. 81, 1634–1644 (2019).
3. Ma, Y. J. et al. 3D adiabatic T1ρ prepared ultrashort echo time cones sequence for whole knee imaging. Magn. Reson. Med. 80, 1429–1439 (2018).
4. Ma, Y. J., Shao, H., Du, J. & Chang, E. Y. Ultrashort echo time magnetization transfer (UTE-MT) imaging and modeling: magic angle independent biomarkers of tissue properties. NMR in Biomedicine vol. 29 1546–1552 (2016).
5. Wu, M. et al. Magic angle effect on adiabatic T1ρ imaging of the Achilles tendon using 3D ultrashort echo time cones trajectory. NMR Biomed. 33, (2020).
6. Ma, Y. J., Chang, E. Y., Carl, M. & Du, J. Quantitative magnetization transfer ultrashort echo time imaging using a time-efficient 3D multispoke Cones sequence. Magn. Reson. Med. 79, 692–700 (2018).
7. Lustig, M., Donoho, D. L., Santos, J. M. & Pauly, J. M. Compressed sensing MRI: A look at how CS can improve on current imaging techniques. IEEE Signal Processing Magazine vol. 25 72–82 (2008).
8. Lustig, M., Donoho, D. & Pauly, J. M. Sparse MRI: The application of compressed sensing for rapid MR imaging. Magn. Reson. Med. 58, 1182–1195 (2007).
9. Zibetti, M. V. W., Sharafi, A., Otazo, R. & Regatte, R. R. Accelerating 3D-T1ρ mapping of cartilage using compressed sensing with different sparse and low rank models. Magn. Reson. Med. 80, 1475–1491 (2018).
10. Pipe, J. G. & Menon, P. Sampling density compensation in MRI: Rationale and an iterative numerical solution. Magn. Reson. Med. 41, 179–186 (1999).
11. Fessler, J. A. On NUFFT-based gridding for non-Cartesian MRI. J. Magn. Reson. 188, 191–195 (2007).
12. Uecker M, Ong F, Tamir JI, Bahri D, Virtue P, Cheng JY, Zhang T,Lustig M. Berkeley advanced reconstruction toolbox. In Proceedings of the 23rd Annual Meeting ISMRM, Toronto, Canada, p-2486, (2015).
Figures