2429
Temperature and Concentration Dependence of Diffusion Kurtosis Parameters in a Quantitative Phantom1Radiology, University of Michigan, Ann Arbor, MI, United States, 2CIRS, Inc, Norfolk, VA, United States
Synopsis
Recently developed quantitative phantom based on lamellar-vesicles provides the range of tissue relevant diffusion kurtosis parameters for accurate evaluation of advanced multi-b DWI protocols and parametric diffusion models. This work studies temperature dependence of phantom diffusion kurtosis parameters to supply accurate nominal parameter values for typical scan room temperature range.
Introduction
To mimic multi-compartment impeded diffusion observed in tumors1,2, a stable quantitative diffusion phantom with tunable characteristics was recently developed3,4 based on water vesicles of different sizes and concentrations. The phantom provides tissue-like multi-exponential diffusion signal decay as a function of b-value3,4, and can provide ground-truth parameter values for calibration of advanced diffusion protocols1,2 and models5,6. Accuracy of the phantom diffusion parameters depends on temperature. The study objective was to quantify and report accurate diffusion parameter values for the kurtosis diffusion model over typical range of scanner room temperatures.Methods
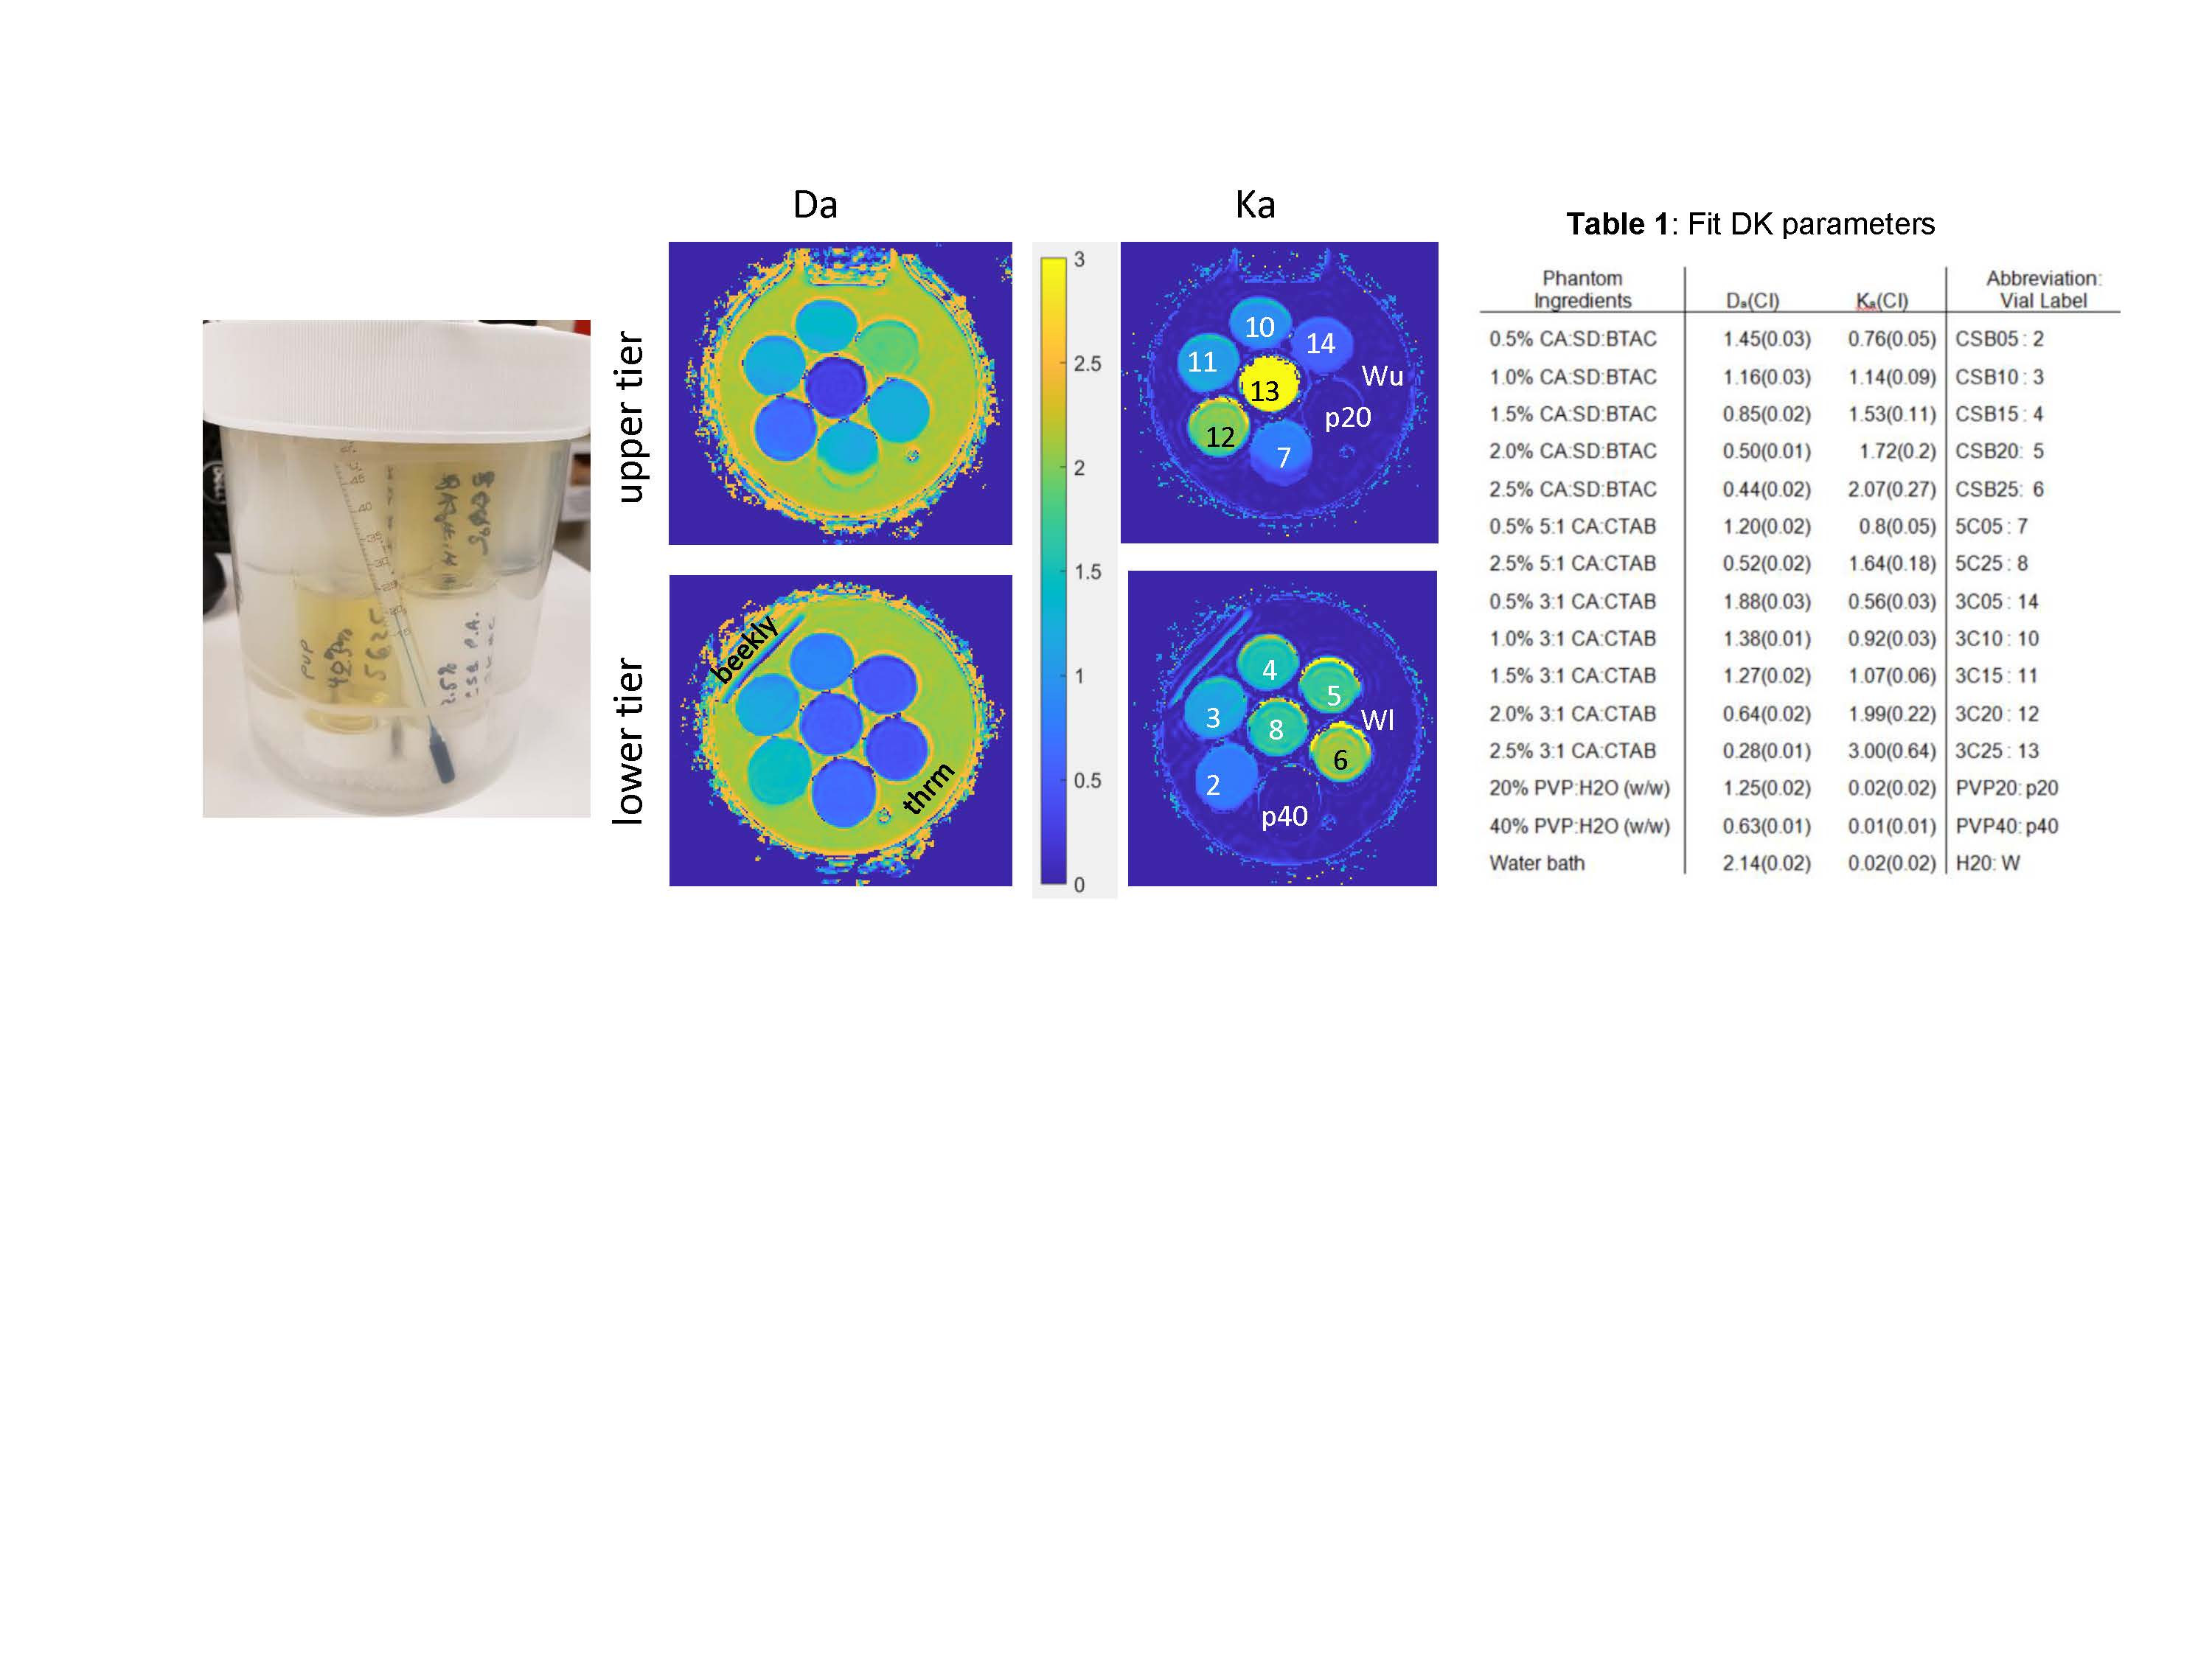
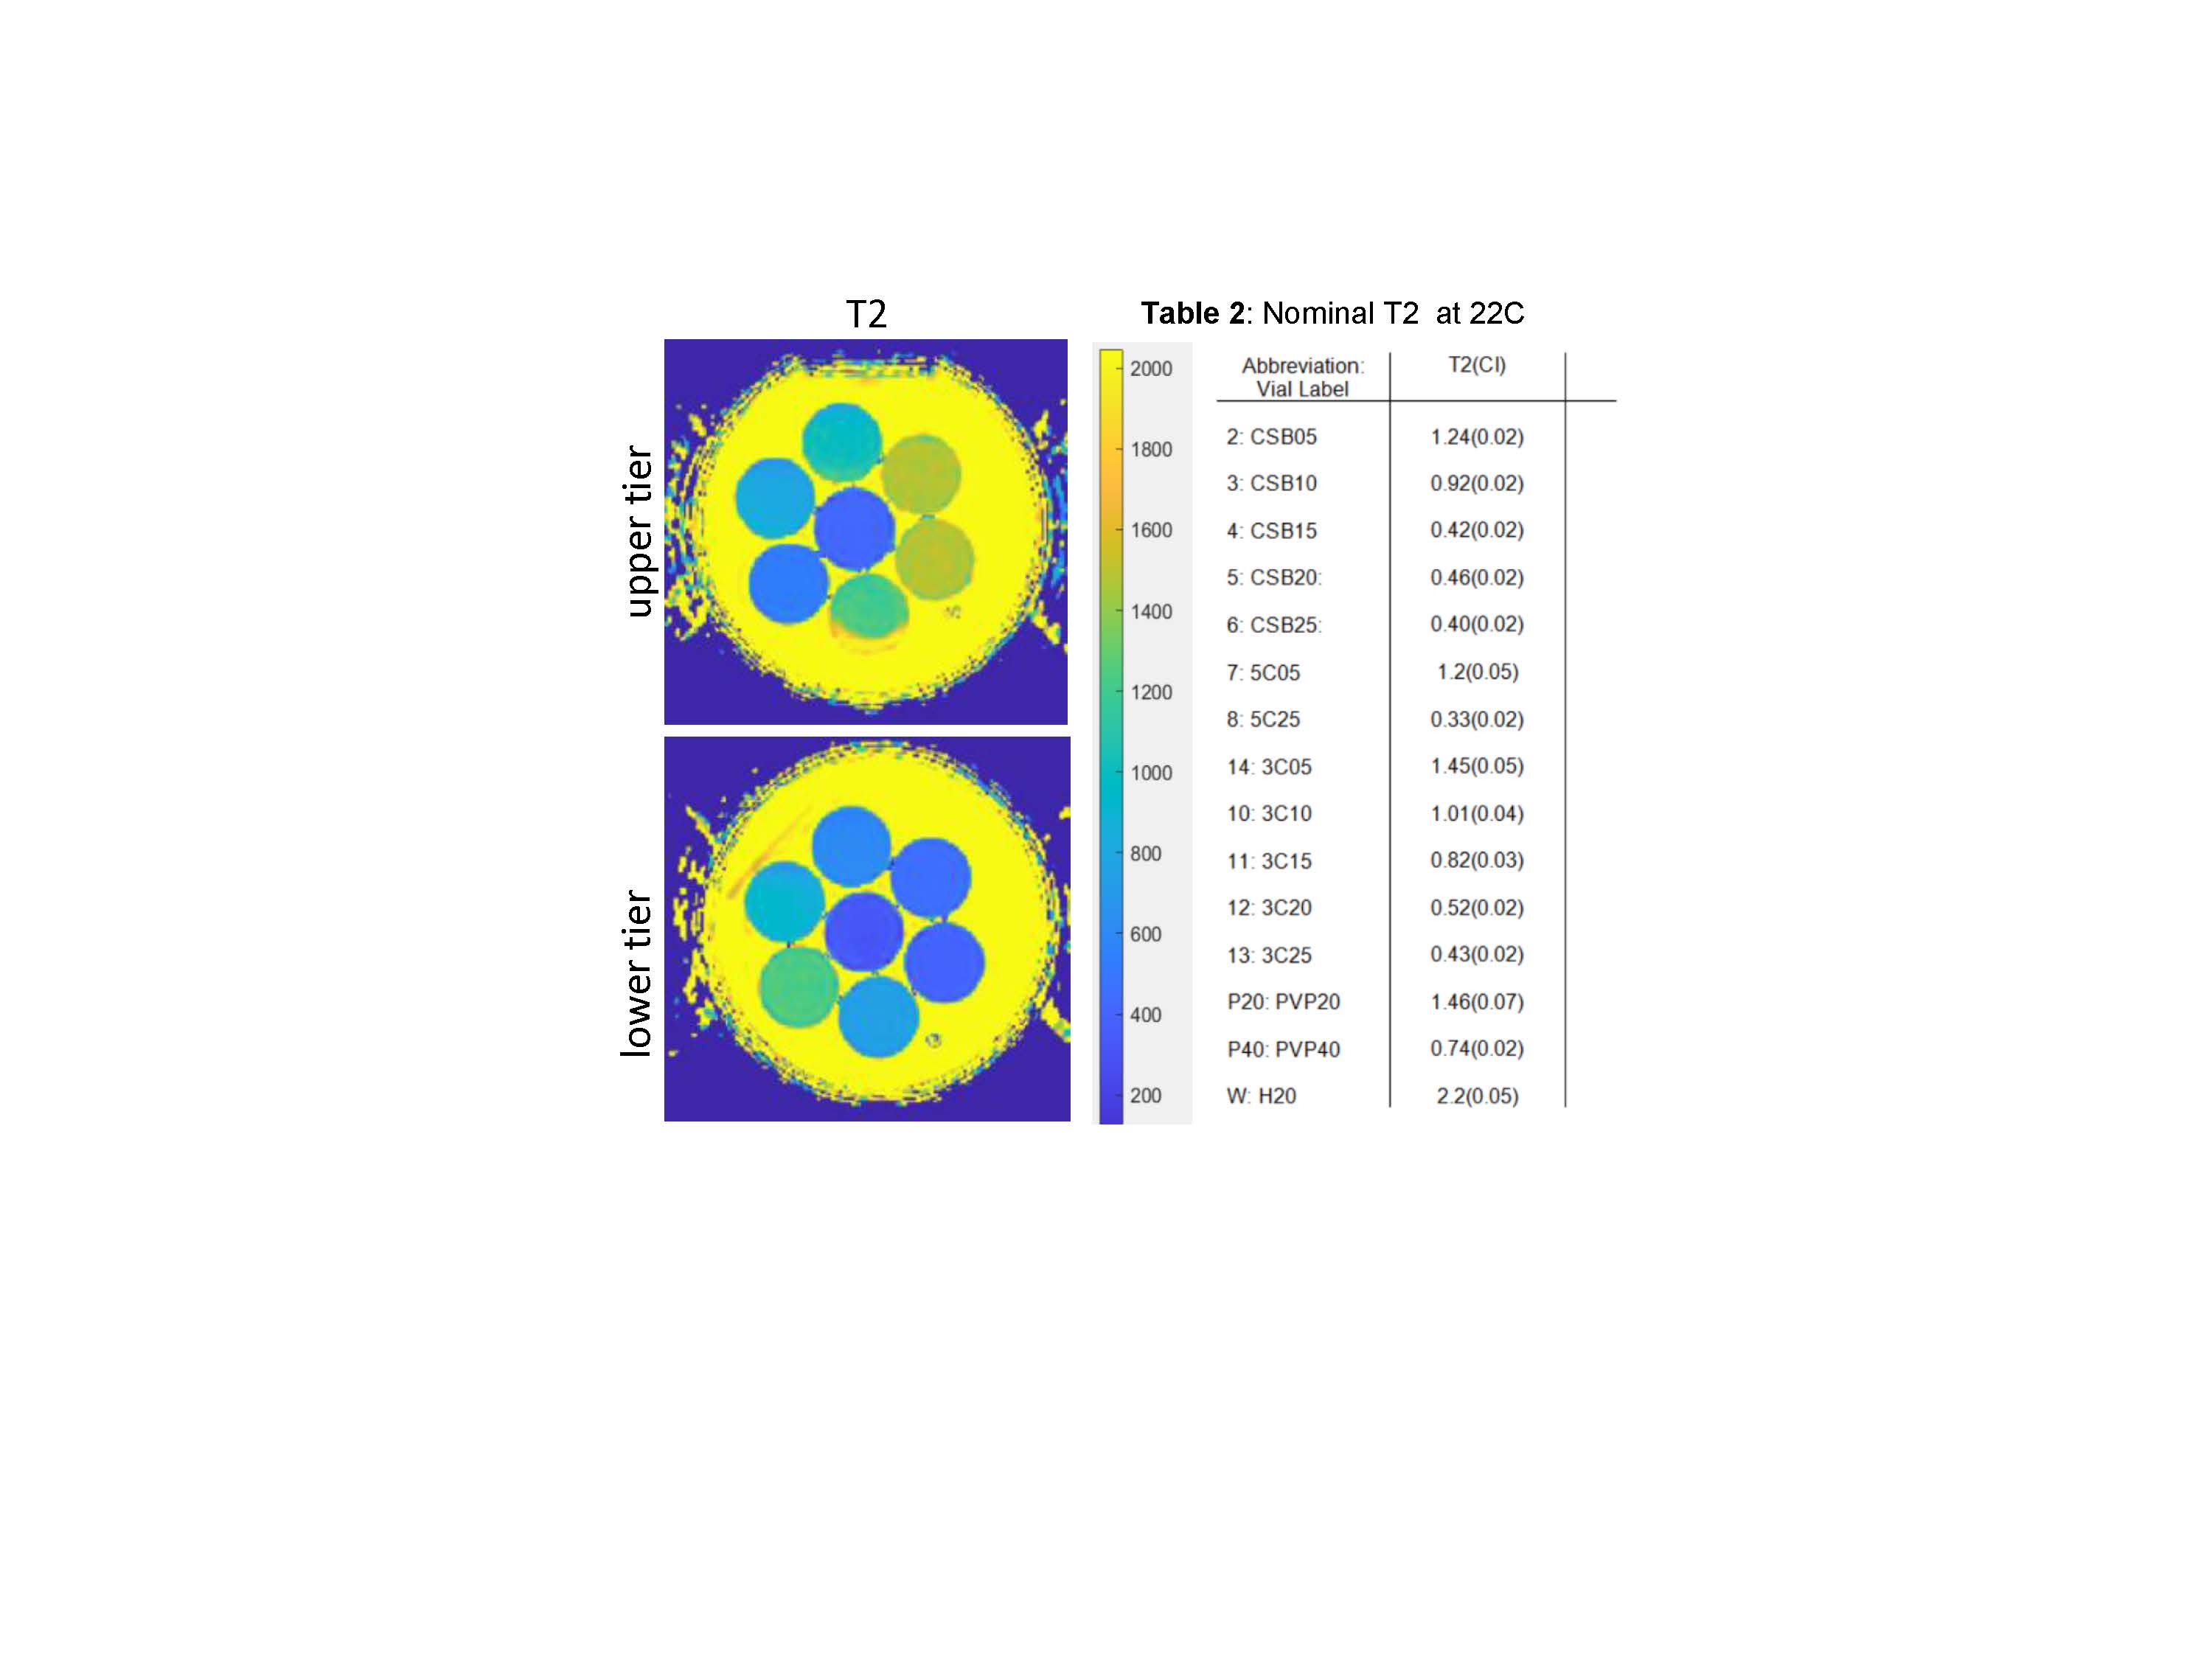
Multi-exponential diffusion phantom: The phantom is based on vesicle-in-water emulsions that provided pools of relatively freely diffusing water and water restricted to the micron-sized vesicles4, made of long-chain alcohols and surfactants. Twelve distinct phantom samples were manufactured from cetearyl alcohol (CA), behentrimethyl ammonium chloride (BTAC), stearylamidoproply dimethylamine (SD) and cetyltrimethyl ammonium bromide (CTAB). CA:CTAB molar ratios were 5:1 and 3:1, and CA:SD:BTAC 7:1:1; and %(w/w) solid-in-water ranged between 0.5% and 2.5% (Table1). Two mono-exponential diffusion polyvinylpyrrolidone (PVP) controls at 20% and 40% were also included. The samples were placed in glass scintillation vials and arranged in two tiers inside a 1L jar with water bath (Figure 1). The phantom also included an alcohol thermometer for temperature (T) reading to ±0.5 °C.Phantom T, DWI and T2 measurements: The phantom was left to thermalize in the scanner room with different temperature (T) settings for longer than 3 hours before scanning. The phantom temperature was read from thermometer before and after scanning. Measured water ADC in upper and lower tier was also used to confirm T inside the phantom container from Speedy-Angel relation7. The studied T=19.5, 20.5, 22, 23.5, and 25.5 °C were further confirmed to (±0.2 °C) using previously derived PVP20 and PVP40 ADC calibrations8. The phantom DWI were acquired at all five temperatures using 10 b-values between 0 and 2.5ms/μm2, TR/TE (10/0.105 s), and 1.7x1.7x5 mm3 voxels. Phantom T2 was measured at 22°C using 14-echo sequence with TE delay between 40ms and 560ms varying in steps of 40ms, TR=5s, 15 slices 4mm thick with 0.4mm gap.
Data analysis: Phantom T2 map was reconstructed on the scanner at 22 °C by fitting mono-exponential decay function to log-signal dependence on TE. Diffusion kurtosis (DK) model parameters apparent diffusion, Da, and kurtosis, Ka, were derived offline at all studied temperatures from linear least squares fit for log-signal of DWI voxels according to: -bDa+Ka(bDa)2/6. The maximum b-value constraint bmax<3/(DaKa) was implemented for DK model5 by iterative fitting, using b > 0.1ms/μm2. The Ka was further constrained to <3. DK model fit utilized lscov function from MATLAB R2019b (Mathworks, Natick MA) that provided standard errors for fit parameters. 1cm diameter ROIs were manually placed on the sample vials to measure mean and standard deviation of fit DK and T2 parameters. Mean fit errors within ROI were scaled by 1.98 to derive confidence interval (CI). To detect inter-parameter dependencies, Pearson correlation, R, was used.
Results and Discussion
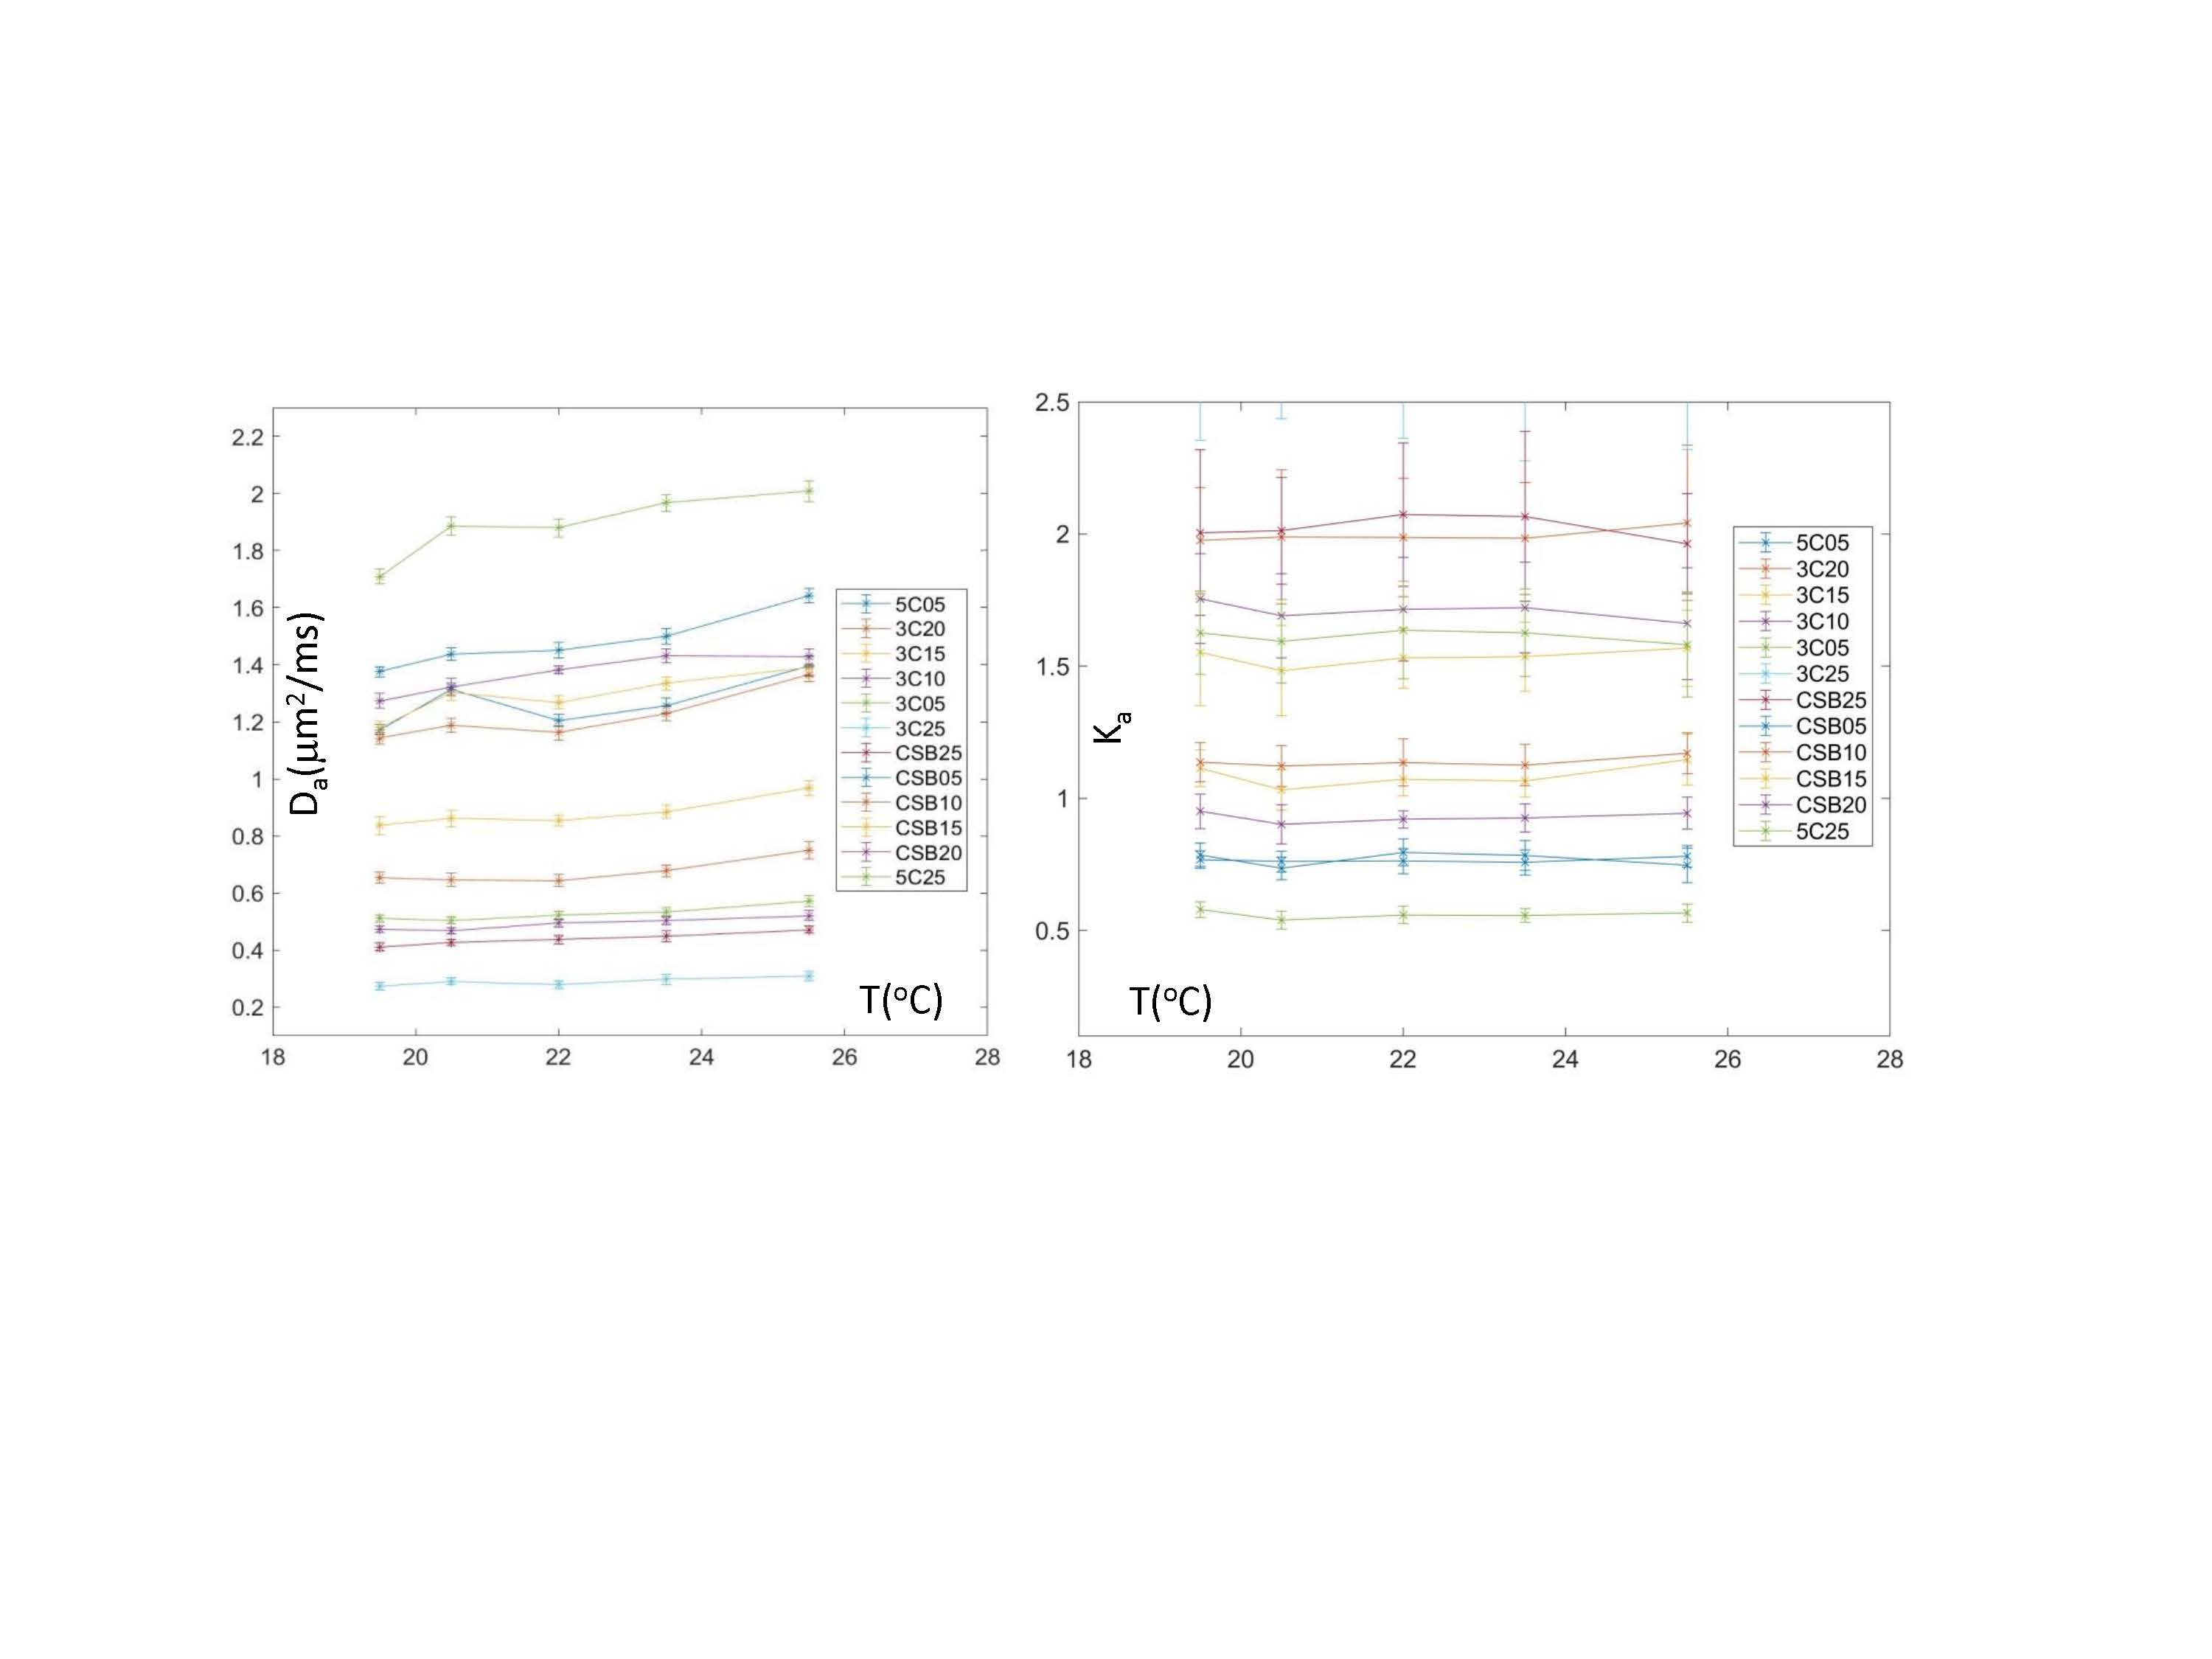
Table 1 in Figure 1 summarizes the DK model parameters at 22 °C. For mono-exponential controls, the fit Ka≤0.02 was within CI, indicating good fit fidelity (small bias). For multi-exponential diffusion samples, the measured Da values ranged from 0.28 to 1.88, with increased diffusion observed primarily for lower concentration (R=-0.92, P<0.001) or lower alcohol:surfactant ratio at the same concentrations (e.g., 3:1 for “3C” versus 7:1 for “CSB”) consistent with phantom design4. Reverse trend was observed for Ka (negatively correlated to Da: R=-0.91, P<0.001), decreasing from 2.1 to 0.56 with decreasing concentration (R=0.88, P<0.001) and molar fraction. Overall fit errors were lower for Da (CI<0.03) compared to 3-10-fold higher for Ka (CI up to 0.3), likely indicative of the DK model limitation for true multi-exponential diffusion system.Measured phantom sample T2 is summarized in Table 2 (Figure 2). For multi-exponential diffusion samples, T2 ranged from 1.45s to 0.4s, and similar to Da, was decreasing primarily with increasing %solid (R = -0.94; P<0.001) and alcohol molar fraction (CSB versus 3C.). Observed phantom T2 relaxation was close to those of the luminal water and blood1, but would need adjustment to mimic lower tissue T2<100ms. Figure 3 shows temperature dependence of DK phantom parameters. The measured DK parameters staid within the ranges observed in vivo1,2. Ka of all samples was apparently stable within the measurement error (CI error bars). Da was moderately increasing with temperature, faster for samples of low vesicle concentration (≤1%) and lower molar alcohol fraction. 5C and CSB samples above 1% solid fraction provided best thermal stability. Overall, CSB materials provide similar DK parameter range to 3C materials.
Conclusion
The phantom Da, 1/Ka and T2 linearly decreased with increasing vesicle concentration. Within studied scanner room temperature range, the phantom kurtosis was nominally independent of temperature, and diffusion was increasing with T for low concentration and low alcohol fraction materials. The CSB samples provided best thermal stability.Acknowledgements
Funding support from National Institutes of Health Grants: U01CA166104, U24CA237683, and U01 CA211205, and 75N91021C00036References
1Panagiotaki E, Chan RW, Nikolaos Dikaios N, et al. Microstructural Characterization of Normal and Malignant Human Prostate Tissue With Vascular, Extracellular, and Restricted Diffusion for Cytometry in Tumors Magnetic Resonance Imaging. Inv. Rad. 2015;50: 218–227.
2Hectors SJ, Semaan S, Song C, Lewis S, et al. Advanced Diffusion-weighted Imaging Modeling for Prostate Cancer Characterization: Correlation with Quantitative Histopathologic Tumor Tissue Composition-A Hypothesis-generating Study. Radiology 2018;286(3):918-28
3Malyarenko DI, Swanson SD, Konar AS, LoCastro E, Paudyal R, Liu MZ, Jambawalikar SR, Schwartz LH, Shukla-Dave A, Chenevert TL. Multicenter Repeatability Study of a Novel Quantitative Diffusion Kurtosis Imaging Phantom. Tomography. 2019;5:36-43
4Swanson S, Malyarenko D, Chenevert T. Tunable diffusion kurtosis in lamellar vesicle suspensions: Toward development of quantitative phantom surrogate of tumor microenvironment. Proc. Intl Soc Mag Reson Med 2019, TP3632, Montreal CA.
5Jensen JH, Helpern JA. MRI quantification of non-Gaussian water diffusion by kurtosis analysis. NMR Biomed. 2010; 23: 698–710.
6Iima M, Le Bihan D. Clinical Intravoxel Incoherent Motion and Diffusion MR Imaging: Past, Present, and Future. Radiology. 2016; 278(1):13-32
7Holz M, Heil SR, and Sacco A, “Temperature-dependent self-diffusion coefficients of water and six selected molecular liquids for calibration in accurate 1H NMR PFG measurements,” Phys. Chem. Chem. Phys., 2000; vol. 2, no. 20, pp. 4740–42.
8Amouzandeh G, Malyarenko DI, Pang Y, Ross BD, and Chenevert TL. Temperature and Concentration Dependence of PVP Phantom Diffusion. Proc. Intl Soc Mag Reson Med 2021, virtual due to COVID, DP 3413
Figures