2428
Time dependence of the diffusion and kurtosis tensors in strongly filtered diffusion signals1Champalimaud Centre for the Unknown, Lisbon, Portugal, 2Center for Functionally Integrative Neuroscience, Department of Clinical Medicine, Aarhus University, Aarhus, Denmark, 3Department of Physics and Astronomy, Aarhus University, Aarhus, Denmark
Synopsis
The sensitivity of diffusion MRI (dMRI) towards microstructural features is quite high, but its specificity is low due to the ubiquity of water in biological tissues. Here, we harness a strongly filtered diffusion kurtosis imaging (DKI) approach to (i) suppress fast diffusion spins typically associated with extracellular space and (ii) measure the time dependencies of the full filtered diffusion and kurtosis tensors in an ex-vivo mouse brain at 16.4T. Following the application of a very strong filter of b1=15ms/µm2 perpendicular to axon fibers, we find signatures for restricted diffusion that are tentatively associated with intracellular space.
Introduction
Diffusion MRI (dMRI) can provide detailed information on micron-scale dimensions even when the voxel size is very large1,2. The sensitivity of dMRI methods, including Diffusion Tensor MRI (DTI) and Diffusion Kurtosis MRI (DKI) towards microstructural features in, e.g., disease3 or plasticity4, is well documented but specificity remains low in biological tissues5. The diffusion tensor6 and more recently, kurtosis tensor7,8 time dependencies9–11, along with the Standard Model for diffusion2,12, have been proposed as more specific markers for in tissue microstructure. However, D(t) and K(t) experiments inherently conflate information from all tissue components.Filtered dMRI experiments are typically used for measuring exchange by varying mixing time13,14. More recently, filtered dMRI was used with an initial diffusion weighting designed to suppress more rapidly diffusing spins, followed by a conventional dMRI block probing the remaining components by varying the orientations and b-values of the second wavevector15–17. The suppressed spins are typically considered “extra-axonal” or “extracellular”; however, effective suppression of extra-axonal components in white matter (WM) requires b>15 [ms/µm2]18, and previous studies extracted direction-averaged properties rather than full tensors. Thus, the true time dependencies of the intracellular diffusivity and kurtosis still remain unknown.
Here, we harness a very high b-value filtered-DKI(t) approach to characterise detailed D(t) and K(t) profiles of the unsuppressed (restricted) water components in brain tissue.
Methods
All animal experiments were preapproved by the competent national and international authorities and were carried out according to EU Directive 2010/63.Sample: A mouse brain was extracted from a healthy adult via intracardiac PFA perfusion and preserved in a PBS solution. The brain was then mounted in a 10 mm NMR tube filled with Fluorinert® and scanned at 37°C on a 16.4T scanner equipped with a microimaging probe capable of producing up to 3000 mT/m (isotropic).
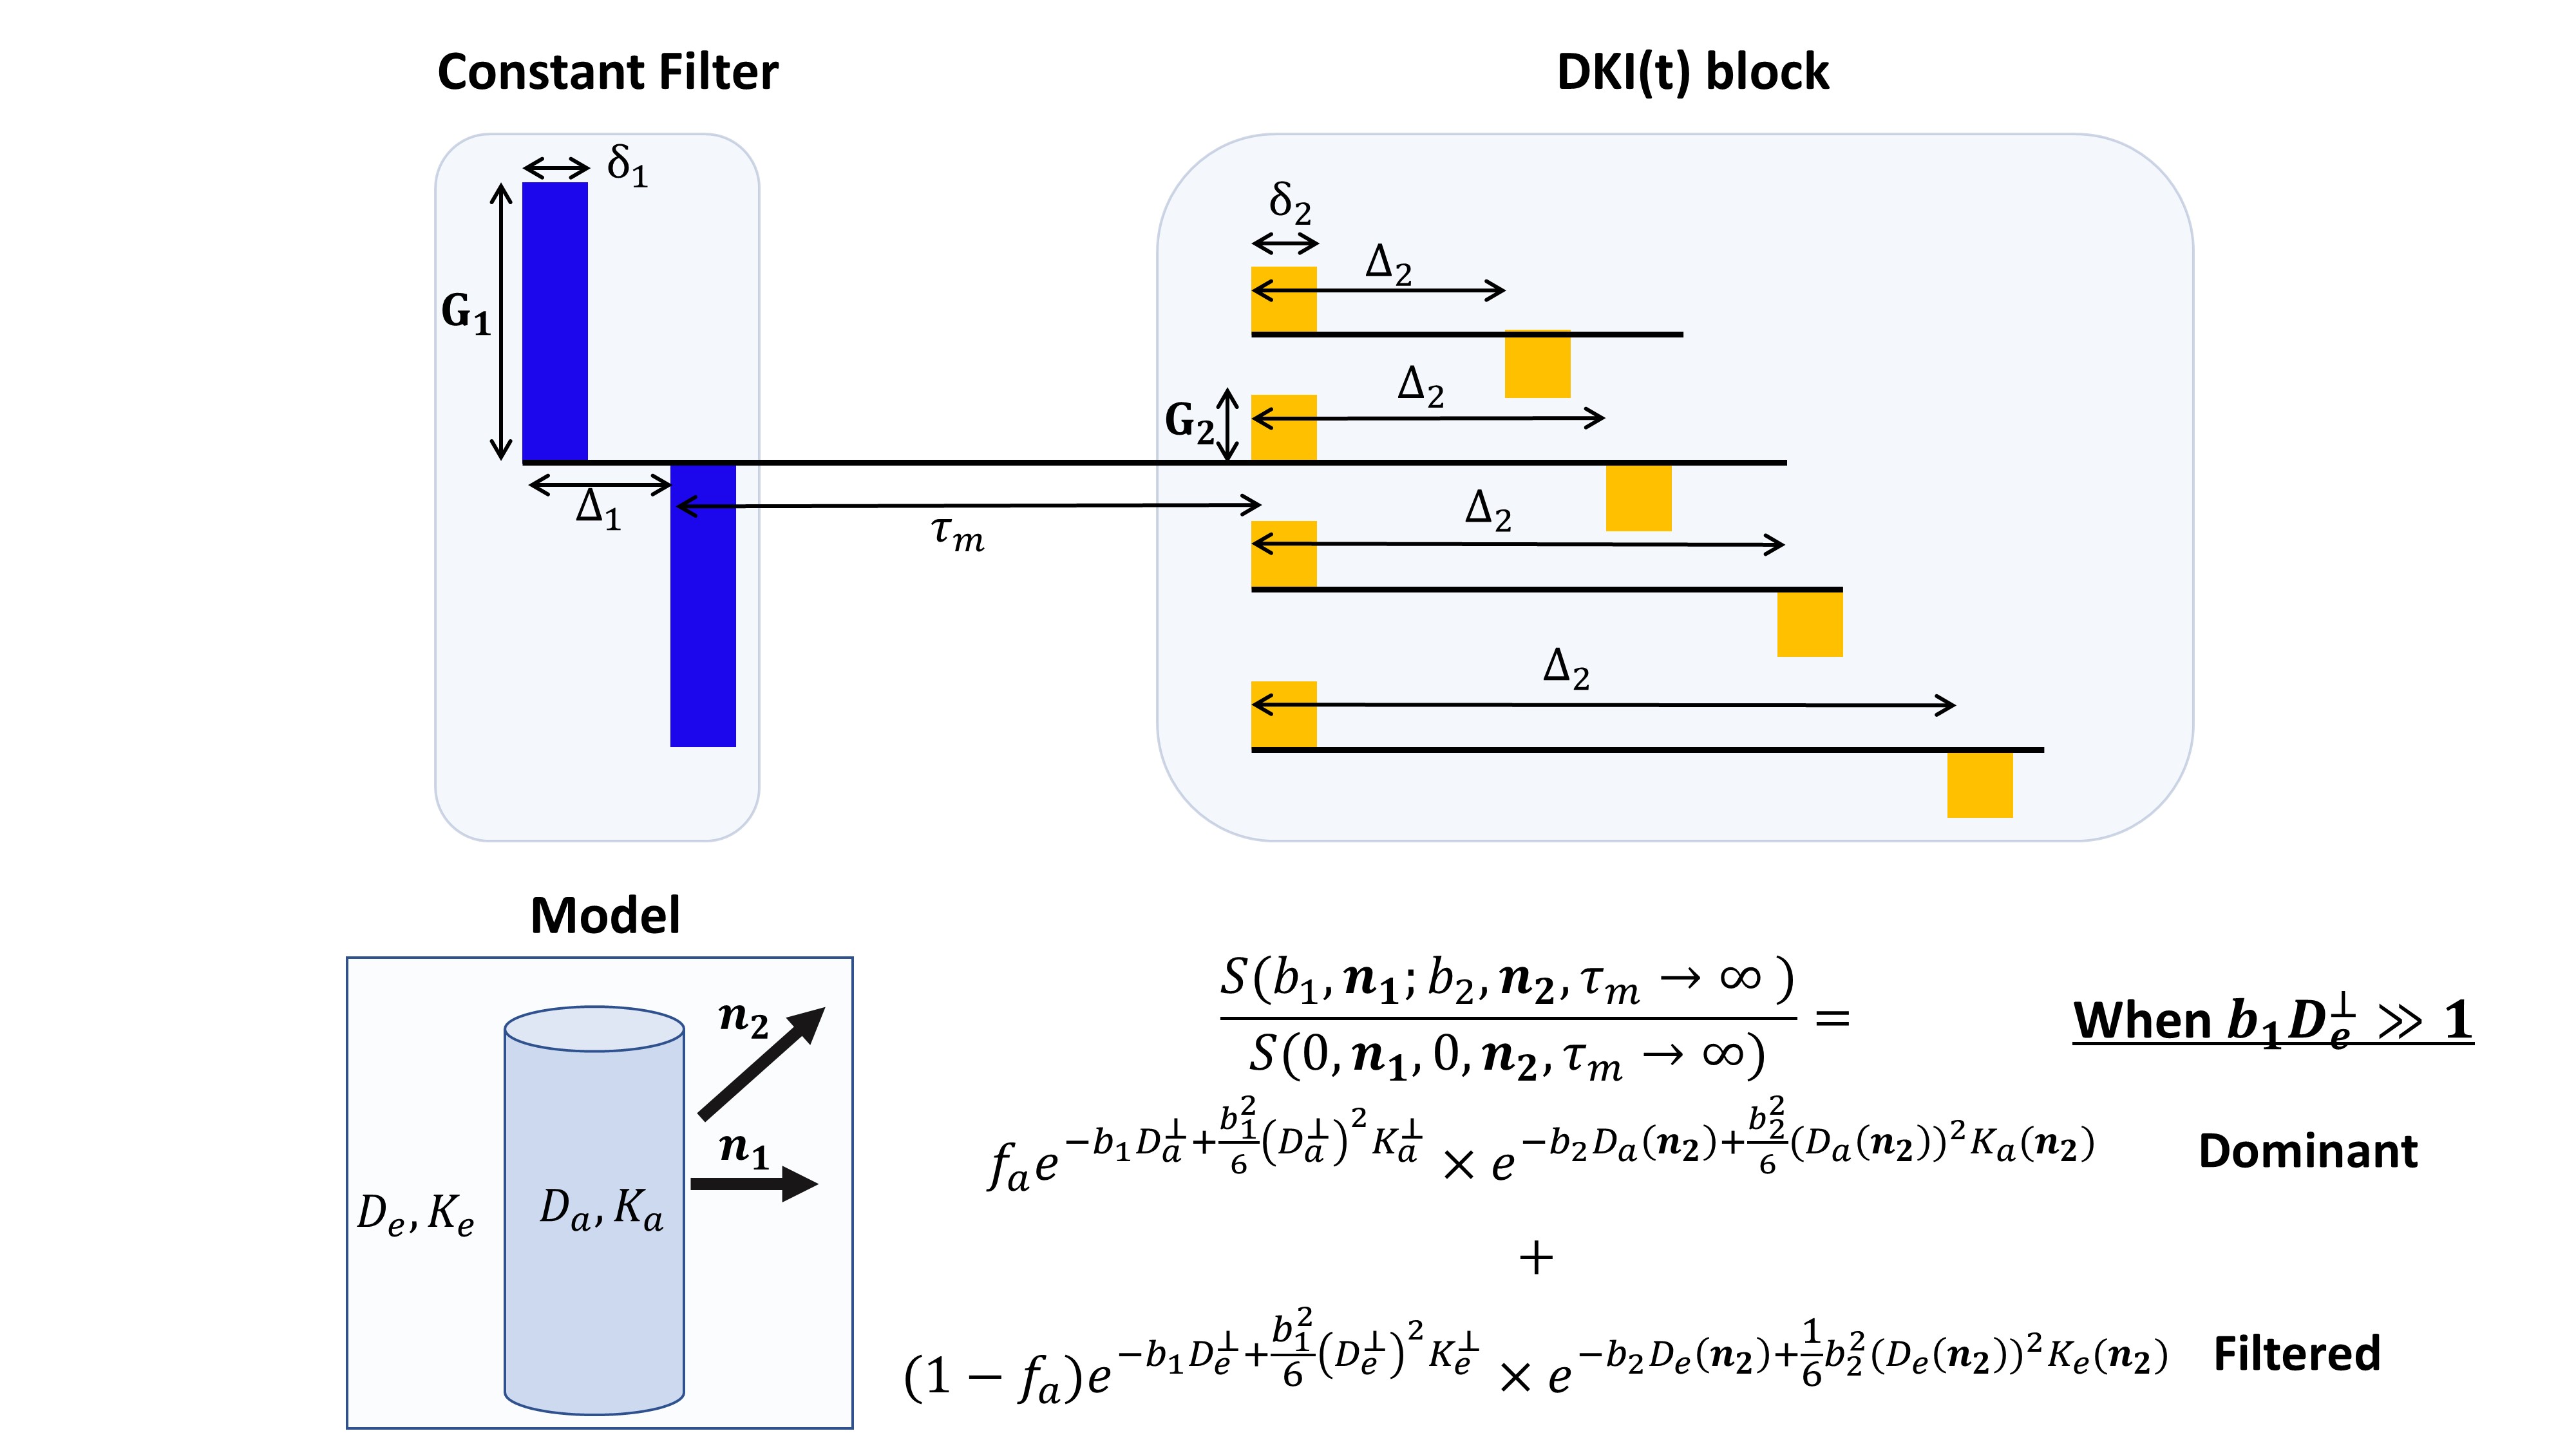
MRI Experiments: A Double Diffusion Encoding19,20 pulse sequence was modified (Fig. 1) such that the first gradient pulse pair provided strong constant diffusion weighting of b1=15 ms/µm2 (Δ1/δ1=10/3 ms) perpendicular to corpus callosum, followed by a 10 ms mixing time and another gradient pulse pair with δ2=2 ms and variable Δ2 of 4,5,6,7.5,10,12.5 and 15 ms. The b2-values for the second pair were 0,1,1.5,2,2.5 ms/µm2 for each and 30 directions per b2-value were acquired, allowing for the extraction of the full diffusion and kurtosis tensors from the filtered diffusion component. A total of 8 S(0,0) and 10 S(15 ms/µm2,0) images were acquired per b-value. Other parameters were TR/TE = 3000/51 ms, EPI bandwidth = 400 kHz (single shot, no partial FT), FOV = 18×10 mm2, in-plane resolution 180×180 µm2, slice thickness 0.7 mm (3 slices), and 16 averages.
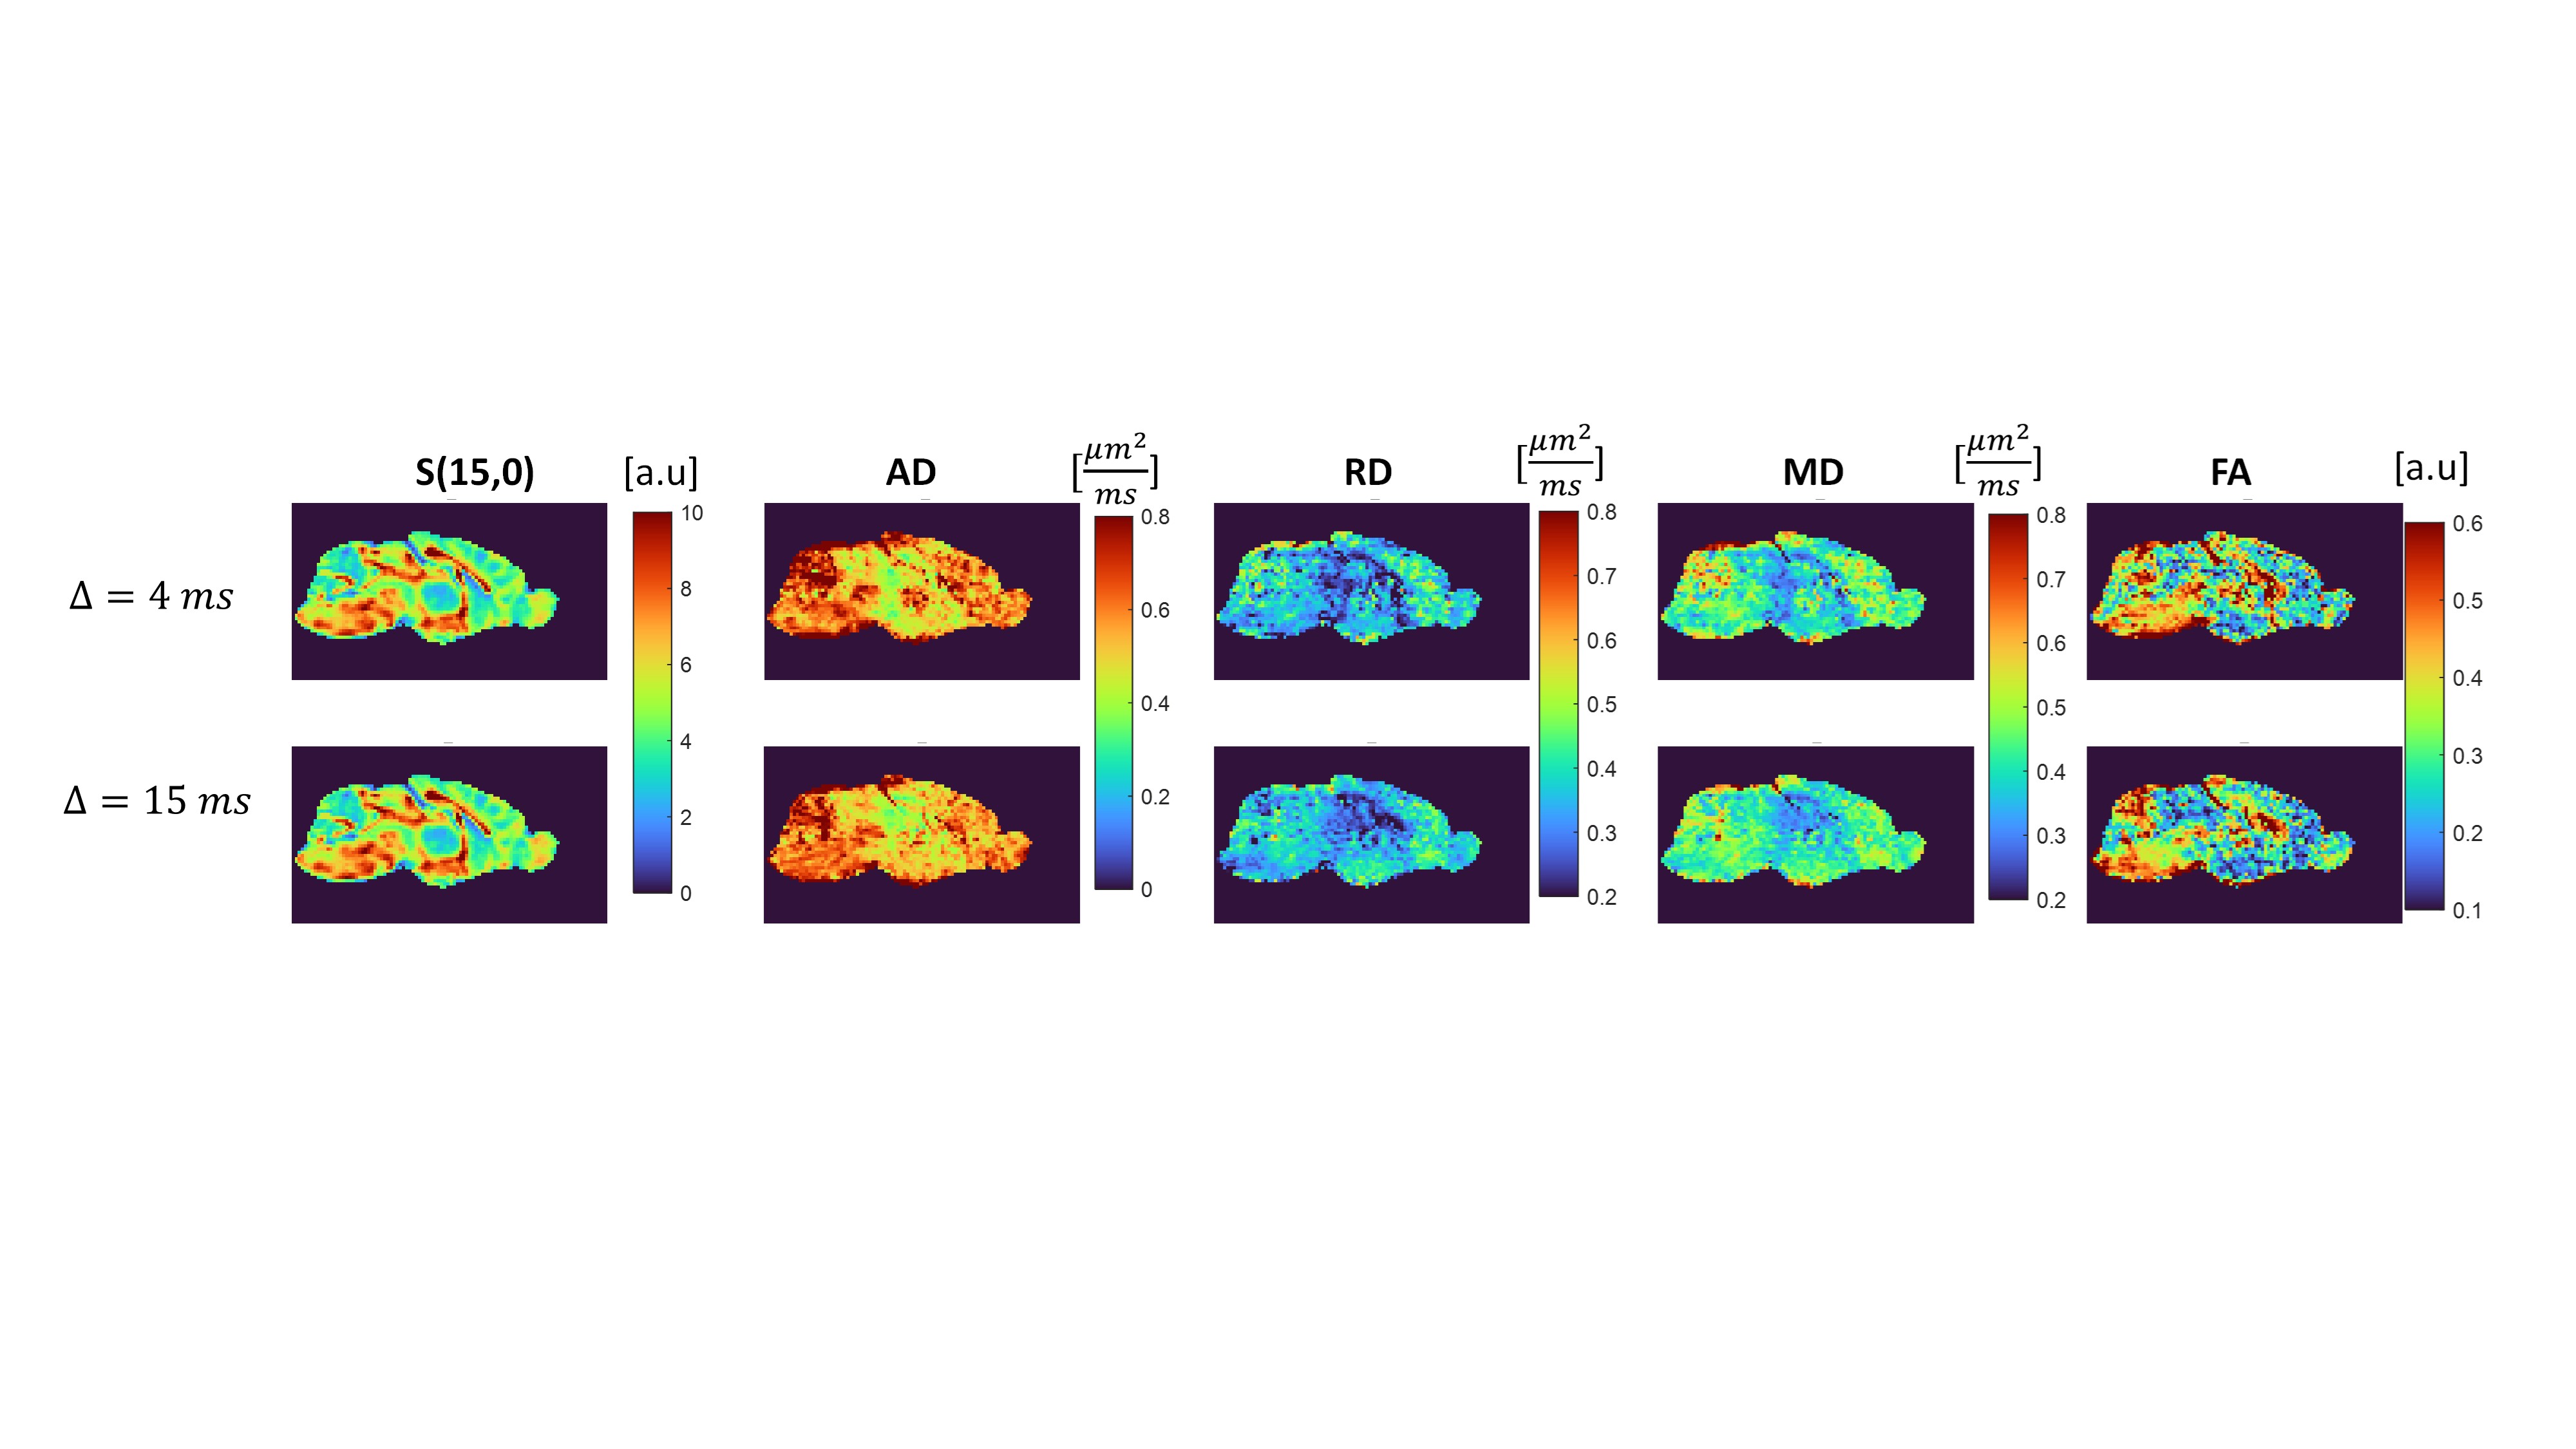
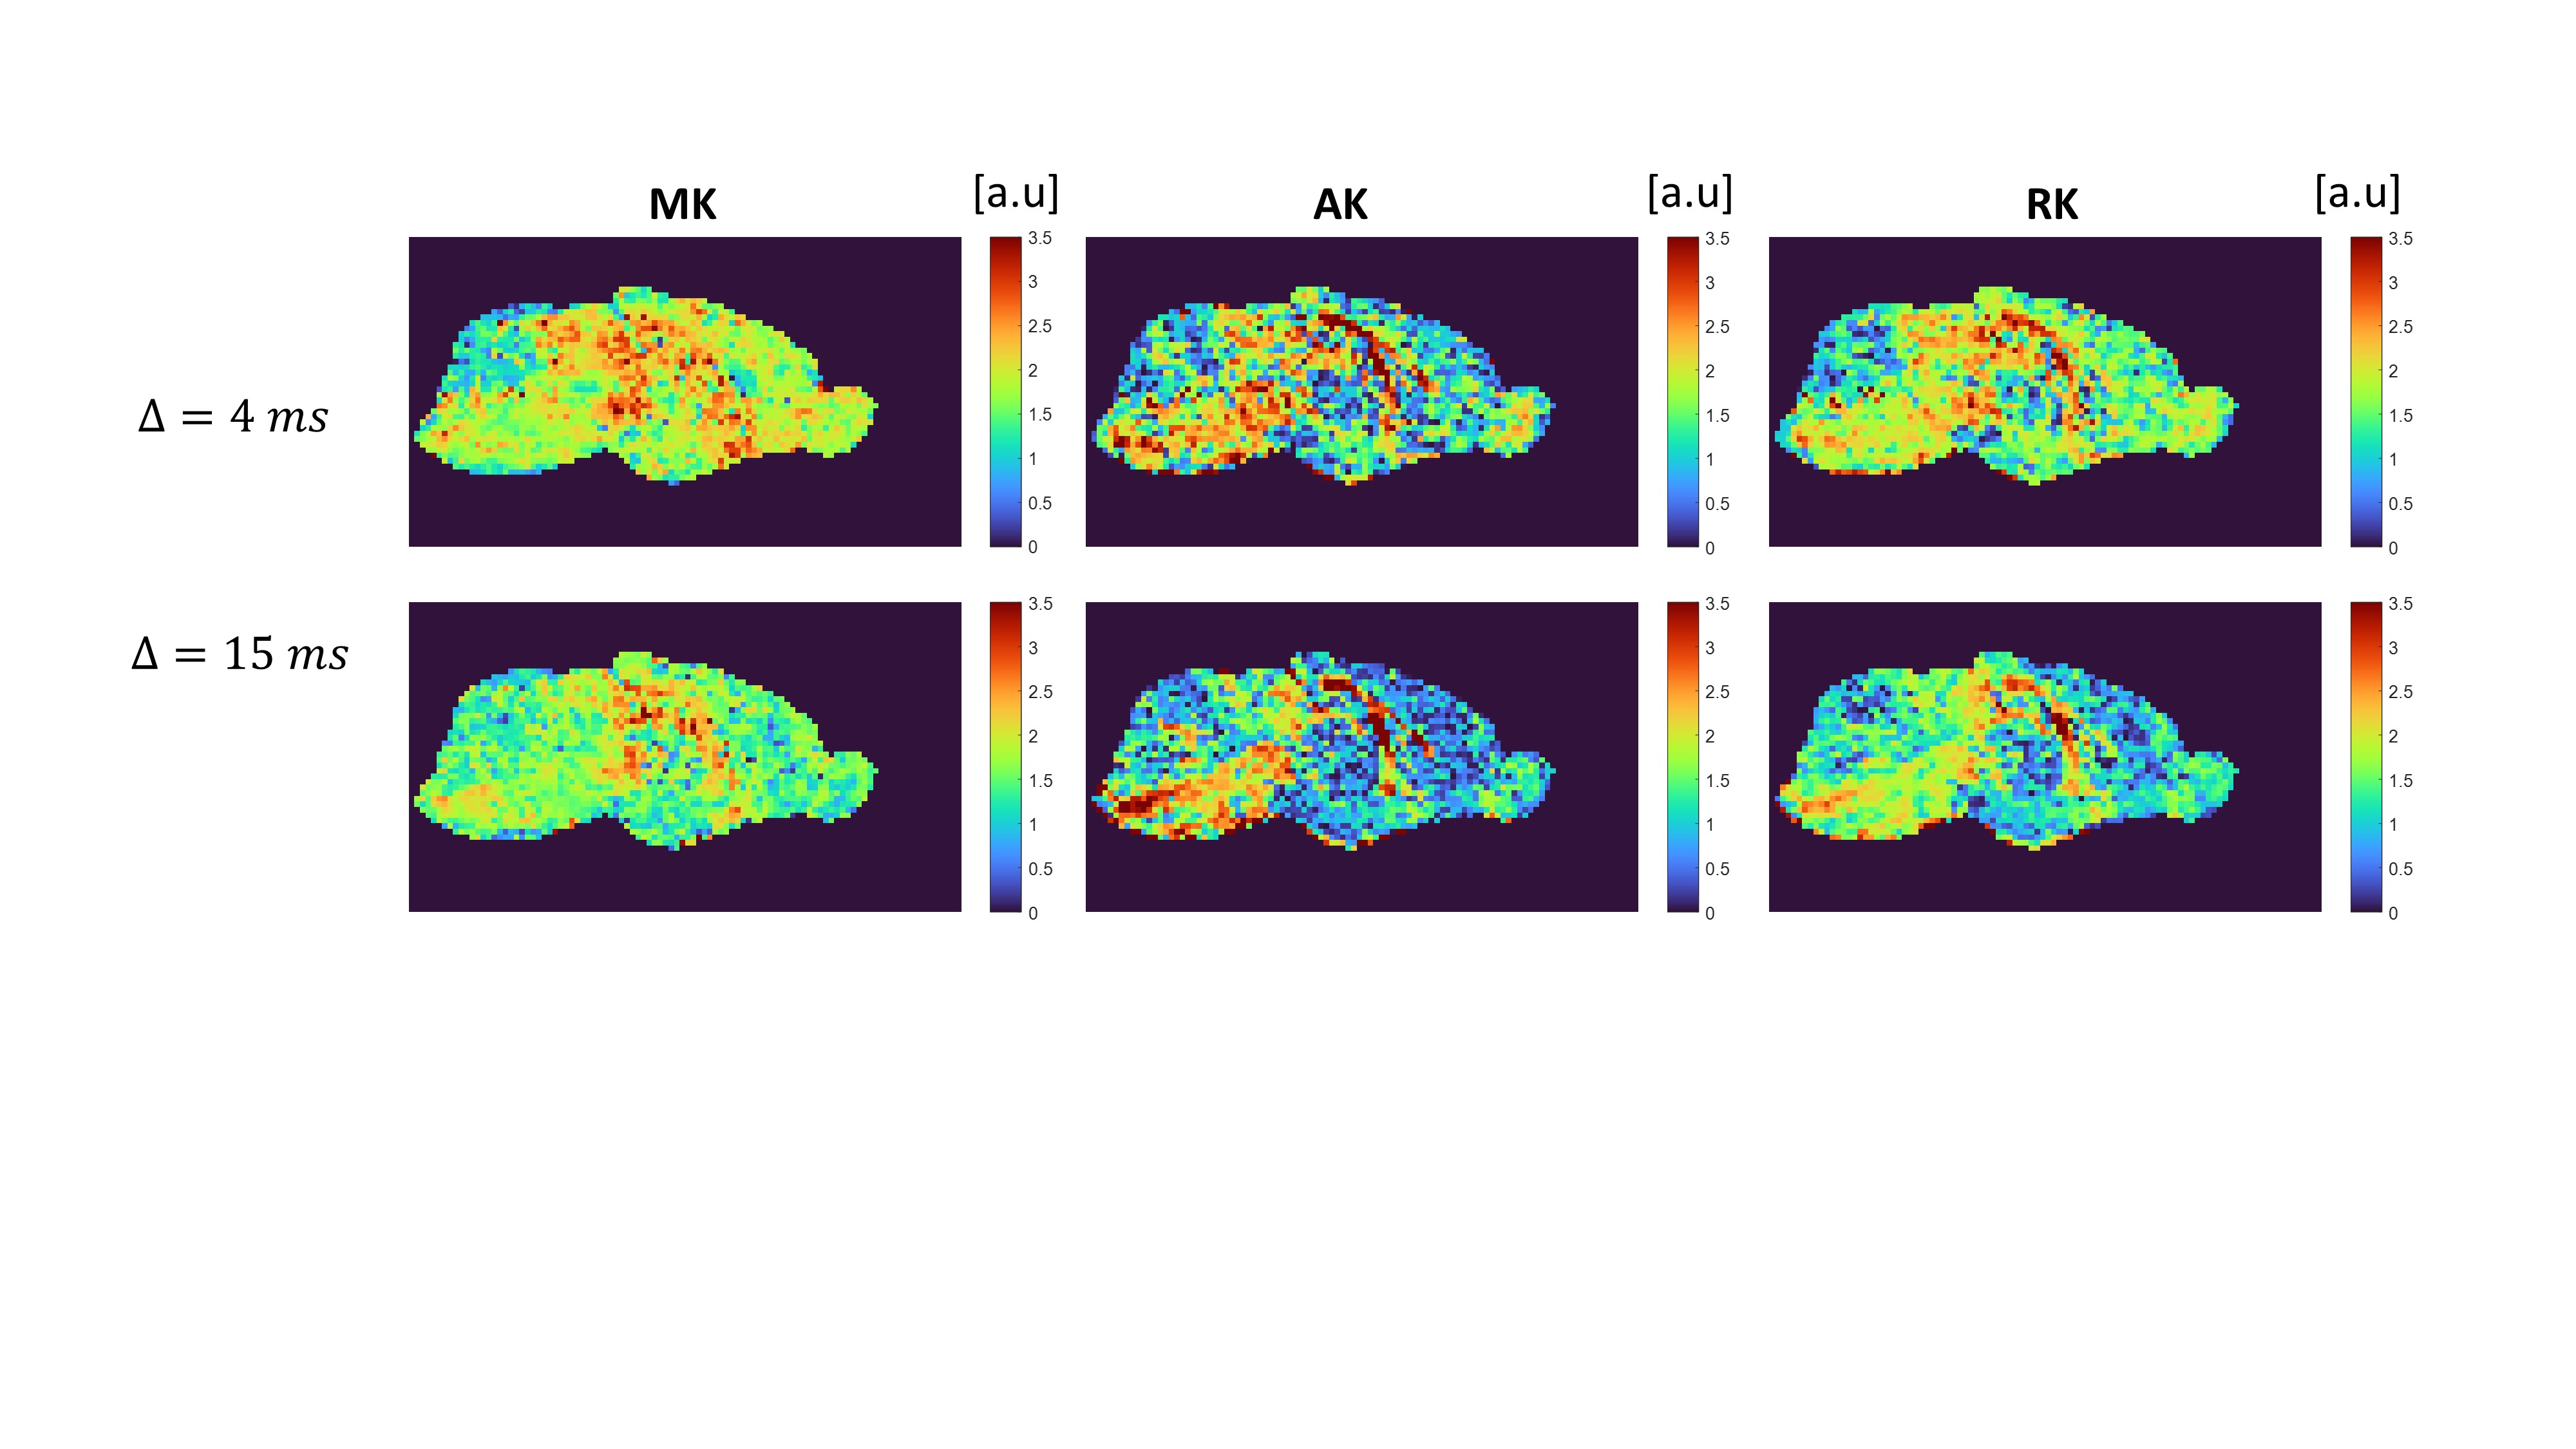
Data Analysis: Pre-processing included MP-PCA denoising21, ghost correction22, phase-unwrapping and extraction of real(data)23, and Gibbs unringing24. The pre-processed data were then fit to a simple DKI model25 yielding mean, axial and radial diffusivities (MD, AD, and RD, respectively), and mean, axial and radial kurtosis (MK, AK, and RK, respectively).
Results
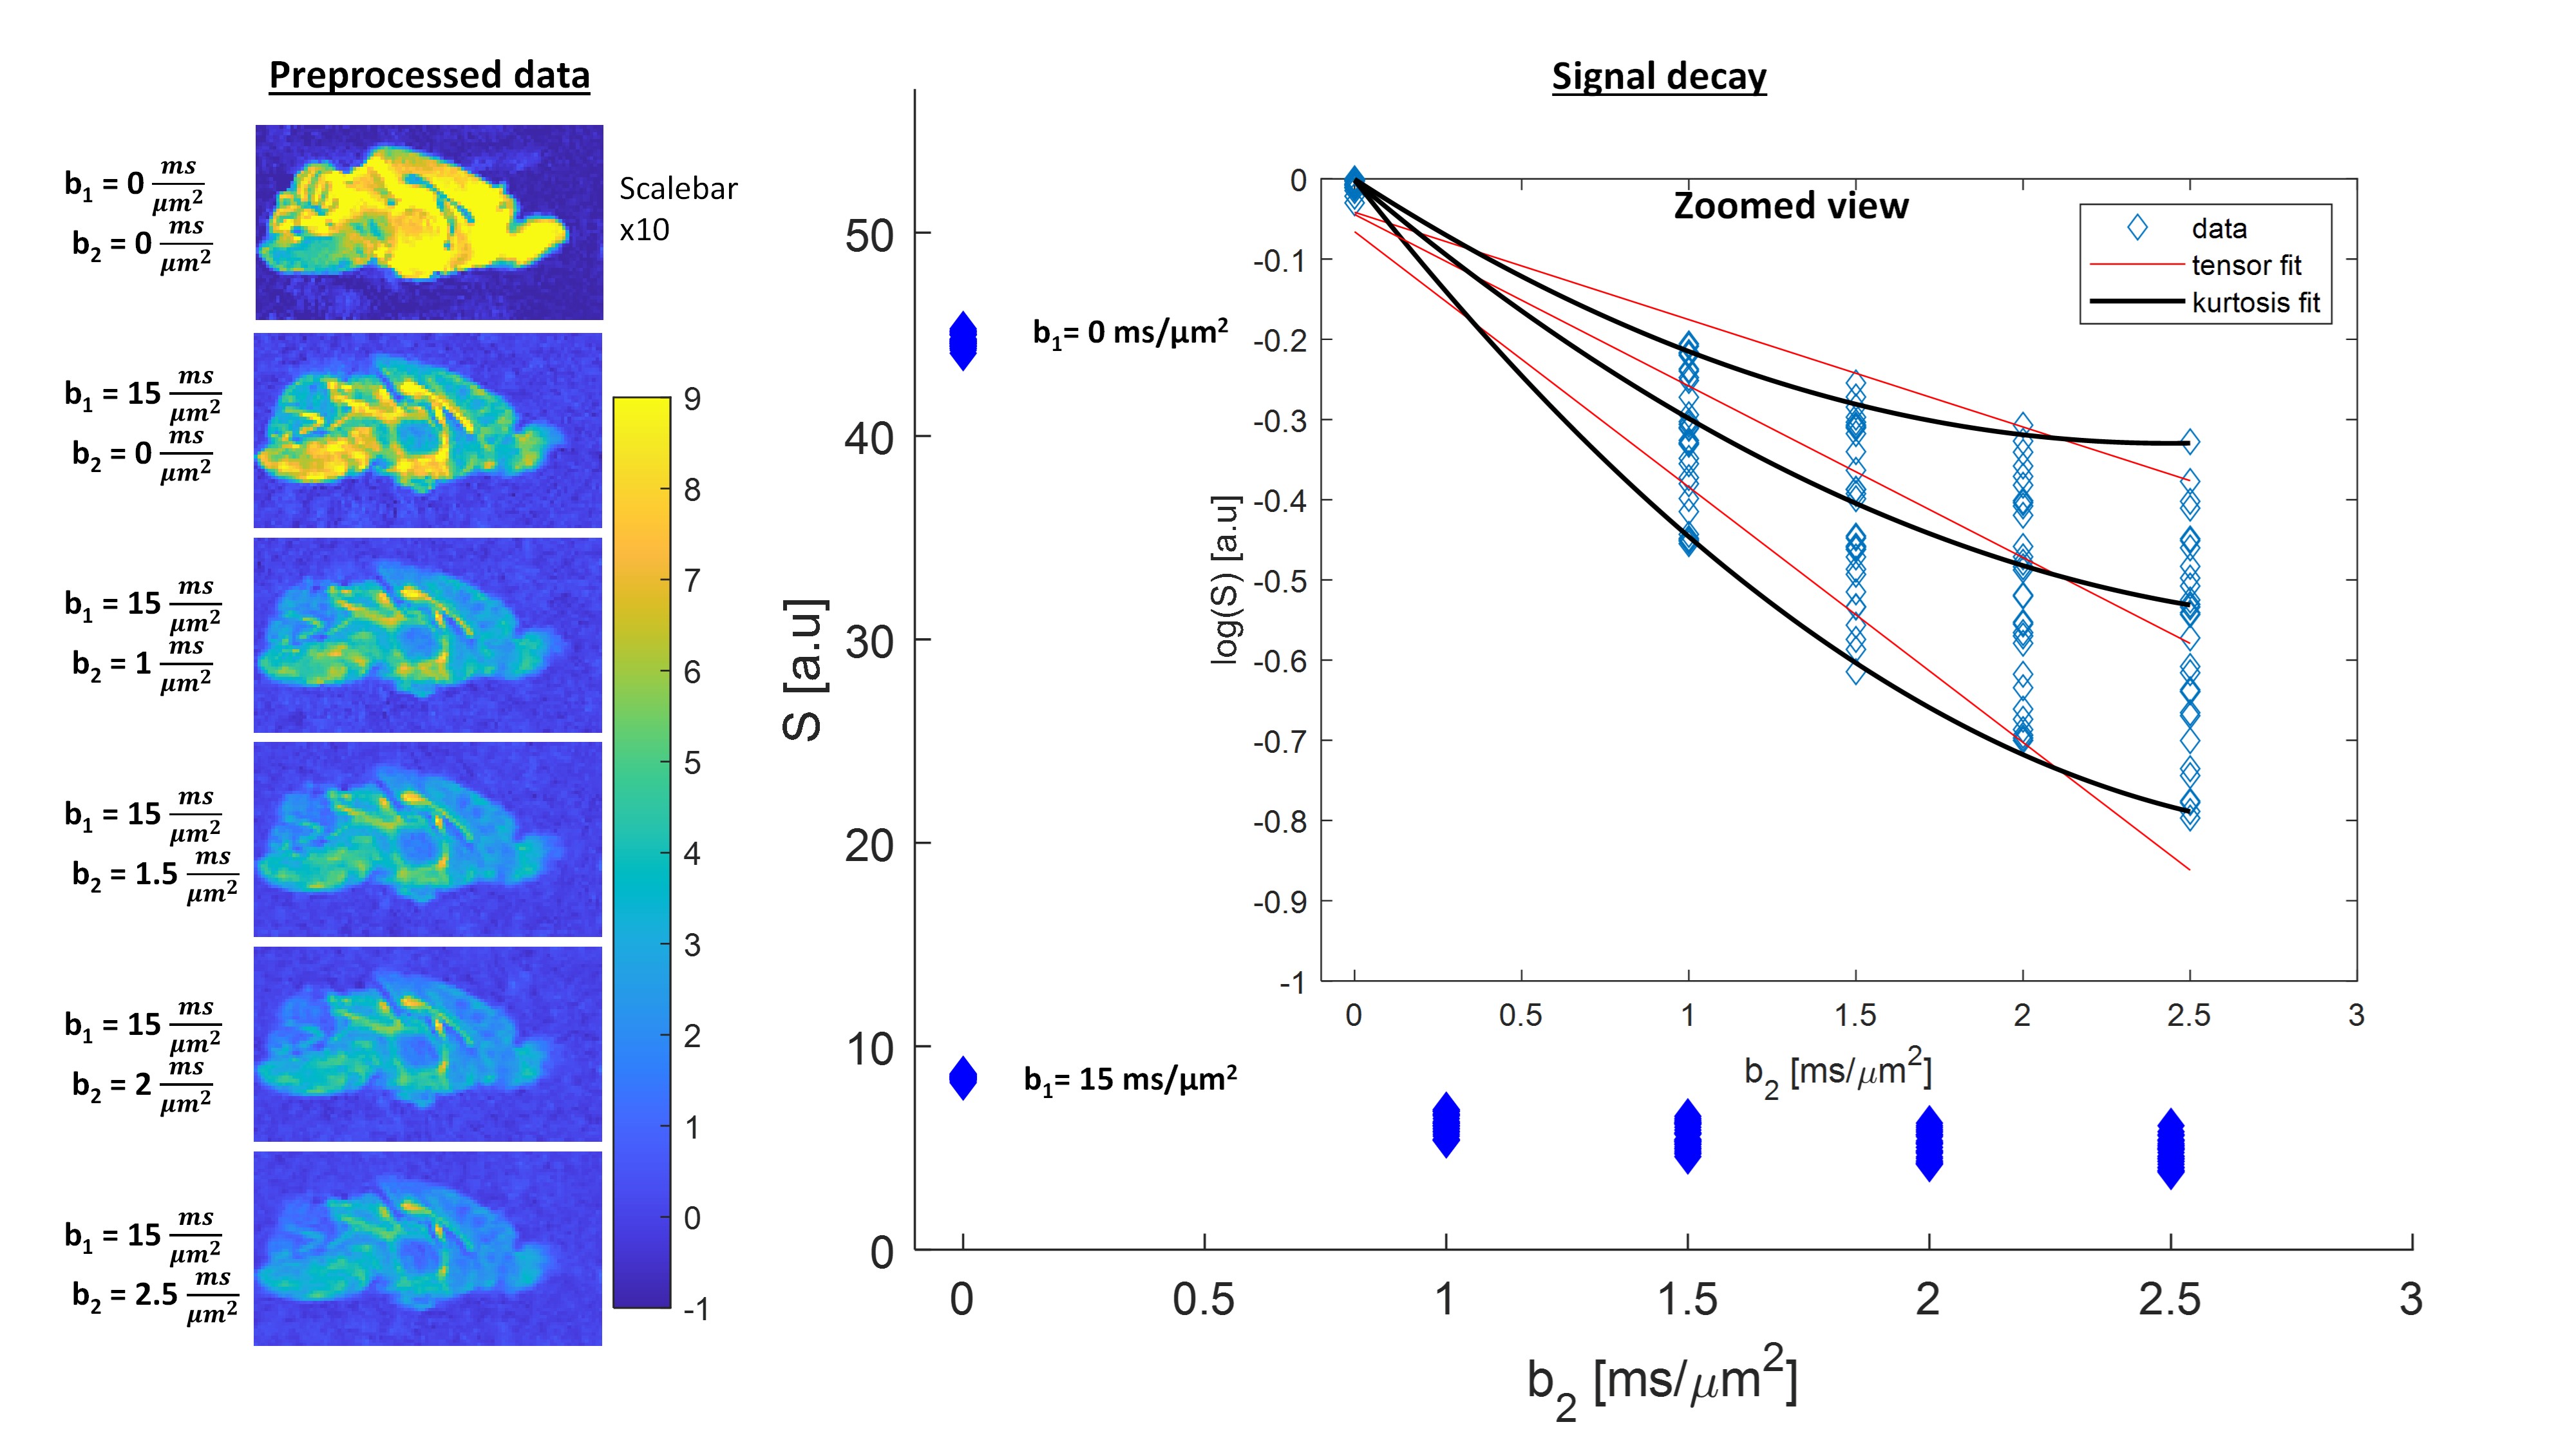
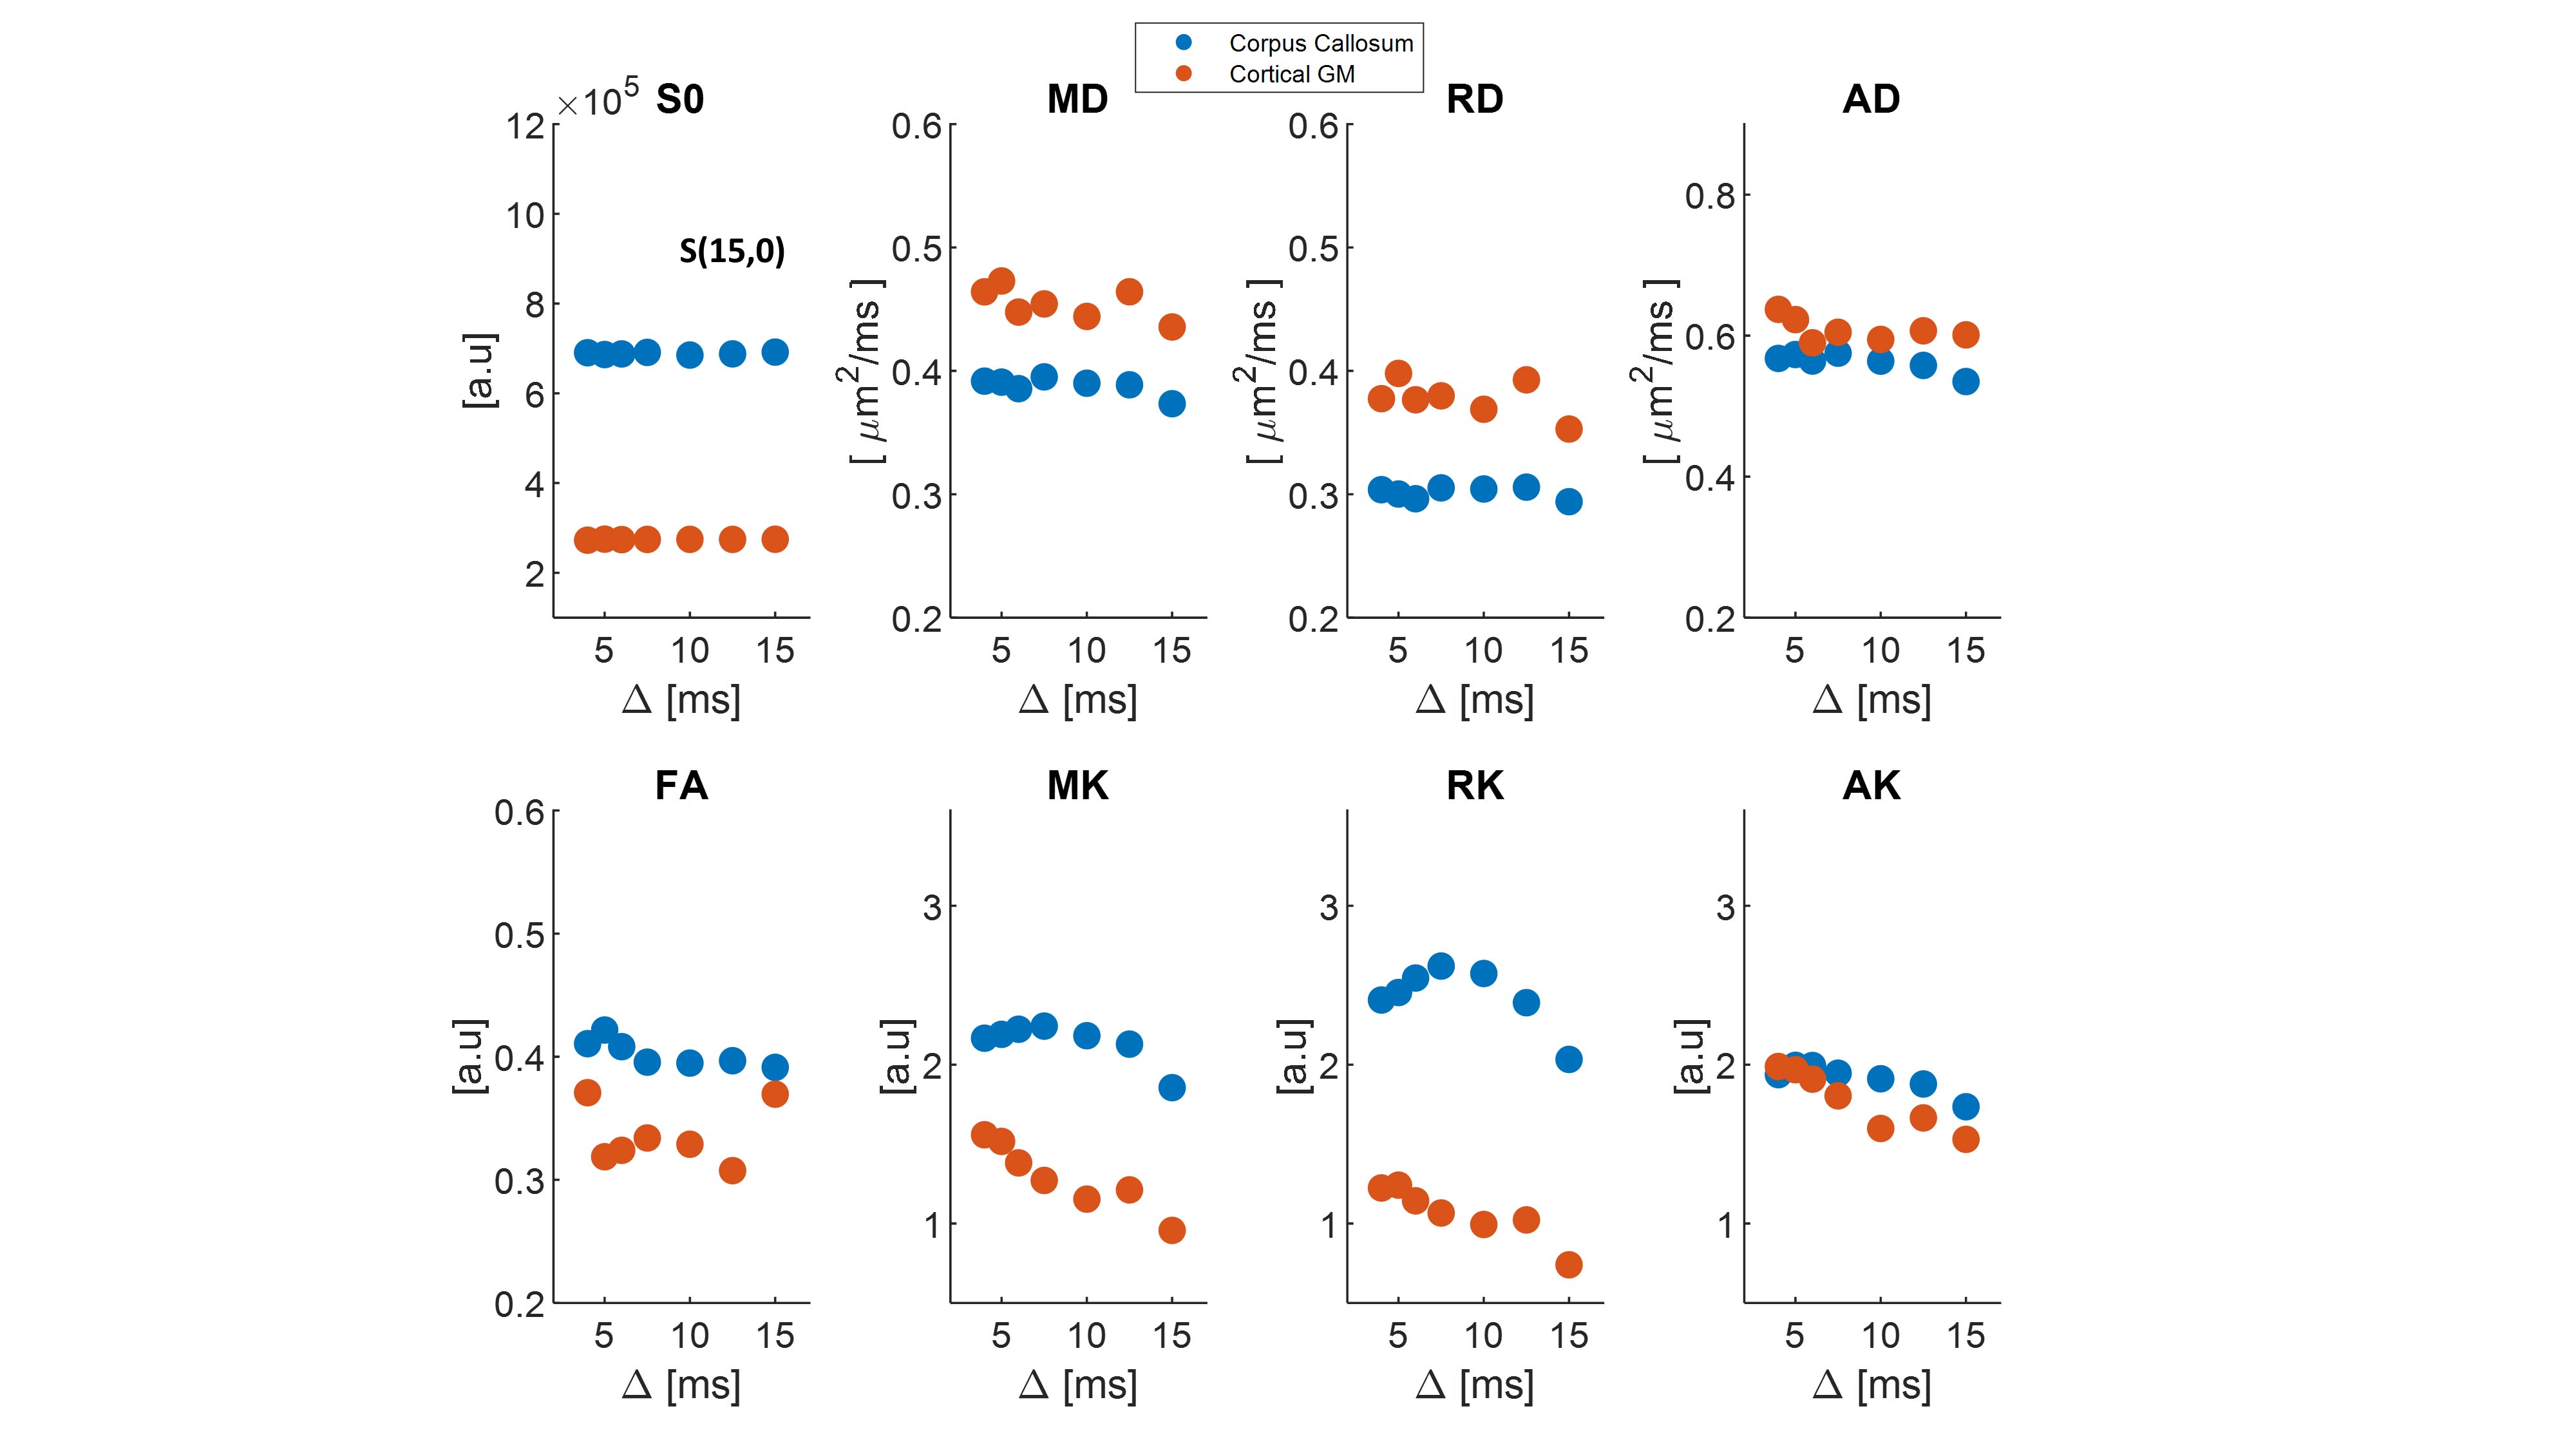
We first examine the quality of the data after imparting a very strong filter of b1=15 ms/µm2. Figure 2 shows the preprocessed data with S(0,0) (Fig. 2A), and filtered data S(b1=15 ms/µm2, b2) b2 = 0-2.5 ms/µm2 (Fig. 2B). The scalebar of Fig. 2A is x10 of 2B. Images are of sufficient quality for analysis even when strong diffusion filtering was applied. The median signal to noise ratios for S(0,0) and S(15,0) images were 126 and 37 respectively. Fig. 2C shows the entire decay curve, including the 5-fold attenuation due to the filter; the inset zooms onto the decay of the filtered data only S(b1=15 ms/µm2, b2), evidencing a high quality non-gaussian signal decay.Individual filtered maps for the two extreme diffusion time regimes (4 ms and 15 ms) are shown in Fig. 3 and Fig. 4, the former for diffusion tensor properties (and S(15,0)) and the latter for the kurtosis parameters, respectively. Fig. 5 shows the time dependence in ROIs comprising corpus callosum and cortical gray matter. Notice the non-monotonic RK, which likely reflects restriction in WM.
Discussion
The filtered DKI(t) sequence effectively suppresses signals from components with higher diffusivity, presumably extracellular15,17 in general and extra-axonal in WM. Thereby, diffusion of intracellular components can be probed with higher specificity. The striking RK(t) curve in corpus callosum suggests that given the radial diffusivity and the time to peak, the restricted component diffuses a characteristic length scale of lc = ~2.1 µm (calculated from the Einstein equation). This observation is consistent with the apparent early decrease in RD(t), but not with its behaviour at later times, perhaps due to microscopic orientation dispersion effects (e.g., undulation along the fiber). Notably, the calculated correlation length is larger than typical axonal diameters in mouse corpus callosum (~1 µm), suggesting that the time-dependence arises from signal in the larger axons18 and consistent with recent findings of microscopic kurtosis in Correlation Tensor MRI26,27. Our findings thus suggest that intra-cellular water components experience restricted diffusion, as also shown by experiments probing the time-dependent diffusion coefficient of intracellular metabolites28.Conclusions
The intra-axonal component (at least in mouse corpus callosum ex-vivo) exhibits time-dependent restricted diffusion. These filter-DKI(t) experiments shed light into the basic diffusion properties in the brain and enhance dMRI’s specificity.Acknowledgements
This work was supported in part by “la Caixa” Foundation (ID 100010434) and European Union’s Horizon 2020 research and innovation programme under the Marie Skłodowska-Curie grant agreement No. 847648, fellowship code CF/BQ/PI20/11760029.References
1. Le Bihan, D. Looking into the functional architecture of the brain with diffusion MRI. Nat. Rev. Neurosci. 4, 469–480 (2003).
2. Novikov, D. S., Fieremans, E., Jespersen, S. N. & Kiselev, V. G. Quantifying brain microstructure with diffusion MRI: Theory and parameter estimation. NMR Biomed. 32, e3998 (2019).
3. Budde, M. D. & Frank, J. A. Neurite beading is suf fi cient to decrease the apparent diffusion coef fi cient after ischemic stroke. (2010) doi:10.1073/pnas.1004841107/-/DCSupplemental.www.pnas.org/cgi/doi/10.1073/pnas.1004841107.
4. Sampaio-Baptista, C. & Johansen-Berg, H. White Matter Plasticity in the Adult Brain. Neuron 96, 1239–1251 (2017).
5. Rudrapatna, S. U. et al. Can diffusion kurtosis imaging improve the sensitivity and specificity of detecting microstructural alterations in brain tissue chronically after experimental stroke? Comparisons with diffusion tensor imaging and histology. Neuroimage 97, 363–373 (2014).
6. Fieremans, E. et al. In vivo observation and biophysical interpretation of time-dependent diffusion in human white matter. Neuroimage 129, 414–427 (2016).
7. Lee, H. H., Papaioannou, A., Kim, S. L., Novikov, D. S. & Fieremans, E. A time-dependent diffusion MRI signature of axon caliber variations and beading. Commun. Biol. 3, (2020).
8. Aggarwal, M., Smith, M. D. & Calabresi, P. A. Diffusion-time dependence of diffusional kurtosis in the mouse brain. Magn. Reson. Med. 84, 1564–1578 (2020).
9. Latour, L. L., Svoboda, K., Mitra, P. P. & Sotak, C. H. Time-dependent diffusion of water in a biological model system. Proc. Natl. Acad. Sci. 91, 1229–1233 (1994).
10. Mitra, P. P., Sen, P. N. & Schwartz, L. M. Short-time behavior of the diffusion coefficient as a geometrical probe of porous media. Phys. Rev. B 47, 8565–8574 (1993).
11. Reynaud, O. Time-Dependent Diffusion MRI in Cancer: Tissue Modeling and Applications. Front. Phys. 5, 1–16 (2017).
12. Novikov, D. S., Kiselev, V. G. & Jespersen, S. N. On modeling. Magn. Reson. Med. 79, 3172–3193 (2018).
13. Lasič, S., Nilsson, M., Lätt, J., Ståhlberg, F. & Topgaard, D. Apparent exchange rate mapping with diffusion MRI. Magn. Reson. Med. 66, 356–365 (2011).
14. Lampinen, B. et al. Optimal experimental design for filter exchange imaging: Apparent exchange rate measurements in the healthy brain and in intracranial tumors. Magn. Reson. Med. 77, 1104–1114 (2017).
15. Dhital, B., Reisert, M., Kellner, E. & Kiselev, V. G. Intra-axonal diffusivity in brain white matter. Neuroimage 189, 543–550 (2019).
16. Skinner, N. P., Kurpad, S. N., Schmit, B. D., Tugan Muftuler, L. & Budde, M. D. Rapid in vivo detection of rat spinal cord injury with double-diffusion-encoded magnetic resonance spectroscopy. Magn. Reson. Med. 77, 1639–1649 (2017).
17. Jensen, J. H. & Helpern, J. A. Characterizing intra-axonal water diffusion with direction-averaged triple diffusion encoding MRI. NMR Biomed. 31, 1–11 (2018).
18. Veraart, J. et al. Noninvasive quantification of axon radii using diffusion MRI. Elife 9, (2020).
19. Mitra, P. P. Multiple wave-vector extensions of the NMR pulsed-field-gradient spin-echo diffusion measurement. Physical Review B vol. 51 15074–15078 (1995).
20. Shemesh, N. et al. Conventions and nomenclature for double diffusion encoding NMR and MRI. Magn. Reson. Med. 75, 82–87 (2016).
21. Veraart, J. et al. Denoising of diffusion MRI using random matrix theory. Neuroimage 142, 394–406 (2016).
22. Hennel, F. Image-Based Reduction of Artifacts in Multishot Echo-Planar Imaging. J. Magn. Reson. 134, 206–213 (1998).
23. Eichner, C. et al. Real diffusion-weighted MRI enabling true signal averaging and increased diffusion contrast. Neuroimage 122, 373–384 (2015).
24. Kellner, E., Dhital, B., Kiselev, V. G. & Reisert, M. Gibbs-ringing artifact removal based on local subvoxel-shifts. Magn. Reson. Med. 76, 1574–1581 (2016).
25. Jensen, J. H. & Helpern, J. A. MRI quantification of non-Gaussian water diffusion by kurtosis analysis y. 698–710 (2010) doi:10.1002/nbm.1518.
26. Henriques, R. N., Jespersen, S. N. & Shemesh, N. Evidence for microscopic kurtosis in neural tissue revealed by correlation tensor MRI. Magn. Reson. Med. 3111–3130 (2021) doi:10.1002/mrm.28938.
27. Henriques, R. N., Jespersen, S. N. & Shemesh, N. Correlation Tensor Magnetic Resonance Imaging. arXiv (2019).
28. Palombo, M. et al. New paradigm to assess brain cell morphology by diffusion-weighted MR spectroscopy in vivo. Proc. Natl. Acad. Sci. 113, 201504327 (2016).
Figures