2426
Free Water Imaging in a Pig Model of Traumatic Brain Injury1DiCIPHR (Diffusion and Connectomics in Precision Healthcare Research) Lab, University of Pennsylvania, Philadelphia, PA, United States, 2Department of Neurosurgery, Perelman School of Medicine, University of Pennsylvania, Philadelphia, PA, United States, 3Center for Neurotrauma, Neurodegeneration & Restoration, Corporal Michael J. Crescenz VA Medical Center, Philadelphia, PA, United States
Synopsis
The way brain injury can evolve has different manifestations on imaging in multiple MRI modalities, pointing to different pathological etiologies. The true picture can be seen only by correcting for free water, as it biases all the diffusion measurements, especially the longitudinal outcome. While this has been observed in humans, it is for the first time free water analysis has been carried out in a gyrencephalic pig model of TBI. In the future, co-registration with histopathological outcomes will be undertaken to verify the specificity of the diffusion measurements, which will lay the foundation for interpretation of unbiased diffusion measurements.
Introduction
Traumatic brain injury (TBI) is a major health problem affecting millions of people worldwide each year. TBI can result in diffuse axonal injury (DAI), changes to neuronal membranes, and blood-brain barrier permeability, among other secondary effects, which in some cases can persist chronically. Complex neuropathologies have been demonstrated in the acute phase following TBI in pigs1, which are of special interest in TBI research because of their gyrencephalic structure and complex white matter (WM) architecture, more similar to humans than rodents. TBI can lead to accumulation of free water (FW) in brain tissue, including but not limited to cerebral edema, which can be quantified using diffusion tensor imaging (DTI). Free water elimination is a method in diffusion tensor imaging (DTI) that can measure the extracellular water in a voxel, producing estimates of free water volume fraction (VF), and free-water-corrected diffusion indices including fractional anisotropy (FA), radial diffusivity (RD), and axial diffusivity (AD). While standard FA is commonly used as a measure of WM architectural coherence and integrity, it is known to be sensitive to the presence of extracellular water (as we showed in humans2), where it is reduced in the presence of edema and inflammation. Free-water-corrected indices, on the other hand, provide estimates of FA, RD and AD that are more specific to alterations in WM, by compartmentalizing the diffusion signal into extracellular FW and restricted and hindered water compartments. Recently, VF was demonstrated to be significantly and chronically elevated in moderate-to-severe TBI in humans evaluated 3, 6, and 12 months after injury3. The study of VF and free-water-corrected diffusion indices in pigs temporally following injury may help provide mechanistic insight into the progression of moderate-to-severe TBI from the acute to the chronic phase.Methods
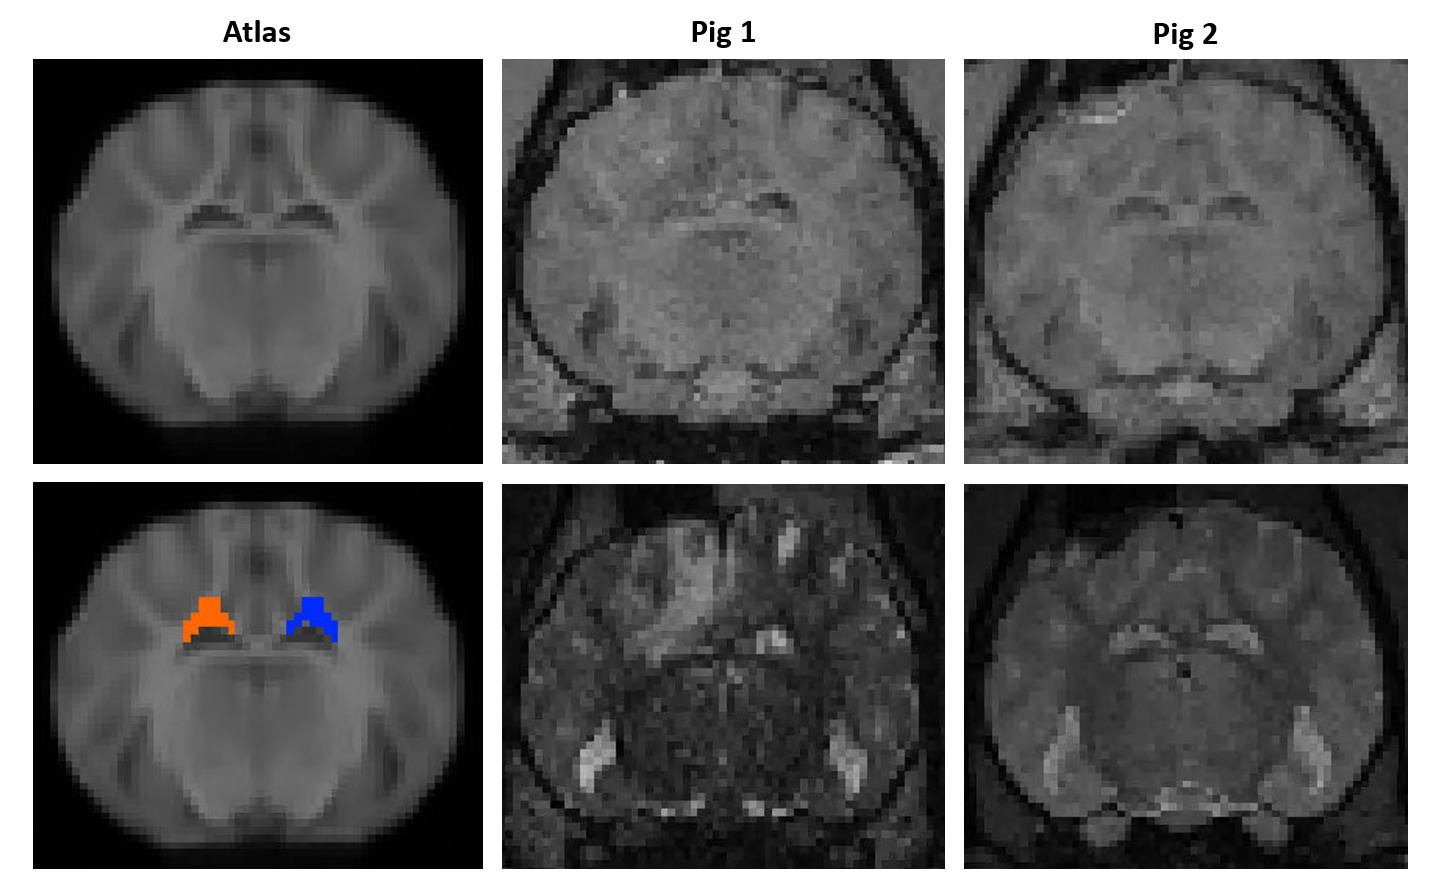
T1-weighted images, T2-weighted images, and DTI were acquired on 2 Yucatan mini-pigs before injury, as well as 3 days, 1 month, 3 months and 6 months after injury. The 3-month timepoint for the first pig was not acquired due to the COVID-19 pandemic, and the 6-month timepoint for the second pig had not been acquired at the time of this writing. A controlled cortical impact (CCI) model of injury was performed unilaterally in the parietal cortex. The diffusion MRI scan consisted of 8 b0 images and 64 directions at b=1000 s/mm2 with LR phase encoding direction and a subsequent scan of 7 b0 images with RL phase encoding direction. DTI data were processed with FSL’s topup (warpres and fwhm parameters were halved due to smaller voxel size of pig data vs human data), and eddy to correct for EPI distortions. Tensors were fit to the data and free water correction was applied with FERNET4. Trace (TR) maps were rigidly aligned to the T1 image with ITK-SNAP5. After manually initializing with a rigid registration in ITK-SNAP, T1 images were deformably registered to the Yucatan minipig atlas6 with ANTs SyN registration7. Regions of interest (ROIs) were manually drawn on 5 consecutive coronal slices of the template, in the WM of the corona radiata underlying the injury site after registration, and on the same slices in the contralateral hemisphere (Figure 1). Mean and standard deviation values of FA, TR, AD, RD, free-water-corrected FA (fwFA), AD (fwAD), RD (fwRD), and VF were calculated at each timepoint in each ROI, and assessed longitudinally.Results
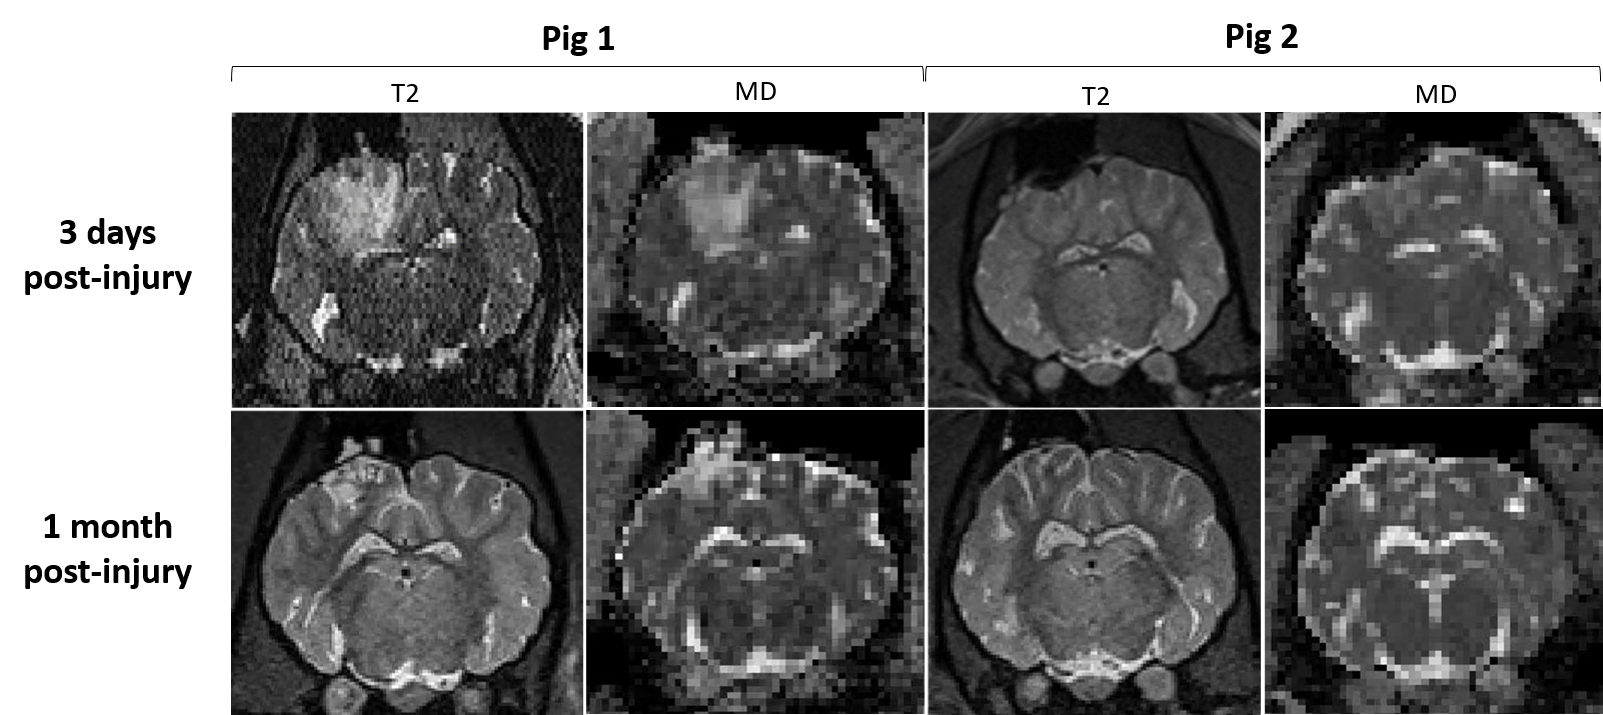
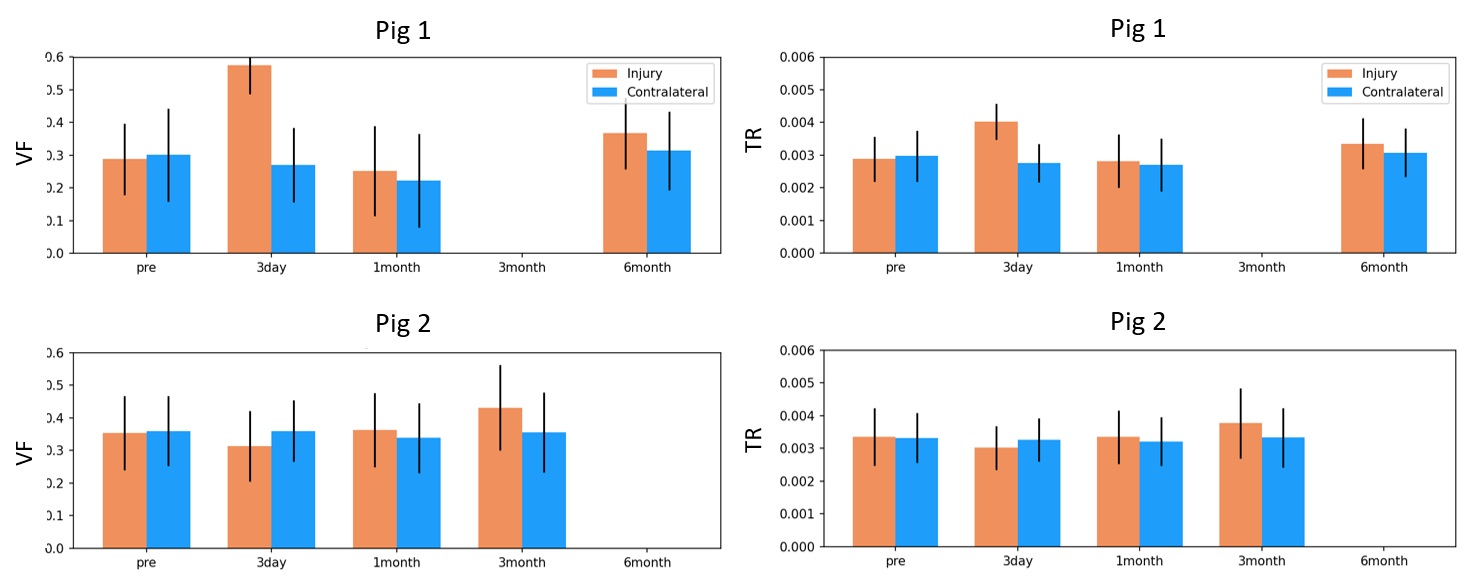
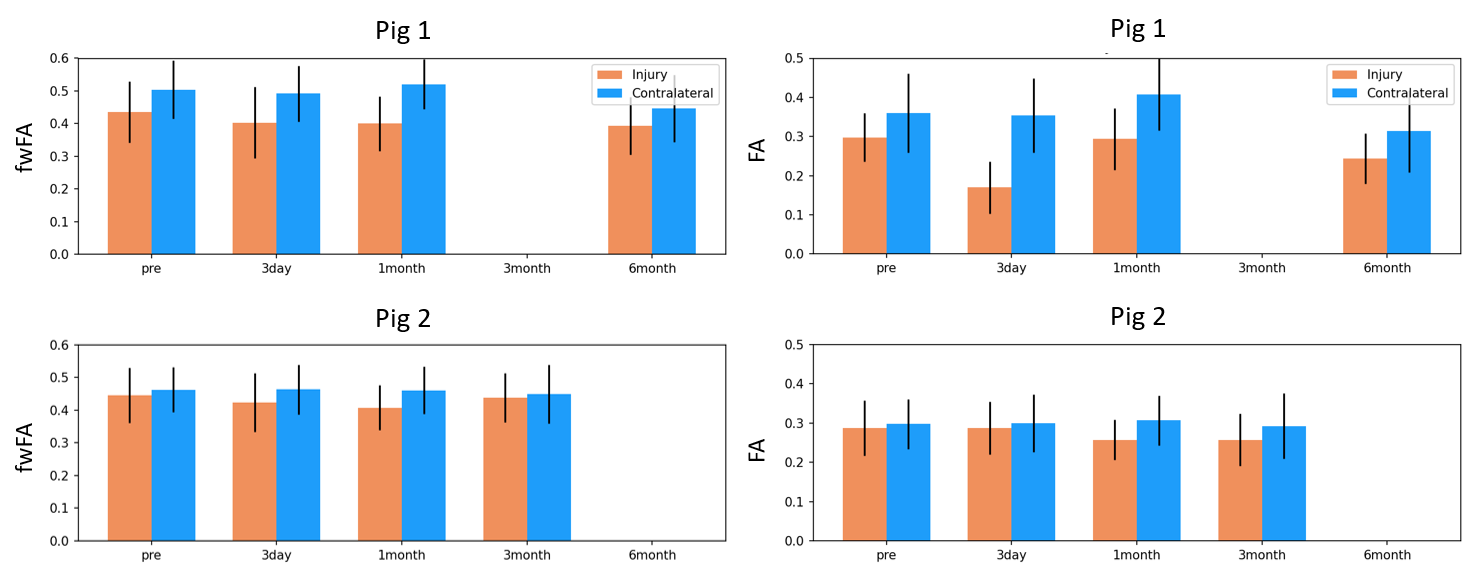
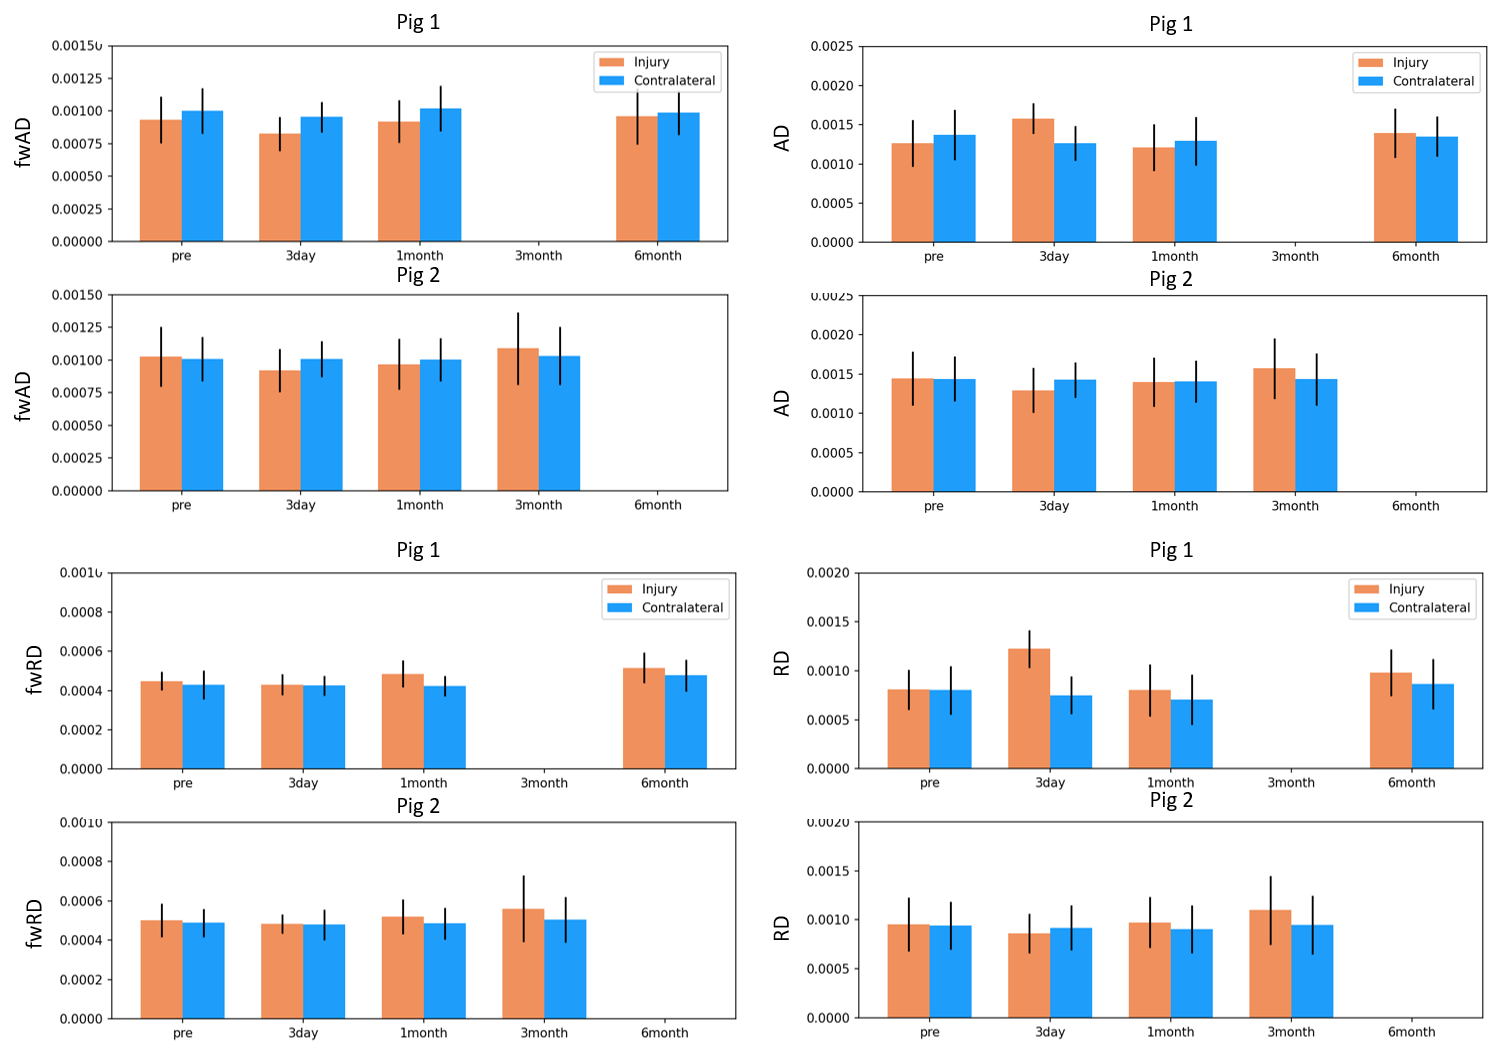
The two pigs demonstrated divergent patterns of edema in the acute phase (3 days post-injury). The first pig demonstrated considerable edema, visible as hyperintense T2 and TR (Figure 2), while the second pig demonstrated less edema, where T2 and TR hyperintensity were not as extensive. Mean values of each measure did not change in the contralateral region relative to the baseline scan over the time period. In the first pig, which demonstrated more edema in the acute period, TR and VF were elevated 3 days after injury in the injury ROI, while this pattern was not seen in the second pig (Figure 3). Correspondingly, FA was decreased in the first pig at 3 days post-injury which was not observed in the second pig. fwFA, however, showed a consistent pattern of slight decrease after injury, relative to the contralateral ROI in both pigs (Figure 4). AD and RD were both elevated 3 days post-injury in the first pig, which was not seen in the second pig (Figure 5). In both pigs, fwAD displayed a pattern of modest decrease 3 days post-injury and then an increase chronically, similar to fwFA, and fwRD remained relatively constant 3 days post-injury in both pigs, with a modest increase in fwRD observed at the chronic timepoints more than 1 month after injury.Conclusion
Our results demonstrate the importance of free water correction in investigations of inflammatory disease following TBI. The sharp decrease in FA in the first pig with substantial edema, which was not observed in the second pig with less edema, suggests that this FA measurement was sensitive to the presence of extracellular water. fwFA is a more appropriate measure of TBI-induced changes in WM because it is less sensitive to extracellular processes. Taken together with similar patterns observed in human studies3, our results show the importance of free water correction in TBI studies.Acknowledgements
This research was supported by Department of Defense (DOD) grants W81XWH-20-1-0838 and W81XWH-20-1-0901, and National Institutes of Health (NIH) grant 5R01NS096606-05.
References
1. Lafrenaye, Audrey D et al. “Microglia processes associate with diffusely injured axons following mild traumatic brain injury in the micro pig.” Journal of Neuroinflammation vol. 12 186. 6 Oct. 2015, doi:10.1186/s12974-015-0405-6
2. Vijayakumari, Anupa Ambili et al. “Free Water Volume Fraction: An Imaging Biomarker to Characterize Moderate-to-Severe Traumatic Brain Injury.” Journal of Neurotrauma vol. 38,19 (2021): 2698-2705. doi:10.1089/neu.2021.0057
3. Alappatt, Jacob et al. “Free water elimination is necessary to characterize Diffuse Axonal Injury in moderate Traumatic Brain Injury.” ISMRM, 2019.
4. Parker, Drew et al. “Freewater estimatoR using iNtErpolated iniTialization (FERNET): Characterizing peritumoral edema using clinically feasible diffusion MRI data.” PloS one vol. 15,5 e0233645. 29 May. 2020, doi:10.1371/journal.pone.0233645
5. Yushkevich, Paul A et al. “User-guided 3D active contour segmentation of anatomical structures: significantly improved efficiency and reliability.” NeuroImage vol. 31,3 (2006): 1116-28. doi:10.1016/j.neuroimage.2006.01.015
6. Chang, Stephano J et al. “In vivo Population Averaged Stereotaxic T2w MRI Brain Template for the Adult Yucatan Micropig.” Frontiers in neuroanatomy vol. 14 599701. 13 Nov. 2020, doi:10.3389/fnana.2020.599701
7. Avants, B B et al. “Symmetric diffeomorphic image registration with cross-correlation: evaluating automated labeling of elderly and neurodegenerative brain.” Medical image analysis vol. 12,1 (2008): 26-41. doi:10.1016/j.media.2007.06.004
Figures