2423
Considering whole body metabolism in hyperpolarized MRI – an alternative way to quantification and normalization?1MR Centeret, Klinisk Institut, AU, Århus C, Denmark, 2GE Healthcare, Munich, Germany
Synopsis
Hyperpolarized [1-13C]pyruvate MRI is an exciting emerging clinical tool for metabolic imaging. It has the potential for absolute quantitative metabolic imaging. However, in contrast to the most abundant metabolic imaging techniques, the signal itself is less quantitative by nature and, thus the most abundant analyses are relative or semiquantitative. Here, we propose a simple normalization to the whole body metabolic oxidative metabolism to overcome this limitation.
Introduction
Hyperpolarized [1-13C]pyruvate MRI is an emerging metabolic imaging diagnostic modality with clinical indications as changes in local metabolism following cancer or stroke [1, 2]. The pathway-specific nature of the method gives it the potential of becoming a routine clinical tool in metabolic imaging modality [1, 3].The method is hampered by metabolic variability either due to physiological variations – like feeding condition - or pathological differences such as diabetes [4, 5]. This is normally overcome by standardizing the condition prior to the examinations. This standardization risks masking potential basal metabolic conditions as well as increasing variance; as the intervention amplifies the initial conditional differences. This is in some cases undesirable. We propose a simple normalization of the ratio metric approach often used in hyperpolarized 13C MRI studies to whole-body metabolism assessed using a 13C-breath analyzer. Further, this normalization yields quantitative measures, which are often preferred over semi-quantitative or apparent values, as this simplifies interpretation and eases comparison across studies.
Methods
The method utilizes a commercially available clinical 13CO2 breath test analyzer to normalize the metabolic imaging data to the total body oxidative metabolism following intravenous injection of hyperpolarized [1-13C]pyruvate. The metabolite-to-pyruvate ratio is adjusted following the equation below, where WBpo is the whole body pyruvate oxidation, t is time, [13C] is 13C-content in breath, and [pyruvate] is the administered dose of [1-13C]pyruvate in mmol.(Kpx/WBpo)(mmol/min)=((13C5min-13C0min)/(t5min-t0min))*[Pyruvate]*(x/Pyr)
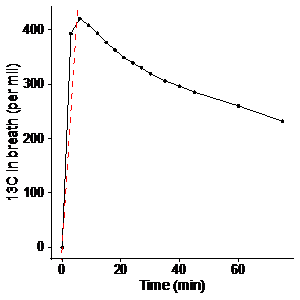
In a healthy pig, we measured the changes in exhaled 13C after administration of 625 mg of [1-13C]pyruvate, corresponding to the dose used for hyperpolarized imaging. Alveolar air was sampled from an endotracheal tube, and its 13C-content was measured using a commercial, infrared spectroscopy system (HeliFANplus, Fan, Germany). Based on these data (Figure 1), we measured the 13C-content of alveolar air at baseline and 5 minutes after MRI with hyperpolarized [1-13C]pyruvate in six pigs. These pigs were subjected to unilateral ischemia-reperfusion injury (IRI) of the kidney seven days prior. MRI with hyperpolarized [1-13C]pyruvate was performed using a metabolite-selective spiral sequence after injection of 625 mg of [1-13C]pyruvate polarized in a SPINlab system. The data were analyzed for the ratios of lactate, bicarbonate, and alanine to pyruvate, representing metabolic readouts. Using Pearson’s method, the ratios were correlated to the slope of a line representing the change in 13C in alveolar air during the imaging experiment. The slope and dose of pyruvate were used for adjustment of the imaging data to whole-body oxidative metabolism as detailed in the introduction. The coefficient of variation, was tested using Krishnamoorthy and Lee’s modified signed-likelihood ratio test [6].
Results
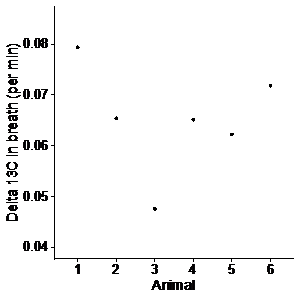
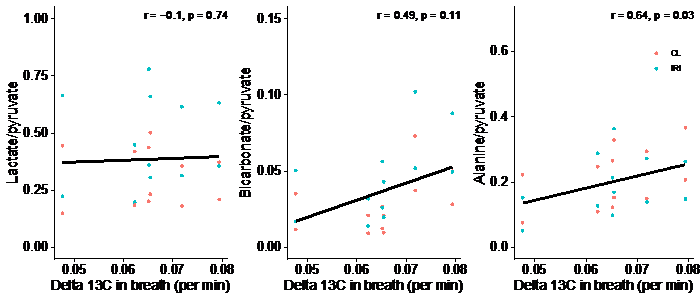
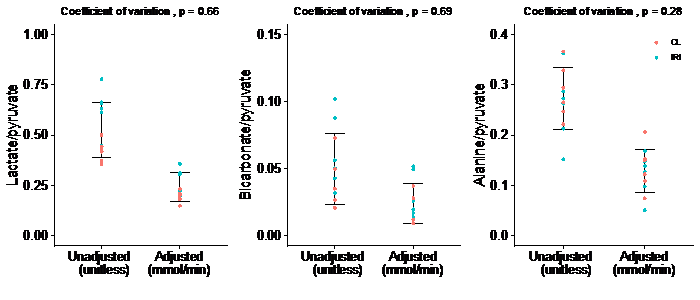
We found a rapid increase in 13C in alveolar air from 0 to 5 minutes followed by a gradual decrease. The slope of a line through the 5 min upstroke shows the mean exhalation rate of 13CO2 (permille/min), representing the rate of conversion of pyruvate to 13CO2, encompassing whole-body cellular pyruvate uptake and metabolism. We found considerable individual variation of 13C in alveolar air exhalation rates (Figure 2). 13C exhalation rates significantly correlated with the alanine-to-pyruvate ratio but showed no significant correlation to the bicarbonate-to-pyruvate ratio and the lactate-to-pyruvate ratio (Figure 3). With adjustment of the metabolic ratios to the 13C-content in alveolar air, we found that the lactate-to-pyruvate ratio changed from 0.53 (unitless) to 0.24 mmol/min, while the alanine-to-pyruvate changed from 0.27 (unitless) to 0.13 mmol/min, and the bicarbonate-to-pyruvate from 0.05 (unitless) to 0.02 mmol/min (Figure 4). Across all kidneys, the adjustment did not alter the relative standard deviation.Discussion
The combination of a clinical whole body oxidative metabolic measurement with hyperpolarized [1-13C]pyruvate MRI is feasible. We only found significant correlations between 13CO2 exhalation rates and 13C-alanine production. A p value of 0.11 in correlation between bicarbonate production and 13C exhalation suggests a potential true significant correlation within a larger sample size. This effect is likely driven by the relatively small contribution to oxidative metabolism of the kidneys.The adjustment of the metabolite-to-pyruvate ratios allowed us to give them units of mmol/min. This unit corresponds to the units used when describing enzymatic activities. However, the adjusted ratio presented here encompasses both cellular uptake and enzymatic conversions. While unification is the first step towards absolute quantification, the metabolite ratios are inherently dependent on timing and parameters of the prescribed scan, and this does not change with the proposed adjustment to whole-body metabolism.
The data show no significant reduction in the coefficient of variation in our cohort of 6 pigs. These animals are exposed to the same intervention and are therefore assumed to be similar in metabolic activity. This sparks the question: Can this correction method lead to a significant reduction of variation in animals with inhomogeneous metabolic activity such as different feeding states, diabetes or cardiovascular illness? This supports further studies in larger cohorts of animals and with varying metabolic conditions such as fasted and fed states.
Conclusion
This study suggests the potential for a simple and intuitive normalization of hyperpolarized 13C metabolic probes utilizing the rate of exhaled 13C from the lungs as a normalization factor. A larger cohort is, however, needed to confirm this potential.Acknowledgements
No acknowledgement found.References
1. James, T.G.e.a., Hyperpolarized 13C MRI: A novel approach for probing cerebral metabolism in health and neurological disease. Journal of Cerebral Blood Flow and Metabolism, 2020.
2. Qin H, Z.V., Bok RA, Santos RD, Cunha JA, Hsu I-C, Santos JD, Lee JE, Sukumar S, Larson PEZ, Vigneron DB, Wilson DM, Sriram R, Kurhanewicz J, Simultaneous metabolic and perfusion imaging using hyperpolarized 13C MRI can evaluate early and dose-dependent responses to radiotherapy in a prostate cancer mouse model. Internation Journal of Radiation and Oncology, 2020.
3. Kurhanewicz, J., et al., Hyperpolarized (13)C MRI: Path to Clinical Translation in Oncology. Neoplasia, 2019. 21(1): p. 1-16.
4. Laustsen, C., et al., Assessment of early diabetic renal changes with hyperpolarized [1-(13) C]pyruvate. Diabetes Metab Res Rev, 2013. 29(2): p. 125-9.
5. Tougaard, R.S., et al., Hyperpolarized [1-(13) C]pyruvate MRI can image the metabolic shift in cardiac metabolism between the fasted and fed state in a porcine model. Magn Reson Med, 2019. 81(4): p. 2655-2665.
6. Krishnamoorthy, K. and M. Lee, Improved tests for the equality of normal coefficients of variation. Computational Statistics, 2014. 29(1): p. 215-232.
Figures