2415
Brain morphometric discrepancies between cynomolgus and rhesus macaques1Functional Imaging Laboratory, German Primate Center, Göttingen, Germany, 2Georg-August-University Göttingen, Göttingen, Germany
Synopsis
Cynomolgus and rhesus macaques are widely used in biomedical research due to their physiological proximity to humans, and both are often referred to as macaques. However, the brain morphology of cynomolgus and rhesus macaques differs. Interestingly, as shown here by a Jacobian-determinant-based approach, the smaller cynomolgus brain is not only a scaled-down version of the rhesus macaques. For instance, the gray-to-white matter ratio differs significantly between the two species.
Introduction
Non-human primates (NHPs) are commonly used to enhance our understanding of human brain anatomy, circuitry, and functions. Here, NHPs have made a significant contribution to the advancement of our knowledge due to their physiological similarities to humans 1. In particular, cynomolgus macaques (Macaca fascicularis) and rhesus macaques (Macaca mulatta) have been extensively employed as animal models in the study of human diseases and the development of cures 2,3. However, only a few studies have explored the differences and similarities in the brain anatomy of cynomolgus and rhesus macaques. Broadening our knowledge here and providing specific brain templates and parcellations should help to improve both translational studies and research in basic neuroscience. In this study, we explored morphometric differences of the brain of cynomolgus and rhesus macaque using structural, T1-weighted (T1w) MRI and the Jacobian determinant.Methods
Subjects: Five healthy female Cynomolgus macaques (Macaca fascicularis) at the age of 7-8 years were included.Data Acquisition: T1w images were acquired at 3 T (MAGNETOM Prisma, Siemens) using 3D MPRAGE with the following acquisition parameters: TE = 2.7 ms, TR = 2700 ms, and FA = 8 °, field of view = 107 x 127 mm2, acquisition matrix = 216 x 256, spatial resolution = 0.5 x 0.5 x 0.5 mm3, and total acquisition time = 14.3 minutes.
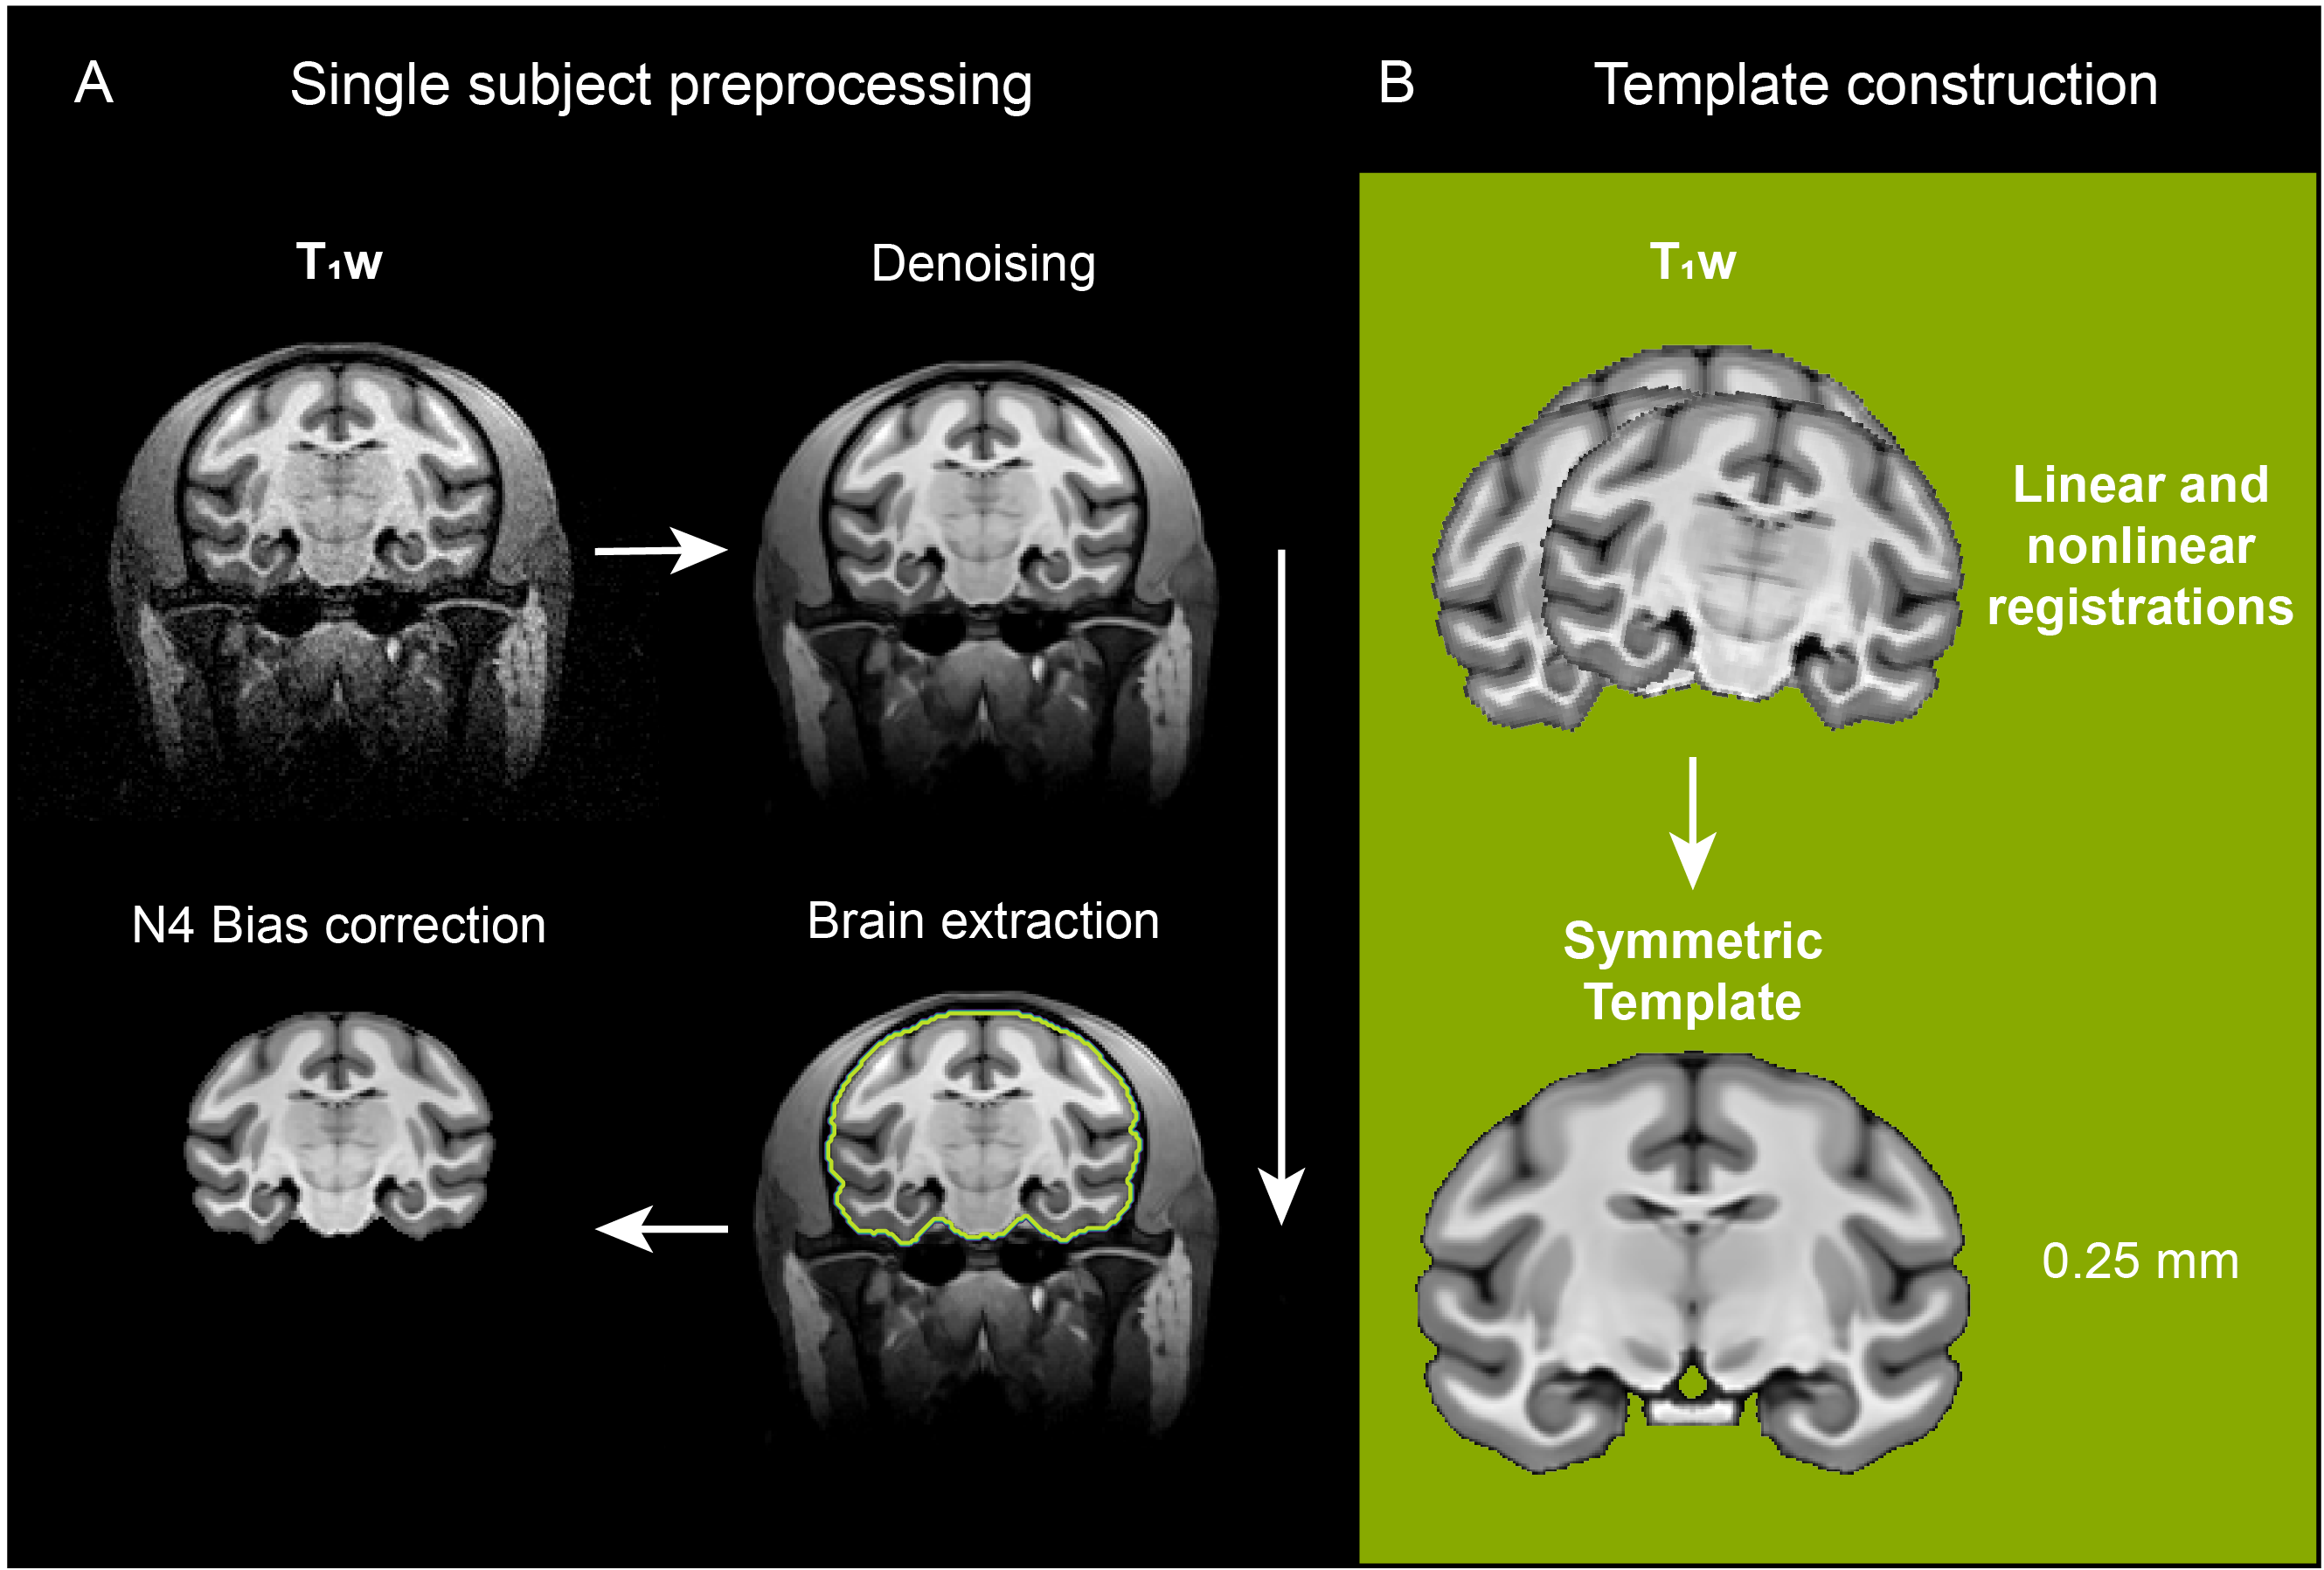
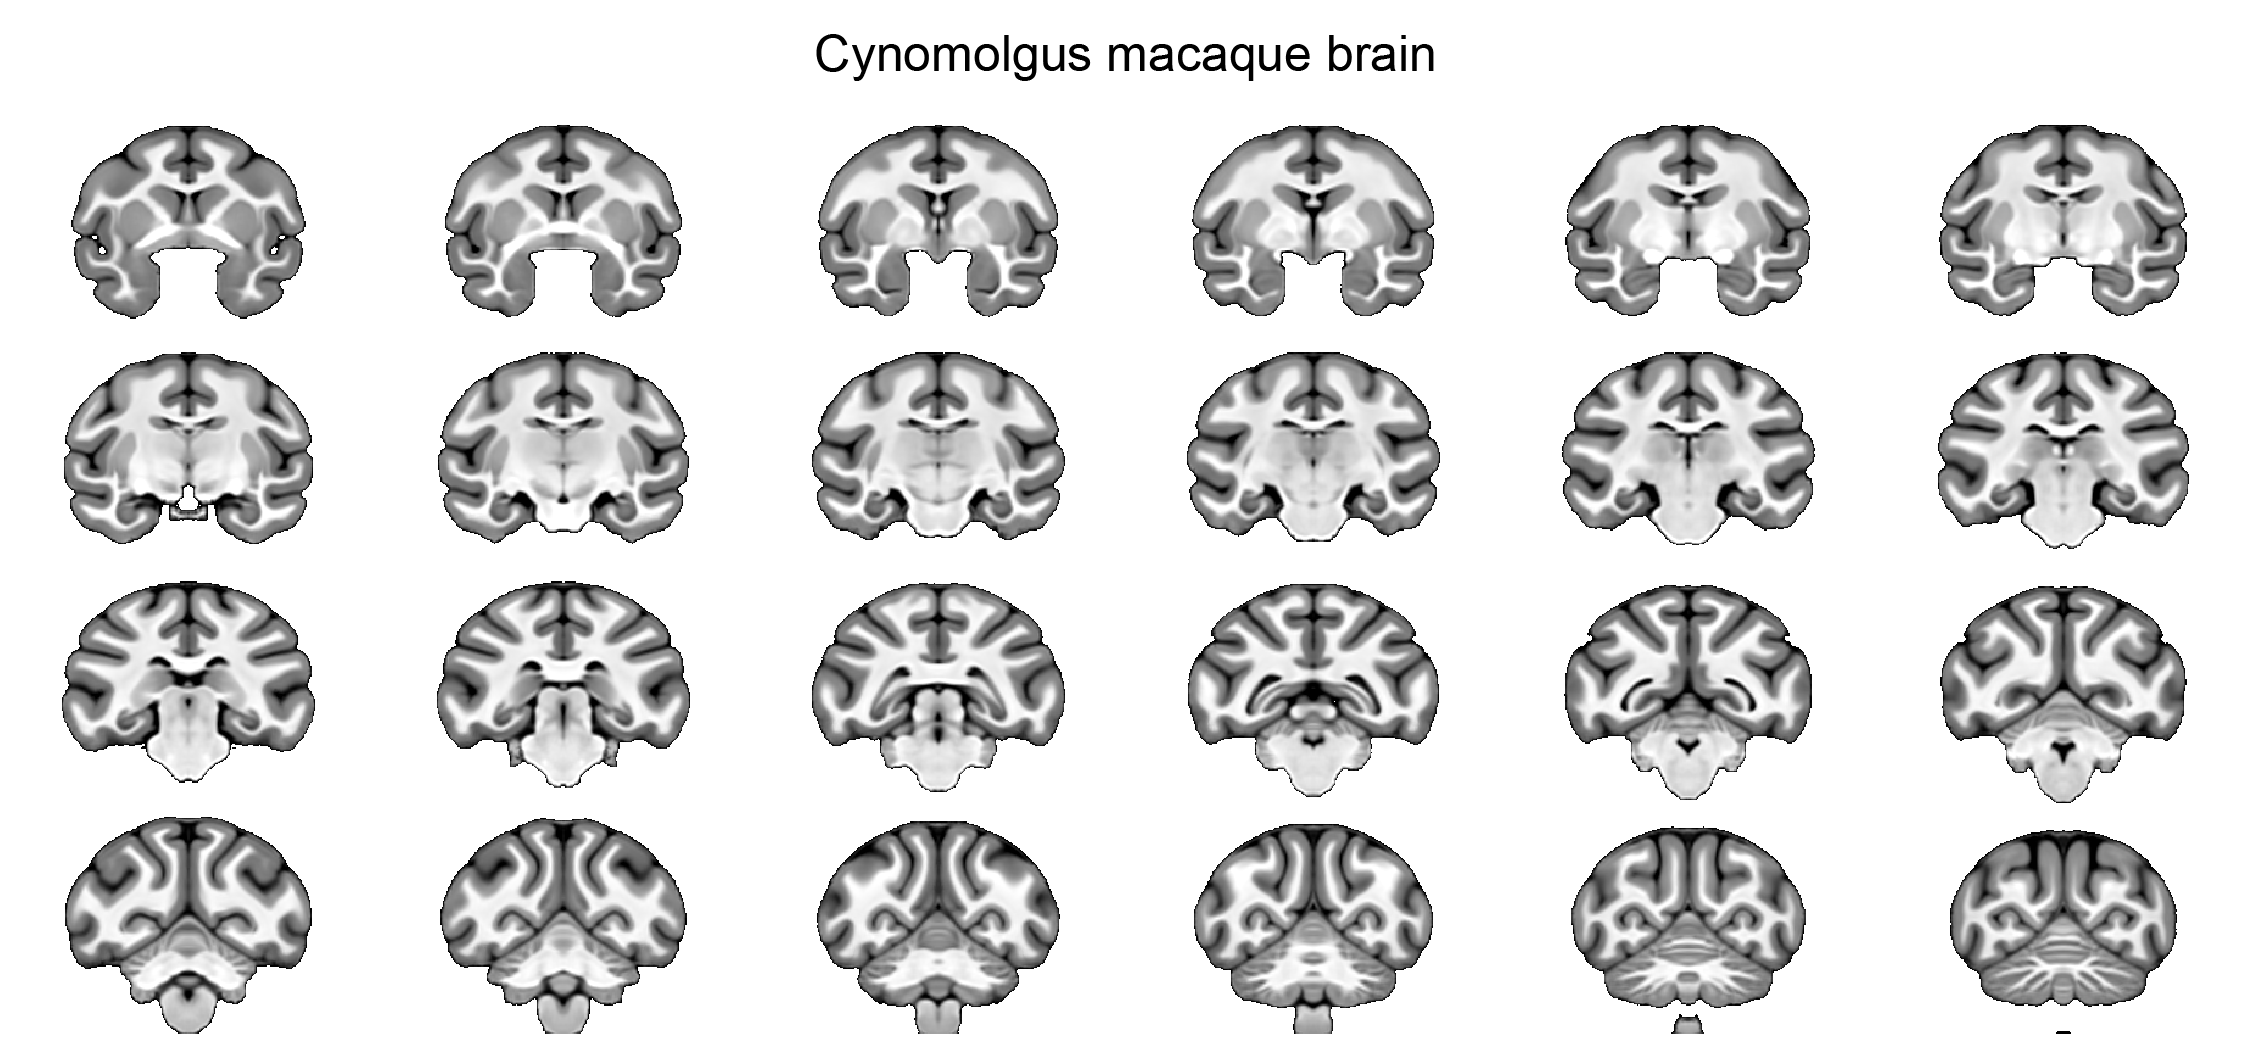
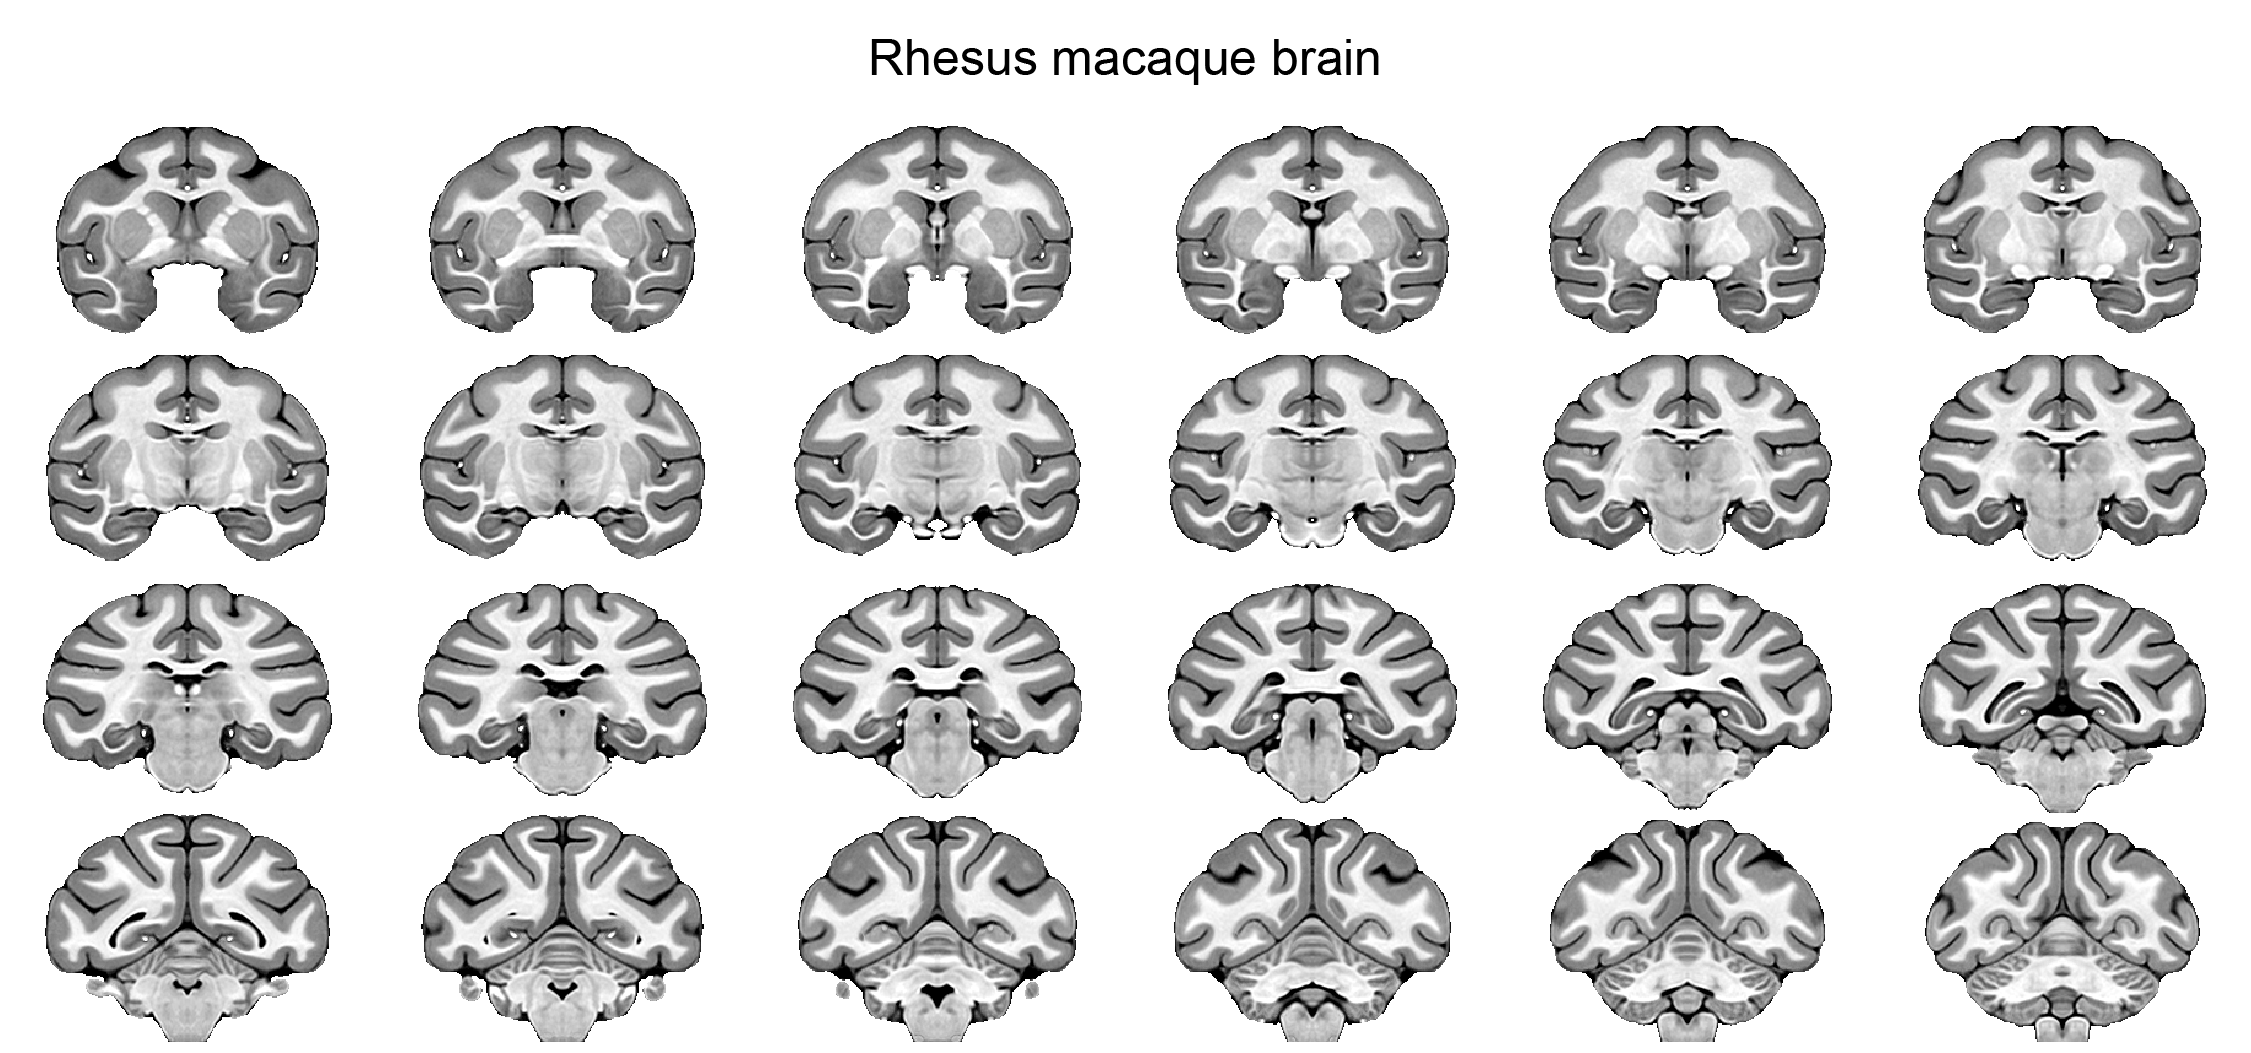
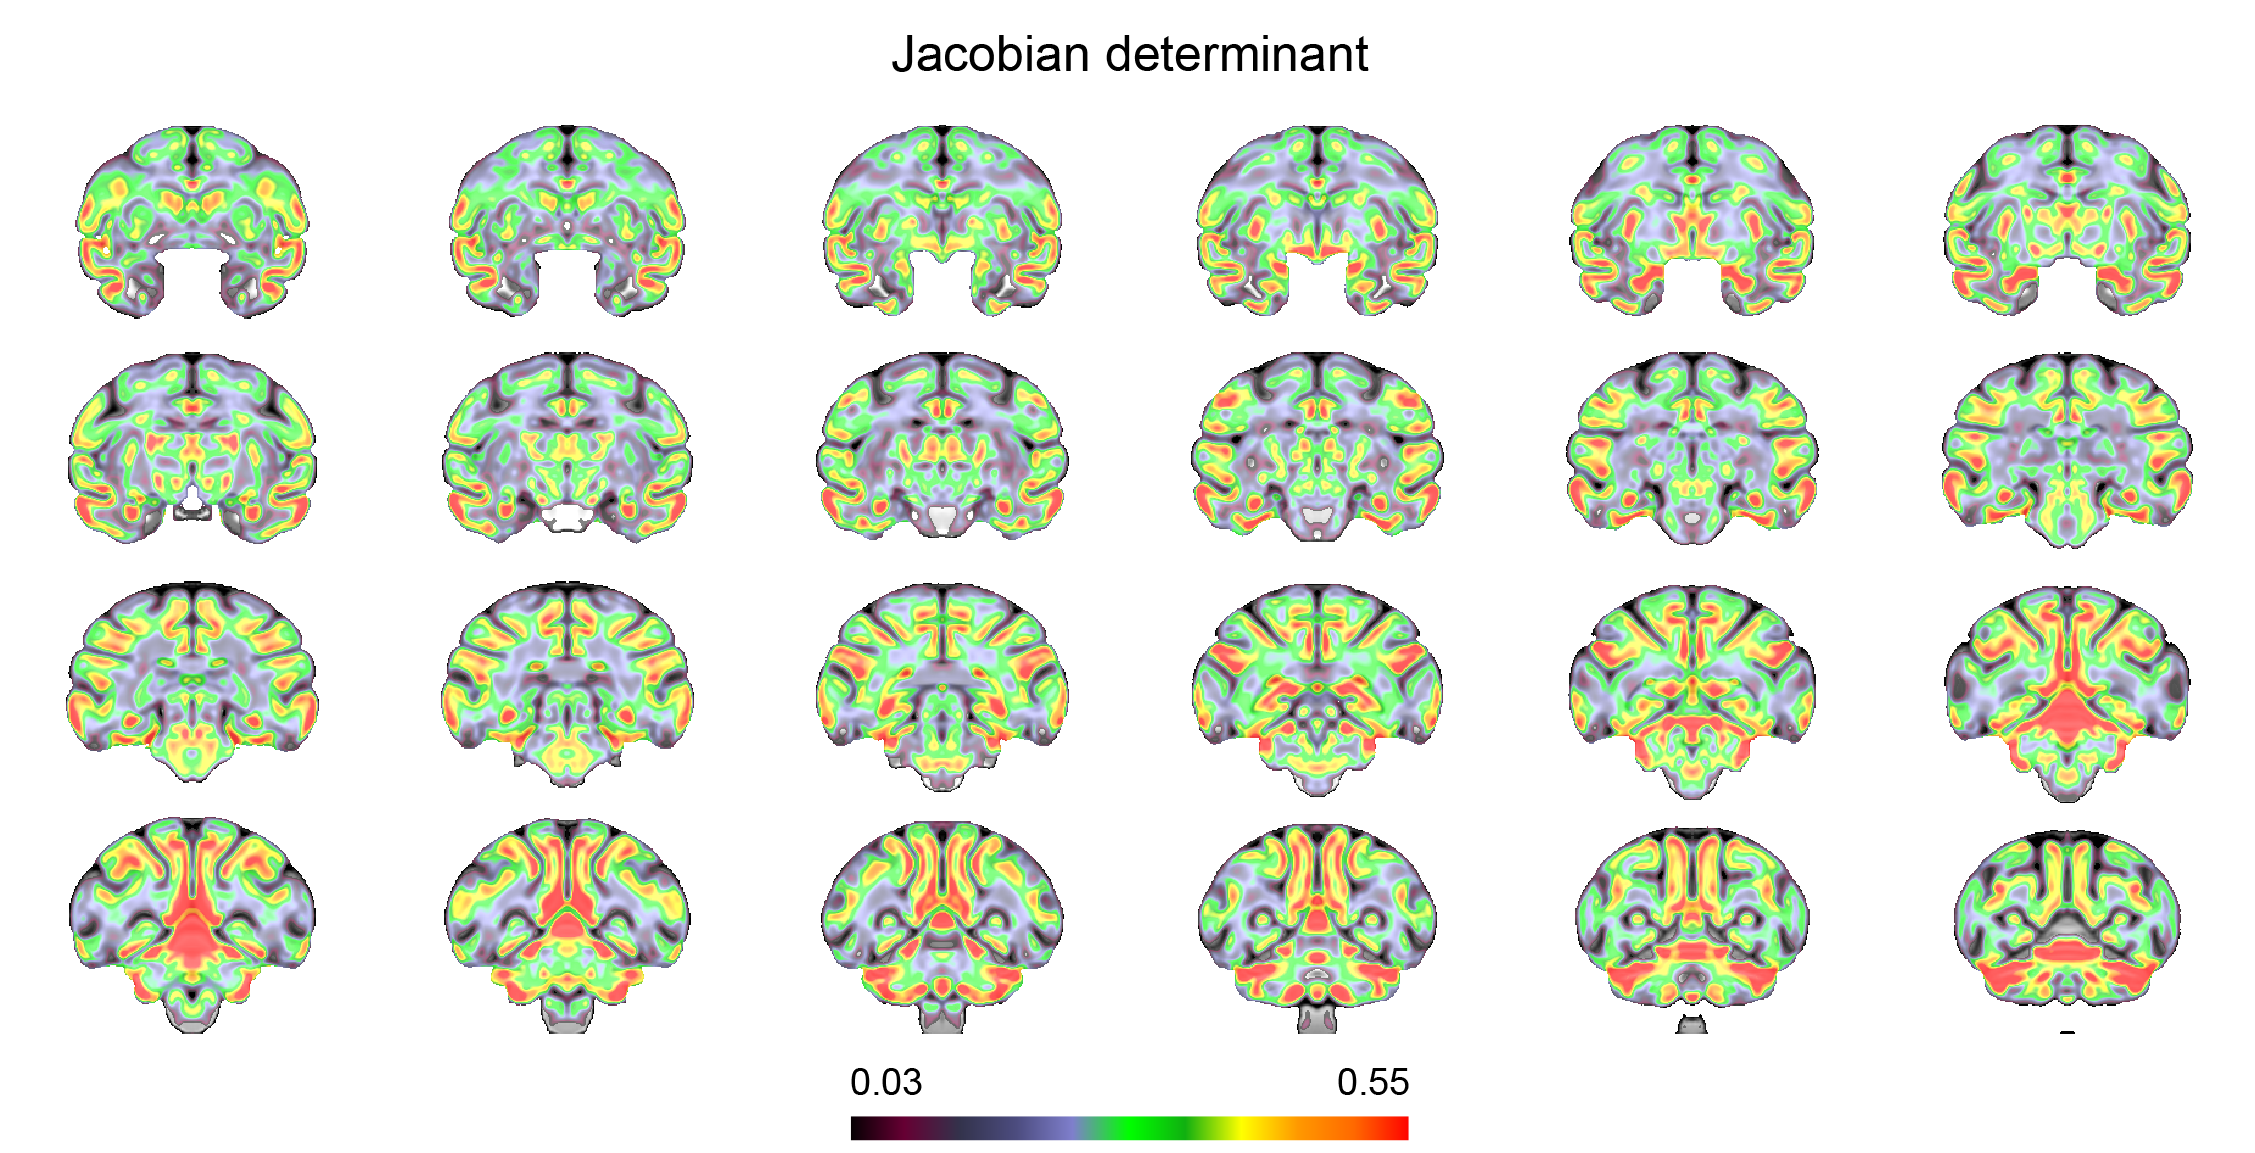
Data analysis: The analysis pipeline is shown in Figure 1. T1w images were denoised using ANTs 4. The brain mask was created manually using ITK-SNAP. The segmented brains were then used for the bias field correction using N4BiasFieldCorrection 5. The skull-stripped T1w images were duplicated and mirrored on the plane between the hemispheres. Using linear and nonlinear registrations, the resulting ten volumes were then used to generate an unbiased group average symmetric brain template (Fig. 1B & 2 ) 6. The symmetric cynomolgus macaque template was then nonlinearly registered to the symmetric rhesus macaque template (NMT v2, Fig. 3) 7. The log Jacobian determinant was calculated using the deformation fields generated using the nonlinear transformation of the symmetric cynomolgus template to the rhesus macaque template. A 3D Gaussian kernel (FWHM 0.5 mm) was used to smooth the log Jacobian determinant maps (Fig. 4). Furthermore, ANTs Atropos was used to classify cynomolgus and rhesus macaque template brain tissues into three classes (cerebrospinal fluid, gray matter, and white matter).
Results and Discussion
The maps of the log Jacobian determinant are shown in Figure 4. Positive values indicate an expansion from the cynomolgus template to the rhesus template, whereas negative log Jacobian determinants represent tissue contraction. In general, the cynomolgus monkey has a smaller brain than the rhesus macaque. Remarkably, however, it is not a simple linear downscaling. The log Jacobian determinant revealed an expansion from the cynomolgus brain to the rhesus brain, particularly in cortical gray matter regions. This is supported by the result of the three-tissue segmentation results, which revealed a higher gray-to-white matter volume ratio (1.74) in rhesus macaques than in cynomolgus macaques (1.53). The observed inter-species differences in cortical gray matter volumes are stronger than previously reported intra-subject variabilities in rhesus macaques 8,9 and our data on intra-subject variabilities in cynomolgus macaques. A limitation of this comparison could be the age of the included monkeys. The rhesus macaques included in the NMT v2 template were in a broader age range, between 3.2 years to 13.2 years. The second confounder is the different number of animals and sex of the included monkeys. The rhesus macaque NMT v2 template was made up of scans from 25 males and 6 females, whereas the cynomolgus macaque template was made up of scans from 5 females. Further studies might include larger numbers of animals, including both sexes, and might also specifically look at differences between the two hemispheres.Acknowledgements
No acknowledgement found.References
1. Bernacky, B. J., Gibson, S. V., Keeling, M. E. & Abee, C. R. Chapter 16 - Nonhuman Primates. in Laboratory Animal Medicine (Second Edition) (eds. Fox, J. G., Anderson, L. C., Loew, F. M. & Quimby, F. W.) 675–791 (Academic Press, 2002). doi:10.1016/B978-012263951-7/50019-3.
2. Stonebarger, G. A., Bimonte-Nelson, H. A. & Urbanski, H. F. The Rhesus Macaque as a Translational Model for Neurodegeneration and Alzheimer’s Disease. Frontiers in Aging Neuroscience 13, 581 (2021).
3. Weber, K., Häcker, R., Hardisty, J. F., Harris, S. B. & Hayes, A. W. Oral repeated-dose toxicity studies of BIA 10–2474 in cynomolgus monkeys. Regulatory Toxicology and Pharmacology 111, 104547 (2020).
4. Manjón, J. V., Coupé, P., Martí‐Bonmatí, L., Collins, D. L. & Robles, M. Adaptive non-local means denoising of MR images with spatially varying noise levels. Journal of Magnetic Resonance Imaging 31, 192–203 (2010).
5. Tustison, N. J. et al. N4ITK: improved N3 bias correction. IEEE Trans Med Imaging 29, 1310–1320 (2010).
6. Avants, B. B., Epstein, C. L., Grossman, M. & Gee, J. C. Symmetric diffeomorphic image registration with cross-correlation: evaluating automated labeling of elderly and neurodegenerative brain. Med Image Anal 12, 26–41 (2008).
7. Jung, B. et al. A comprehensive macaque fMRI pipeline and hierarchical atlas. NeuroImage 235, 117997 (2021).
8. Seidlitz, J. et al. A population MRI brain template and analysis tools for the macaque. Neuroimage 170, 121–131 (2018).
9. Dadarwal, R. & Boretius, S. Multi-contrast MRI Atlas of the Cynomolgus Macaque Brain. https://index.mirasmart.com/ISMRM2021/PDFfiles/1235.html (2021).
Figures