2413
Hypercapnia does not change CMRO2: Data from mouse studies using multimodal NIRS-MRI at 9.4T1Biomedical Engineering Graduate Program, University of Calgary, Calgary, AB, Canada, 2Department of Radiology, University of Calgary, Calgary, AB, Canada, 3Hotchkiss Brain Institute, University of Calgary, Calgary, AB, Canada, 4Experimental Imaging Centre, University of Calgary, Calgary, AB, Canada
Synopsis
Non-invasive quantitative imaging of cerebral metabolic rate of oxygen (CMRO2) is essential to understand oxidative metabolism in health and disease. Hypercapnia is often used as a calibration for MRI methods associated with quantifying CMRO2. Here we show that CMRO2 remains constant during hypercapnia. We also provide a novel multimodal NIRS-MRI system that can assess absolute values of multiple metabolic correlates noninvasively in living mouse brain, and with no need for calibration with gas mixtures. Moreover, this technique is capable to monitor mitochondrial status by measuring the redox state of cytochrome oxidase, the enzyme responsible for oxygen consumption in the cell.
INTRODUCTION
A hypercapnia challenge is often used as a calibration procedure for MRI methods associated with quantifying cerebral metabolic rate of oxygen (CMRO2). In these studies, it is important that the applied hypercapnia challenge does not affect the measured CMRO2.In normal physiology, neurovascular coupling is tightly controlled between blood flow and oxygen consumption in order to supply needed substrates and remove end products. It is known that inducing hypercapnia increases cerebral blood flow (CBF), however there have been conflicting reports about whether CMRO2 is maintained at normal levels during such an increase of CBF and oxygen delivery. Oxygen consumption on the mitochondrial level might be affected as well.
In this study, we used a novel multimodal NIRS-MRI system to quantify CMRO2 during hypercapnia in the cerebral cortex of a mouse model at 9.4T. Combining MRI and near-infrared spectroscopy (NIRS) allows the quantification of CMRO2 1,2, through simultaneous measurement of CBF with arterial spin labeling (ASL) MRI, and the hemoglobin concentration in the tissue (tHb) along with tissue oxygen saturation (StO2) using broadband NIRS. To examine changes in the redox state of mitochondria during hypercapnia, we used NIRS to monitor the redox state of the mitochondrial enzyme cytochrome c oxidase (CCO), which is strongly linked to oxygen metabolism.
METHODS
Nine C57Bl6 mice were monitored using the multimodal NIRS-MRI, before and during the induction of mild hypercapnia (5% CO2). The mice were anesthetized with 2% isoflurane, spontaneously ventilated (30% O2, 70% N2) and physiologically stabilized prior to data acquisition.A 9.4T Bruker MRI with a 35 mm volume coil was used to non-invasively quantify CBF with an arterial spin labeling (ASL) sequence; A single axial slice was acquired around the bregma using a CASL-HASTE sequence with the following parameters: TR/TE=3000/13.3 ms, matrix size = 128x128 pixels, FOV = 25.6x25.6 mm, slice thickness = 1.5 mm, 16 averages. In total, 4 perfusion images were collected per measurement: 2 controls and 2 tagged images, to correct for magnetization transfer. Following these, a T1 map was obtained in the same location using a RARE-VTR sequence where TE = 20 ms, TR=100, 500, 1000, 3000 and 7500 ms. The 4 perfusion images and T1 map are collected over a period of 14 min. CBF was calculated on a voxel-by-voxel basis 3.
We measured the concentration of hemoglobin (tHb) and oxygen saturation (StO2), in mouse cortex, in addition to the concentration and redox state of CCO using a custom-built broadband NIRS device and in-house developed processing algorithms. Oxygen Extraction Fraction (OEF) was derived from StO2 and arterial oxygen saturation (SaO2). CMRO2 was calculated based on the modified Fick principle4.
RESULTS
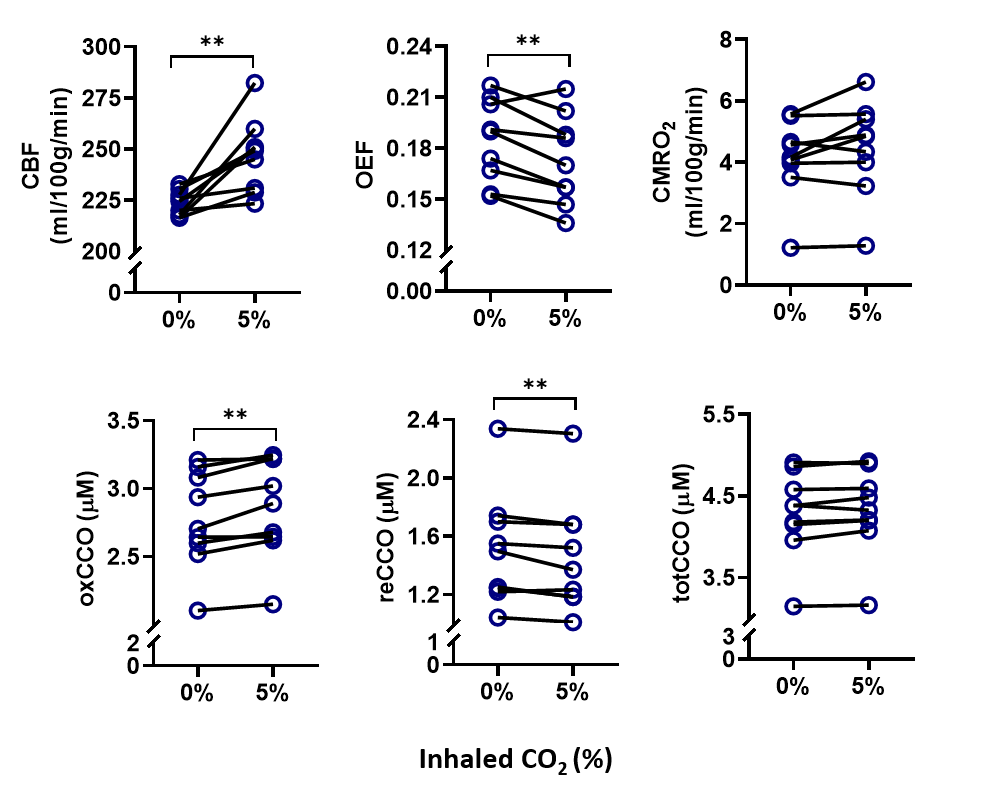
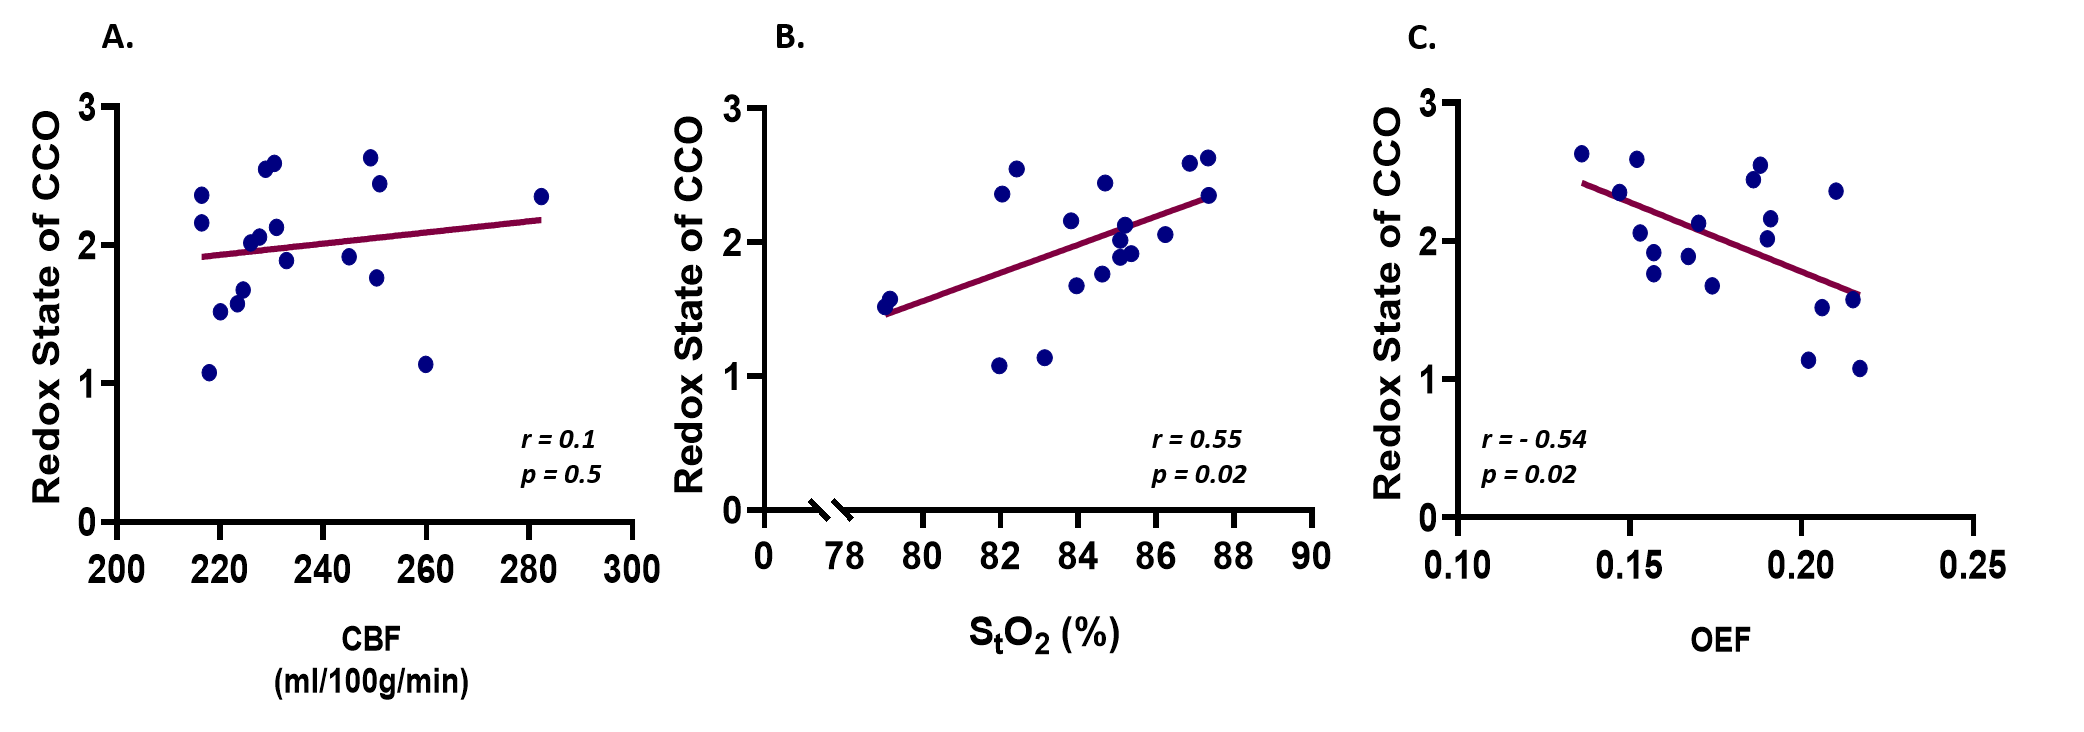
During the hypercapnia challenge, CMRO2 was constant at 4.5±1.5 ml/100g/min compared to 4.1±1.3 ml/100g/min before hypercapnia. There was a significant increase in the redox state of CCO (+ 6.7%, p = 0.006), StO2 (+ 0.7%, p = 0.003), and CBF (+ 10%, p = 0.004) while OEF decreased significantly (- 5.6%, p = 0.008). The redox state of CCO had a positive linear correlation with StO2 (r = 0.55, p = 0.02), and a negative linear correlation with OEF (r = -0.54, p = 0.02), but no linear correlation with CBF (r = 0.1, p = 0.5).DISCUSSION
As expected, hypercapnia resulted in an increase in CBF and therefore tissue oxygenation. Raised levels of oxidized CCO, accompanied with a decrease in OEF, were observed as well. There have been conflicting reports about whether hypercapnia can increase CMRO2. In this case, in the presence of high oxygen delivery, and high oxidized state of CCO, CMRO2 did not increase. This indicates that higher redox state of CCO does not mean necessarily that oxygen consumption would be higher. We suggest that the regulation of CCO has changed, resulting in a tight coupling between the metabolic requirements of the brain, which are not expected to change during hypercapnia, and oxidative metabolism or CMRO2.The balance between oxygen consumption by CCO and oxygen delivery by CBF, i.e., OEF, decreased, and this enabled the maintenance of stable CMRO2. Therefore, the response of both CCO and CBF to mild hypercapnia is suggested to contribute to the maintenance of stable CMRO2.
CONCLUSION
The application of a multimodal NIRS-MRI system enabled non-invasive quantification of CMRO2 in the cerebral cortex of mouse model in vivo. We showed that CMRO2 remained constant under a mild hypercapnia challenge. This technique allows us to monitor multiple physiological variables simultaneously, such as CBF, CCO, StO2, and OEF. Therefore, it provides a more comprehensive picture of the mechanisms involved in the regulation of cerebral oxygen metabolism and consumption. Having such a multimodality system will open new possibilities for studying brain metabolism using the many mouse models of brain disease available. This method could be translated to human studies.Acknowledgements
This work was supported by an NIH R21 grant, Canada Foundation for Innovation (CFI), Natural Sciences and Engineering Research Council (NSERC), Discovery grant, and the Biomedical Engineering Graduate program (BMEG) at U of C.
References
1. Kety SS, Schmidt CF. The Nitrous Oxide Method for the Quantitative Determination of Cerebral Blood Flow in Man: Theory, Procedure and Normal Values. J Clin Invest. Jul 1948;27(4):476-483.
2. Kety SS, Schmidt CF. The determination of cerebral blood flow in man by the use of nitrous oxide in low concentrations. American Journal of Physiology-Legacy Content. 1945;143(1):53-66.
3. Buxton RB. Quantifying CBF with arterial spin labeling. Journal of magnetic resonance imaging : JMRI. Dec 2005;22(6):723-726.
4. Tichauer KM, Hadway JA, Lee T-Y, Lawrence KS. Measurement of Cerebral Oxidative Metabolism with Near-Infrared Spectroscopy: A Validation Study. Journal of Cerebral Blood Flow & Metabolism. 2006;26(5):722-730.
Figures
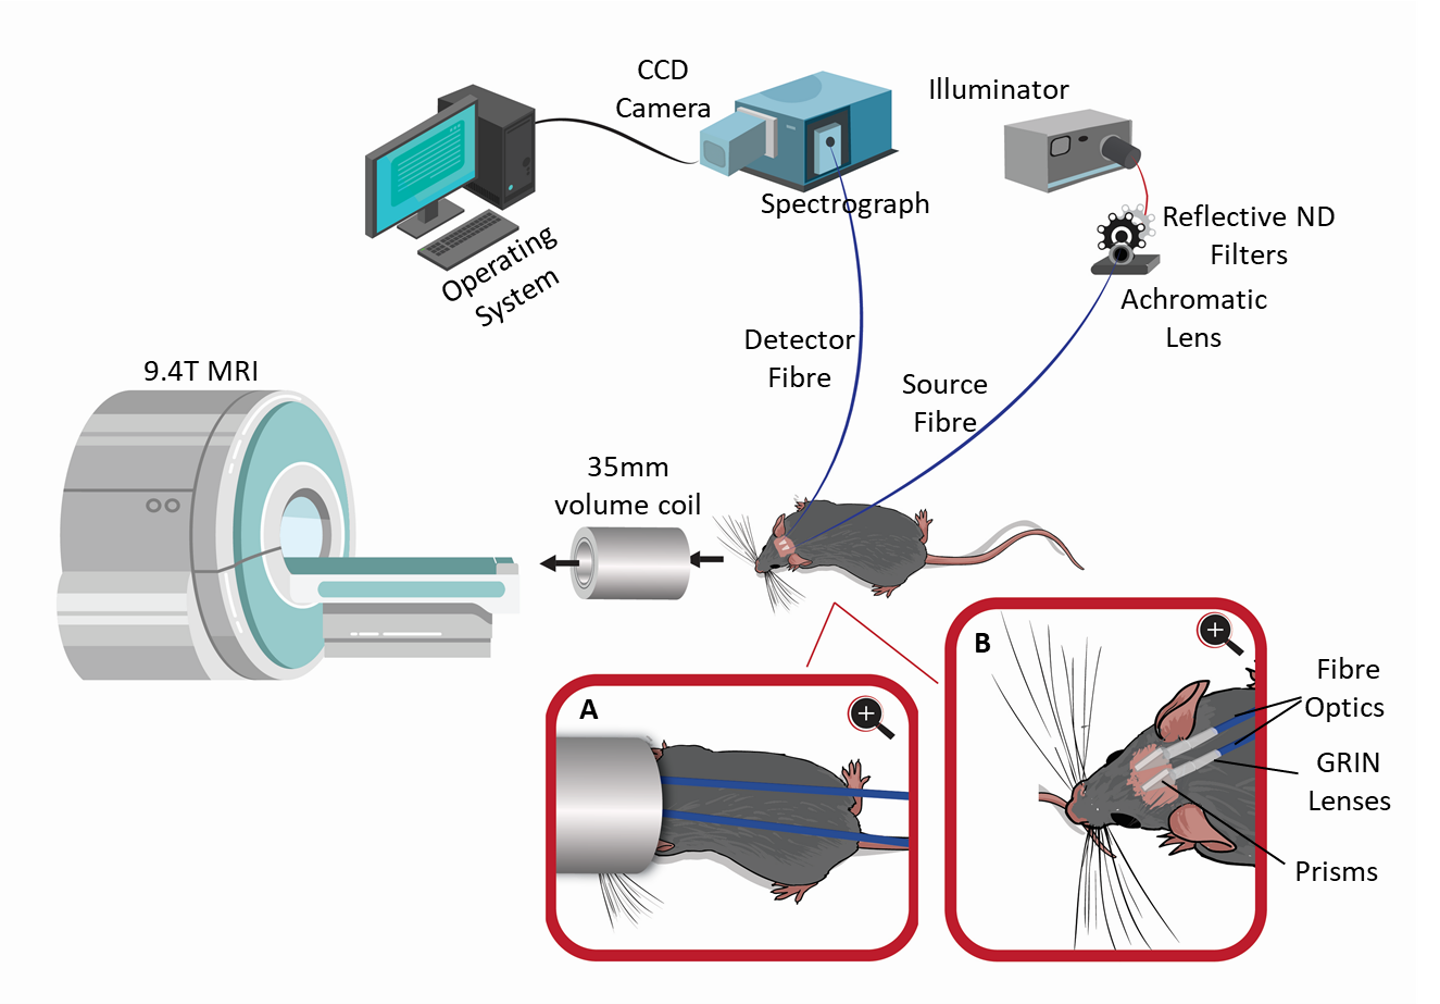
A schematic design of the multimodal NIRS-MRI system. The system consists of the broadband CW NIRS system and a 9.4T Bruker MRI system. Inset A shows a closeup view of the animal with the fibre optics inside the MRI coil. Inset B shows a closeup view of the optic fibres positioned on the shaved scalp of the animal.