2412
Bilateral homotopic rs-fMRI connectivity strength is not primarily mediated by direct corticocortical interaction1Center for Neuroscience Imaging Research (CNIR), Suwon, Korea, Republic of, 2Department of Biomedical Engineering, Sungkyunkwan University, Suwon, Korea, Republic of
Synopsis
Functional connectivity measured by rs-fMRI have generally shown a bilateral organization in homotopic cortices, presumably related to the intrinsic network of spontaneous activity. Alternatively, cortical silencing suppresses spontaneous output activity from the inactivated site and reduces input to downstream areas. Thus, the decrease in fMRI responses due to cortical silencing is related to the strength of resting-state connectivity between the stimulation site and the connected regions. To examine the contribution of spontaneous neuronal communications to bilateral homotopic connectivity of rs-MRI, we compared the somatosensory network by rs-fMRI with cortical silencing fMRI by optogenetic stimulation of interneurons and anatomical tracing data.
Purpose
Resting-state fMRI (rs-fMRI) measures the synchronization of fluctuating fMRI signals between brain regions at rest, which is presumably related to the intrinsic network of spontaneous activity1-2. In general, functional connectivity (FC) measured by rs-fMRI have shown a predominant bilateral organization in homotopic cortices3-4. This bilateral connectivity may have been due to direct corticocortical (CC) communications and/or synchronized common neural and vascular sources. Alternatively, since inhibiting cortical region inevitably suppresses spontaneous excitatory output activity and causally reduces input to downstream signaling pathways5, this downregulated neuronal activity, resulting in a decreased fMRI signal (deactivation), can be closely related to the degree of interregional communication under basal conditions6. Therefore, fMRI with cortical inactivation can be used to examine the contribution of spontaneous neuronal CC communications to bilateral FC of rs-MRI. Here, we determined the resting-state somatosensory network with conventional rs-fMRI and cortical silencing fMRI by optogenetic stimulation of interneurons and compared them with anatomical tracing data.Materials & Methods
All fMRI experiments of transgenic mice expressing light-sensitive channelrhodopsin-2 in GABAergic neurons (VGAT-ChR2)7 and naïve C57BL/6 mice were performed on 15.2T under ketamine-xylazine anesthesia8. To minimize susceptibility artifacts arising from implanted fiber, FLASH was used for CBV-weighted fMRI after the injection of 45 mg/kg MION with following parameters: TR/TE=50/3ms, spatial resolution=156×156×500μm3, 6 contiguous coronal slices and temporal resolution=2s.For conventional rs-fMRI, eighteen 10-min scans (i.e., 300 volumes) were obtained from two separate animal groups, naïve C57BL/6 (n=5, twice each) and transgenic VGAT-ChR2 mice7 (n=4, twice each), after a few somatosensory fMRI to ensure the physiological condition responding to external stimuli.
For cortical silencing fMRI by optically stimulating GABAergic-interneurons to drive inhibition on the spontaneous pyramidal neuronal activity5,7, the optical fiber cannula (Ø105µm core) was implanted into three cortical areas on right hemisphere of VGAT-ChR2 mice: primary somatosensory cortex (S1FL; AP:-0.2mm relative to bregma, ML: +2.2mm, DV: +0.5mm relative to the surface; n=6), primary motor cortex (M1; AP: +0.05mm, ML: +1.1mm, DV: +0.25mm; n=7) and secondary somatosensory cortex (S2; AP: -1.1mm, ML: +4.2mm, DV: +0.9mm; n=7). Blue light stimulation of 3mW was applied at 20Hz with a pulse width of 10ms. Functional trial consisted of a 60-s prestimulus, 20-s stimulus, 60-s interstimulus, 20-s stimulus, and 60-s poststimulus period, and 15 fMRI trials were obtained for signal averaging.
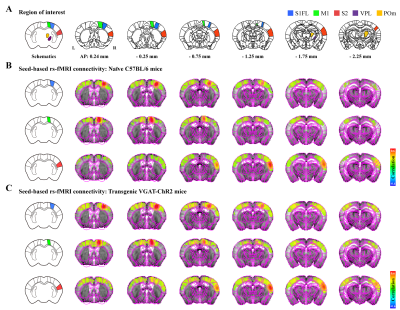
To identify the spatial pattern of spontaneous somatosensory network, the connectivity maps for rs-fMRI were generated using temporal correlation in S1FL, M1, and S2 seed-regions in right hemisphere, while the connectivity maps for cortical silencing fMRI were generated using GLM analysis. To compare the relative strength of networks, the magnitude of FC within predefined somatosensory regions (Fig.1A) was normalized with the strongest connectivity to seed-regions in rs-fMRI and with response of stimulation sites in cortical silence fMRI. To examine which FC patterns closely reflect the intrinsic neural networks, tracer-based connectivity maps (for S1FL, experiment #112229814; for M1, experiment #100141563; for S2, experiment #112514915) were obtained from the Allen Institute9. The connectivity strengths in networked areas were normalized by the projection density in injection site.
Results
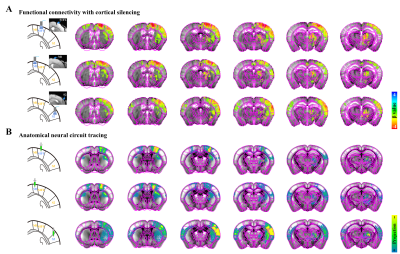
A strong bilateral cortical connectivity was detected without a significant network between the seed ROIs and the ipsilateral thalamus in naïve mice (Fig.1B). Similar homotopic connectivity was observed in transgenic mice, indicating that bilateral homotopic correlation is a general feature of rs-fMRI independent of mouse strain (Fig.1C).Focal silencing of S1FL, M1, or S2 activity by optogenetic stimulation of inhibitory neurons reduced CBV in networked cortical and subcortical sites (Fig.2). Inactivation of S1FL induced CBV changes at the ipsilateral cortices, thalamic nuclei, and striatum (Fig.2A). Similar observations were detected for inhibition of M1 and S2 activities (Fig.2A). These fMRI networks were topologically consistent with neuronal tracing connectivity maps (Fig.2B).
In the relative connectivity strength of somatosensory network (Fig.3), the bilateral homotopic connections of rs-fMRI were weakly observed in connectivities measured by cortical inhibition fMRI and neural tracing studies. In the correlation with connectivity strength of neural tracing data, rs-fMRI connectivity showed a poor similarity (r=0.05), whereas networks by cortical silencing fMRI were well-matched (r=0.72). These indicate that the dominant bilateral cortical connectivity detected by rs-fMRI is unlikely due to direct neuron-based CC communication.
Discussion & Conclusion
The bilateral homotopic correlation is often explained by direct CC connections due to the existence of monosynaptic anatomical projections3,10. However, careful evaluation of anatomical tracing data show that ipsilateral projections among the somatosensory networks including thalamus are generally larger than contralateral homotopic projections9 (Fig.3). Notably, rs-fMRI fails to detect strong ipsilateral connectivity between the cortex and thalamus within somatosensory network; such connectivity was indeed observed in spontaneous connectivity maps by cortical silencing fMRI and anatomical tracing maps. These results indicated that conventional rs-fMRI correlation strength did not truly reflect anatomical monosynaptic connections but indicated common bilateral fluctuations, such as modulatory cholinergic inputs11, noradrenaline driven by the locus coeruleus12, and thalamic low frequency13. Further systematic studies are necessary to determine the origin of rs-fMRI connectivity.Acknowledgements
This work was supported by IBS-R015-D1.References
1. B. Biswal, F. Z. Yetkin, V. M. Haughton, J. S. Hyde, Functional connectivity in the motor cortex of resting human brain using echo-planar MRI. Magn Reson Med. 1995;34(4):537-541.
2. M. D. Greicius, B. Krasnow, A. L. Reiss, V. Menon, Functional connectivity in the resting brain: a network analysis of the default mode hypothesis. Proc Natl Acad Sci U S A. 2003;100(1):253-258.
3. J. Grandjean, V. Zerbi, J. H. Balsters, N. Wenderoth, M. Rudin, Structural Basis of Large-Scale Functional Connectivity in the Mouse. J Neurosci. 2017;37(34):8092-8101.
4. J. Paasonen, P. Stenroos, R. A. Salo, V. Kiviniemi, O. Gröhn, Functional connectivity under six anesthesia protocols and the awake condition in rat brain. Neuroimage. 2018;172:9-20.
5. J. S. Wiegert, M. Mahn, M. Prigge, Y. Printz, O. Yizhar, Silencing Neurons: Tools, Applications, and Experimental Constraints. Neuron. 2017;95(3):504-529.
6. Y. Huo, H. Chen, Z. V. Guo, Mapping Functional Connectivity from the Dorsal Cortex to the Thalamus. Neuron. 2020;107(6):1080-1094.e5.
7. S. Zhao et al., Cell type–specific channelrhodopsin-2 transgenic mice for optogenetic dissection of neural circuitry function. Nat Methods. 2011;8(9):745-752.
8. W. B. Jung, H. J. Shim, S. G. Kim, Mouse BOLD fMRI at ultrahigh field detects somatosensory networks including thalamic nuclei. Neuroimage. 2019;195:203-214.
9. S. W. Oh et al., A mesoscale connectome of the mouse brain. Nature. 2014;508(7495):207-214.
10. J. M. Stafford et al., Large-scale topology and the default mode network in the mouse connectome. Proc Natl Acad Sci U S A. 2014;111(52):18745-18750.
11. C. Mateo, P. M. Knutsen, P. S. Tsai, A. Y. Shih, D. Kleinfeld, Entrainment of Arteriole Vasomotor Fluctuations by Neural Activity Is a Basis of Blood-Oxygenation-Level-Dependent "Resting-State" Connectivity. Neuron. 2017;96(4):936-948.e3.
12. J. H. Kim et al., Selectivity of Neuromodulatory Projections from the Basal Forebrain and Locus Ceruleus to Primary Sensory Cortices. J Neurosci. 2016;36(19):5314-5327.
13. X. Wang, A. T. L. Leong, R. W. Chan, Y. Liu, E. X. Wu, Thalamic low frequency activity facilitates resting-state cortical interhemispheric MRI functional connectivity. Neuroimage. 2019;201:115985.
Figures

Figure 1. Resting-state somatosensory network in rs-fMRI
A) Allen mouse brain atlas-based ROIs in the somatosensory network.
B-C) Functional connectivity maps measured by seed-based rs-fMRI (TFCE-corrected p<0.05). The rs-fMRI showed a strong correlation between bilateral somatosensory cortices but not between the cortex and thalamus in ipsilateral hemisphere in (B) naïve and (C) transgenic mice. This bilateral cortical connectivity is a general feature of rs-fMRI independent of mouse strain.

Figure 2. Resting-state somatosensory network in cortical silencing fMRI vs. neural connectivity maps
A) Functional connectivity maps measured by cortical silencing fMRI (FDR-corrected p<0.05). Ipsilateral somatosensory regions including cortices and thalamus, mostly responded to cortical inactivation.
B) Neural connectivity maps projected from somatosensory cortices, obtained from the Allen Institute. Ipsilateral projections in somatosensory network are generally stronger than contralateral ones.

Figure 3. Connectivity strength of somatosensory network measured by rs-fMRI vs. cortical silencing fMRI vs. neuronal tracing
The rs-fMRI mainly reflected bilateral homotopic connectivity, whereas spontaneous functional connectivity measured by cortical inactivation fMRI and anatomical connectivity were mainly observed in ipsilaterally networked cortical and thalamic regions, indicating that bilateral homotopic connectivity of rs-fMRI was unlikely due to direct corticocortical communication.