2411
Resting-state single-vessel cerebral blood velocity by phase contrast fMRI1Massachusetts General Hospital, Martinos Center for Biomedical Imaging, Charlestown, MA, United States
Synopsis
This research utilizes a novel high-resolution phase-contrast (PC) MRI method to measure resting-state fluctuation of cerebral blood flow-related velocity (CBFv) from penetrating vessels in the rat parietal cortex. This novel PC-based mapping scheme has identified vessel-specific correlation and anti-correlation patterns between venules and arterioles with the low-frequency oscillatory features less than 0.05Hz in anesthetized rat brains. By combining PC-based CBFv fMRI and single-vessel cerebral blood volume (CBV)-fMRI, we will further study the vasodynamic changes in diseased animal models.
INTRODUCTION
Resting-state functional MRI (rs-fMRI) maps brain functional connectivity, assuming the brain-wide spatial correlation patterns based on the associated or synchronized neuronal activity across neuronal networks1. By implementing the high resolution single-vessel BOLD and CBV fMRI mapping method2,3, we have previously shown that the vascular network present is highly correlated with spatial features underlying the rs-fMRI connectivity mapping. It provides a new perspective to study the vasodynamic changes caused by global brain state fluctuation, as well as circuit-specific regulation across different spatial scales. In this work, we applied a high resolution phase contrast-based single-vessel fMRI method4 to identify the resting state fluctuation of cerebral blood flow-related velocity (CBFv) across vascular network. In contrast to arteriole-dominated cerebral blood volume (CBV) and venule-dominated blood oxygen level determination (BOLD) fMRI responses, our CBFv method enables measurements of cerebral blood flow in all individual pial and penetrating vessels in resting-state condition.METHODS
Animal Model: Male Sprague Dawley rats (~250-350g) were induced with 5% and maintained at 1%-2% isoflurane. The rats’ rectal temperature was maintained at around 37oC. To prevent head motion, rats were secured in a head holder with a bite bar.MR Techniques: Images were acquired using a 21 cm bore, 9.4 T magnet (Magnex Scientific). A custom-made transceiver coil with an internal diameter of 6 mm was used for fMRI image acquisition. To anatomically map individual arterioles and venules penetrating deep cortical layers of the somatosensory cortex, a 2D multi-gradient echo (MGE) sequence was applied with the following parameters: TR=50 ms; TE=2.5, 5.0, 7.5, 10.0, 12.5 and 15.0 ms; flip angle=55°; matrix=192 x 192; in-plane resolution=50x50 μm2; slice thickness=500 μm. For in vivo single-vessel CBFv measurements: TR=15.6 ms; TE=5.0 ms; flip angle=15°; FOV=6.4x6.4 mm2; matrix=96x96; in-plane resolution=67x67 μm2; slice thickness=500 μm; maximum velocity encoding (Venc)=0.91-1.58 cm/s which resulted in an approximate acquisition time of 12 minutes(the total TR for each 2D image is 4s). To measure the blood flow velocity, bipolar flow encoding gradients were applied along the slice encoding direction. The slice position was anatomically identical to the slice position of the MGE imaging.
Data Analysis: The seed-based voxel-wise correlation map was created using Analysis of Functional NeuroImages (AFNI). Welch’s power spectrum density plot was calculated from arteriole and venule voxels with averaged periodogram method. The sampling rate of resting-state CBFv fMRI signal is 4s, allowing the analysis of low-frequency signal oscillation less than 0.125 Hz.
RESULTS
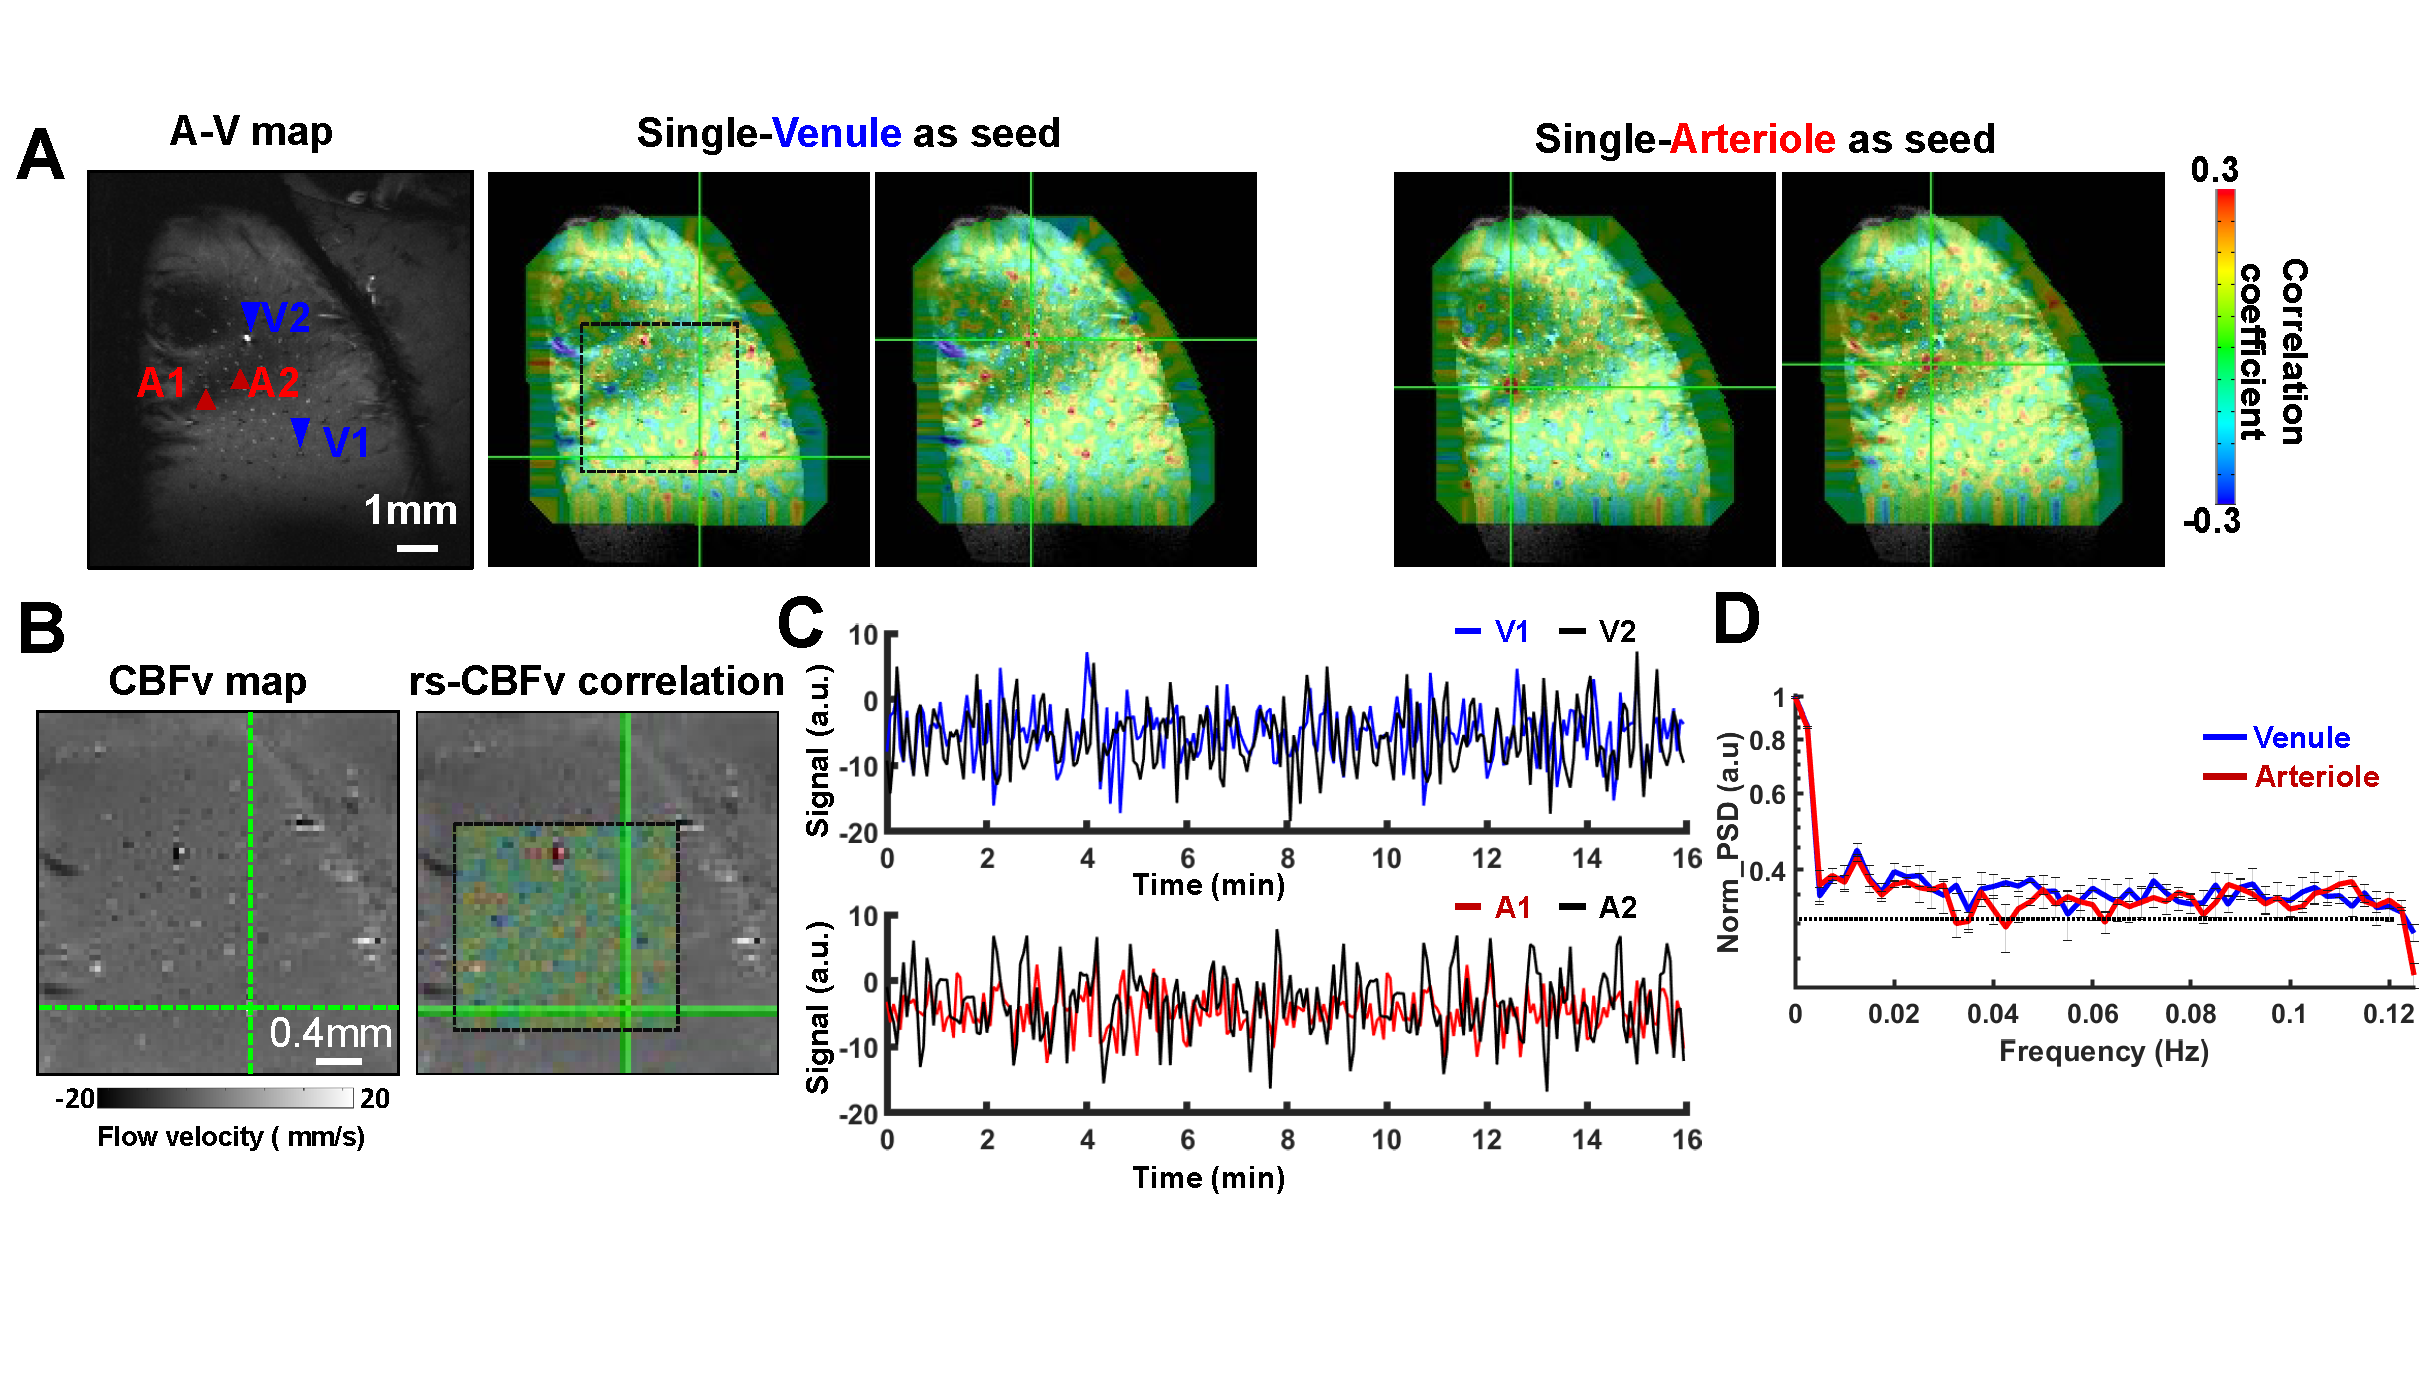
By implementing a focal RF coil with the high field MR scanner, we are able to map the velocity changes from individual penetrating arterioles and venules with the diameter from 20 to 70 µm. The arteriole-venule (A-V) map shows bright dots as arterioles and dark dots as venules from one representative rat (Fig 1A). The seed-based correlation maps were overlapped on the A-V map to show the venule-based correlation map exhibits positive correlation to other venules, but negative correlation with arterioles during the resting-state. Similarly, the arteriole-based correlation map shows a positive correlation to other arterioles, but a negative correlation with venules. The anti-correlation between arterioles and venules is because of the vectorized CBFv values from venules and arterioles with opposite signs (Fig 1B). The normalized time courses extracted from venule and arteriole voxels showed the low-frequency signal fluctuation (Fig 1C) and the power spectrum density (PSD) plot of resting-state CBFv dynamics from arteriole and venule voxels revealed higher power from 0.01 to 0.04 Hz (Fig 1D).CONCLUSIONS
Our work demonstrates a novel method for noninvasive single-vessel CBFv dynamic mapping. The CBFv signal fluctuation was directly characterized across different arterioles and venules, expanding the rs-fMRI single vessel mapping scheme toward flow-related velocity mapping.Acknowledgements
This work was supported by NIH grant RF1NS113278, R01NS120594, S10MH124733, R21NS121642, R01MH111438, and NSF grant 2123971.References
1. Biswal, B., Yetkin, F. Z., Haughton, V. M. & Hyde, J. S. Functional connectivity in the motor cortex of resting human brain using echo-planar MRI. Magn Reson Med 34, 537-541, doi:10.1002/mrm.1910340409 (1995).
2. Yu, X. et al. Sensory and optogenetically driven single-vessel fMRI. Nature methods 13, 337-340, doi:10.1038/nmeth.3765 (2016).
3. He, Y. et al. Ultra-Slow Single-Vessel BOLD and CBV-Based fMRI Spatiotemporal Dynamics and Their Correlation with Neuronal Intracellular Calcium Signals. Neuron 97, 925-939 e925, doi:10.1016/j.neuron.2018.01.025 (2018).
4. Chen, X. et al. Assessment of single-vessel cerebral blood velocity by phase contrast fMRI. PLoS Biol 19, e3000923, doi:10.1371/journal.pbio.3000923 (2021).
Figures