2410
Metabolic bone response to exercise loading is predictive of joint degeneration after 2 years in OA knees
Janelle Baker1, James MacKay2, Feliks Kogan3, and Lauren Watkins3,4
1Biomechanical Engineering, Stanford University, Stanford, CA, United States, 2Radiology, Cambridge University, Cambridge, United Kingdom, 3Radiology, Stanford University, Stanford, CA, United States, 4Steadman Philippon Research Institute, Vail, CO, United States
1Biomechanical Engineering, Stanford University, Stanford, CA, United States, 2Radiology, Cambridge University, Cambridge, United Kingdom, 3Radiology, Stanford University, Stanford, CA, United States, 4Steadman Philippon Research Institute, Vail, CO, United States
Synopsis
Hybrid [18F]sodium fluoride PET-MRI was used to evaluate the relationship between the bone metabolic response to exercise and joint changes over two years in osteoarthritic (OA) knees, including changes in cartilage T2 relaxation times as well as structural changes in bone and cartilage. Regions in OA knees that experienced structural changes over two years had increased PET metabolic bone response to exercise compared to regions that did not. Bone response to exercise may be a useful metric to predict joint changes in OA.
Introduction
Osteoarthritis (OA) is a degenerative joint disease characterized by degradation of articular cartilage and structural changes in subchondral bone that lead to unusual loading and mechanical stress on the joint. Once cartilage loss and bone structural changes are detected on MRI, they are practically irreversible. Quantitative MRI techniques such as elevated T2 relaxation times have been used to detect cartilage degradation prior to volumetric loss1. Additionally, unusual mechanical loading after an exercise intervention can be detected using [18F]sodium fluoride PET imaging, as increased standard uptake values (SUV) correspond to increased bone metabolism2. These techniques are promising to help detect and understand early mechanisms contributing to OA progression. In this work, we use hybrid PET-MRI to evaluate the relationship between subchondral bone response to exercise and joint changes over two years, including changes in cartilage T2 relaxation times and structural changes in bone and cartilage.Methods
Both knees of five subjects with knee osteoarthritis were scanned with a 3.0T PET-MR system. Two sets of images were taken, with a two-year gap between the initial and final visits (Figure 1). At the initial visit, subchondral bone response to exercise was assessed using [18F] sodium fluoride ([18F]NaF) uptake. Upon injection of a 2.5 mCi dose of [18F]NaF, PET and bilateral MRI data were obtained over 50 minutes. Subjects then performed a single-leg squat exercise, with the other leg supported (Figure 1). After the exercise, the PET-MRI scan was repeated. Two years later, only a single bilateral MRI scan was repeated. MRI sequences included a quantitative double-echo in steady-state (qDESS) sequence to assess cartilage T2 relaxation times3,6 and 2D FSE sequences for morphology. MRI Osteoarthritis Knee Score (MOAKS)4 assessment of each knee was performed by a musculoskeletal radiologist for both the initial and final scans.The change in the maximum standard uptake value (ΔSUVmax) associated with exercise was measured in bone regions representing the patella; medial and lateral tibia; and anterior, central, and posterior regions of the medial and lateral femur. The ΔSUVmax was compared between regions that experienced a MOAKS change after two years and regions that did not, using a Wilcoxon Rank Sum test (𝛂= 0.05). The femoral, tibial, and patellar cartilage were automatically segmented from qDESS images using a deep-learning based algorithm5 and manually corrected as necessary. The cartilage surfaces were divided into nine regions corresponding to the bone regions described above. The ΔSUVmax values at baseline were also compared to the change in cartilage T2 relaxation times over two years using a Spearman’s correlation coefficient in legs that exercised and those that rested (ρ, 𝛂= 0.05).
Results
A representative image of MOAKS progression and baseline SUV maps before and after exercise is shown in Figure 2. A difference in baseline ΔSUVmax was seen between regions that had a MOAKS change after two years and those that did not (Figure 3). Regions that had a MOAKS change had a mean ΔSUVmax of 3.29 after exercise, while regions that did not have MOAKS change had a mean ΔSUVmax of 2.16 (p = 0.08). There was a moderate positive correlation between ΔSUVmax and ΔT2 for the exercised legs (ρ = 0.459, p < 0.05) (Figure 4, left). A nonsignificant poor correlation was observed between ΔSUVmax and ΔT2 for the rested legs (ρ = -0.196, p = 0.198) (Figure 4, right).Discussion
This study showed that for osteoarthritic knees, in regions that experience MOAKS changes after two years, there is increased metabolic bone response to exercise at baseline compared to regions that do not have MOAKS progression, with this difference trending towards statistical significance in this small feasibility study.A moderate correlation was seen between ΔSUVmax and ΔT2 after two years for exercised OA knees, suggesting that a large metabolic bone response to loading is correlated with cartilage microstructure changes that are often used as early markers of cartilage degeneration. However, the observed ΔT2 was negative in numerous regions which was unexpected. This may be due to fibrosis and cartilage loss that was observed in several subjects at two years. No correlation between ΔSUVmax and ΔT2 was observed in the rested knees.
Prior studies suggest that this metabolic bone response is load-dependent. Thus, high [18F]NaF PET response to exercise may reflect joint dysfunction that is predictive of future joint degeneration. Further, larger studies evaluating an early OA cohort would be informative.
Conclusion
Subchondral bone response to exercise, as measured by the change in maximum standard uptake value of [18F]NaF, may be a useful metric to predict joint structural changes and cartilage degradation in OA knees after two years.Acknowledgements
This work was funded by research support from GE healthcare and NIH Grants R00EB022634, R21EB030180 and R01AR074492.References
- Liebl H, Joseph G, Nevitt MC, et al. Early T2 changes predict onset of radiographic knee osteoarthritis: data from the osteoarthritis initiative. Ann Rheum Dis. 2015;74(7):1353-1359. doi:10.1136/annrheumdis-2013-204157.
- Haddock, Fan, Uhlrich, Jorgensen, Suetta, Gold, Kogan. Assessment of acute bone loading in humans using [18F]NaF PET/MRI. European Journal of Nuclear Medicine and Molecular Imaging, 2019; 46(12):2452-2463.
- Sveinsson B, Chaudhari AS, Gold GE, Hargreaves BA. A Simple Analytic Method for Estimating t2 in the Knee from DESS. Magn Reson Imaging. 2017; 38: 63-70.
- Hunter, Guermazi, lo, Grainger, Conaghan, Boudreau, Roemer. Evolution of semiquantitative whole joint assessment of knee OA: MOAKS (MRI Osteoarthritis Knee Score). Osteoarthritis Cartilage, 2011; 19(8):990-1002.
- Desai A, Barbieri M, Mazzoli V, Rubin E, Black M, Watkins L, Gold G, Hargreaves B, Chaudhari A. DOSMA: A deep-learning, open-source framework for musculoskeletal MRI analysis (Version v0.0.9, prerelease). Zenodo. Feb 2019. https://doi.org/10.5281/zenodo.2559549.
- Kogan F, Levine E, Chaudhari AS, et al. Simultaneous bilateral-knee MR imaging. Magn Reson Med. 2018;80(2):529-537. doi:10.1002/mrm.27045.
Figures

Figure 1: Both knees of five subjects with knee OA were scanned twice at a baseline visit using hybrid [18F]NaF PET-MRI, both before and after performing a 1-legged squat exercise. An MRI-only scan was performed 2 years later. SUV was assessed in 9 bone regions before and after exercise. At both visits, MOAKS assessment was performed to note structural features in bone and cartilage, and a quantitative DESS sequence was used to assess T2 relaxation times in cartilage adjacent to the 9 bone regions.
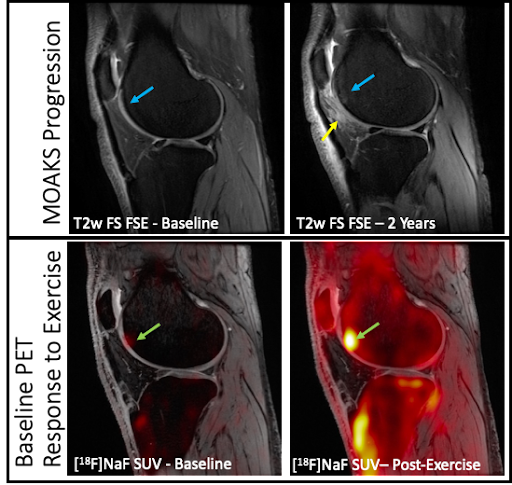
Figure 2: [Top] MRI at the time of the initial visit and two years later, demonstrating a small (Grade 1) bone marrow lesion (Blue Arrow), mild cartilage loss, and adjacent Hoffa synovitis (yellow arrow). [Bottom] SUV maps showing [18F]NaF uptake before and after exercise during the initial visit illustrate an area with a large change in uptake after exercise (green arrow). All other regions did not exhibit MOAKS progression over two years and had lower SUV changes after exercise at baseline.
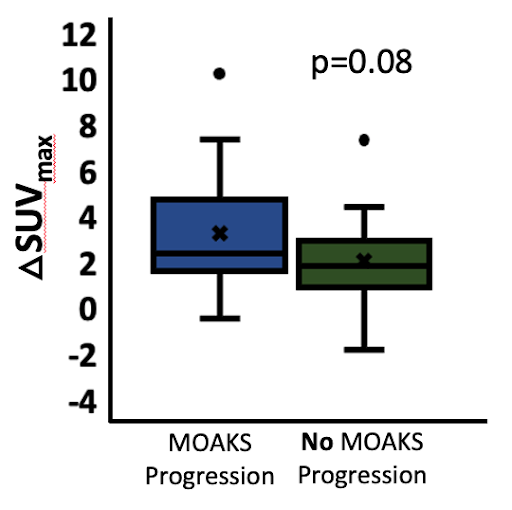
Figure 3: Bone regions that experienced MOAKS changes after two years had an increased metabolic bone response to exercise in comparison to regions that did not experience MOAKS progression after two years trending toward significance (p = 0.08).
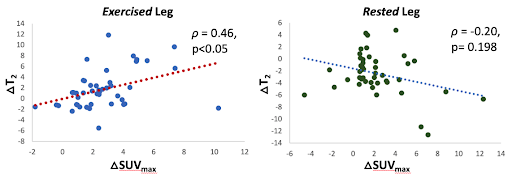
Figure 4: There was a moderate positive correlation observed between ΔSUVmax and ΔT2 for the exercised legs (left) and a nonsignificant poor correlation was observed between ΔSUVmax and ΔT2 for the rested legs (right).
DOI: https://doi.org/10.58530/2022/2410