2409
Infrapatellar fat pad is predictive of incident knee osteoarthritis one year prior to diagnosis: data from the osteoarthritis initiative
Jia Ying1, Keyan Yu2, Tianyun Zhao1, Xiaodong Zhang2, and Chuan Huang1,3
1Biomedical Engineering, Stony Brook University, Stony Brook, NY, United States, 2Medical Imaging, The Third Affiliated Hospital of Southern Medical University – Guangdong Academy of Orthopedics, Guangzhou, Guangdong, China, 3Radiology, Stony Brook Medicine, Stony Brook, NY, United States
1Biomedical Engineering, Stony Brook University, Stony Brook, NY, United States, 2Medical Imaging, The Third Affiliated Hospital of Southern Medical University – Guangdong Academy of Orthopedics, Guangzhou, Guangdong, China, 3Radiology, Stony Brook Medicine, Stony Brook, NY, United States
Synopsis
The infrapatellar fat pad (IPFP) plays an important role in the incidence of knee osteoarthritis (OA). However, whether the IPFP can serve as an independent biomarker for OA development is yet unknown. Radiomics is a powerful tool that can extract high-dimensional quantitative features for clinical outcomes. In this work, we proposed a prediction model for incident radiographic knee OA (iROA), using radiomic features of the IPFP, one year prior to diagnosis. The prediction performance was assessed, and our results from 604 knees demonstrated that MR-based radiomic features from the IPFP are predictive of iROA.
Purposes
The infrapatellar fat pad (IPFP), an intra-articular adipose tissue located posterior to the patella, can remarkably change the articular microenvironment and contributes to knee osteoarthritis (OA)1,2. However, whether the IPFP can serve as an independent biomarker for knee OA development is yet unknown. In recent years, radiomics has been shown to be a useful tool that enables high-dimensional quantitative image features to be extracted and subsequently selected for improved decision support3,4. Therefore, in order to investigate whether the IPFP has the ability to anticipate incident radiographic knee OA (iROA), we propose a prediction model using MR-based radiomic features extracted from the IPFPs one year prior to clinical diagnosis.Methods
Data used in this work were obtained from the international database Osteoarthritis Initiative (OAI). Intermediate-weighted turbo spin-echo sequence (IW-TSE) knee images were acquired on 3T MRI scanners (Magnetom Trio, Siemens, Erlangen, Germany). Images of time points for iROA and one year prior to iROA were obtained. iROA was defined as a knee at enrollment with Kellgren–Lawrence grade (KLG) of 0 or 1 which further developed KLG ≥ 2 at the 48-month follow-up visit. Five clinical characteristics - age, sex, body mass index (BMI), knee injury times, and knee surgery history, were obtained from the dataset. A total of 604 knees were included to build the prediction model (302 cases and 302 controls), wherein one case was a knee diagnosed with iROA while one control was a knee without iROA.In order to automatically segment regions-of-interest (ROIs) (i.e., IPFP regions), a 2.5D U-Net model5 trained using an independent ROI training set was applied. Radiomics features were extracted from the U-Net generated ROIs using LIFEx v6.446. After the feature extraction, the knees were randomly divided into a training set (~60%, 362 knees) and a testing set (~40%, 242 knees) for model generation and testing.
Feature reduction was conducted using the training set. First, a Mann-Whitney U-test was used to find significantly different features (P < 0.05). Next, to remove redundant features, each group exhibiting a high Spearman correlation coefficient (Spearman |ρ| ≥ 0.8) was replaced by the one with the highest area under the receiver operating characteristic (ROC) curve (AUC). The remaining features, along with the five clinical characteristics, were used as the input for the feature selection step. The least absolute shrinkage selection operator (LASSO) regression model, with three-fold cross-validation, was applied to select the most important features. The selected features were then used to generate logistic regression models to predict iROA after one year. The optimal threshold for the model was determined by maximizing the Youden’s index (sensitivity + specificity – 1). Finally, the following three models were generated: 1) clinical characteristics only, 2) radiomic features only, and 3) combined features.
The prediction performances, for predicting iROA after one year across all three models, were assessed using the testing set by comparing the corresponding AUC, sensitivity, specificity, and accuracy. The DeLong test was used to compare the ROCs.
Results
A total of 699 radiomic features were extracted. Ten out of the 699 radiomic features, including 5 first-order features and 5 texture features, were selected in the radiomic model. Table 1 summarizes the selected predictive features for each model.The prediction performances of each model, using the features one year prior to iROA diagnosis, were shown in Table 2 and Figure 1. Among the three prediction models, the radiomic features only model and the combined model have yielded superior AUCs (0.700 and 0.702, respectively).
The DeLong test found no statistically significant difference between the ROCs of the radiomic model and the combined model (p = 0.831); however, a significant difference was observed when comparing the clinical only model with the radiomic or combined model (p = 0.014 and 0.004, respectively).
Discussion
Among the three models, the combined model yielded the best performance in predicting iROA one year prior to diagnosis. The radiomic features only model offers comparable performance; even though its performance was slightly inferior to the combined one, this difference was not found to be statistically significant. The results demonstrate that the radiomic features of IPFP are predictive of iROA.Radiomic features are difficult to perceive with the naked eye; however, they contain important information about the IPFP. All radiomic predictors selected by our regression model were signal intensity heterogeneity features, suggesting that signal intensity abnormalities play a very important role in iROA development. Although it has been shown that IPFP shape alteration is associated with structural change and pain in knee OA7,8, patients are usually asymptomatic before they were diagnosed with iROA as such only very minor wear and tear are developed in the knee joints. At this time, IPFP signal intensity alterations might be able to provide more information. Radiomics can provide readily mineable features and our results have shown that the radiomic model yields promising performance in this prediction task.
Conclusion
In this work, we showed that radiomic analysis of the IPFP can predict incident radiographic knee OA one year prior to the diagnosis. This finding demonstrates that radiomic features of the IPFP can serve as early quantitative imaging markers for incident radiographic knee OA.Acknowledgements
No acknowledgement found.References
- Zeng N, Yan ZP, Chen XY, et al. Infrapatellar Fat Pad and Knee Osteoarthritis. Aging Dis. 2020;11:1317-1328.
- Favero M, El-Hadi H, Belluzzi E, et al. Infrapatellar fat pad features in osteoarthritis: a histopathological and molecular study. Rheumatology (Oxford). 2017;56:1784-1793.
- Lambin P, Rios-Velazquez E, Leijenaar R, et al. Radiomics: extracting more information from medical images using advanced feature analysis. Eur J Cancer 2012;48(4):441–446.
- Lambin P, Leijenaar RT, Deist TM, et al. Radiomics: the bridge between medical imaging and personalized medicine. Nat Rev Clin Oncol. 2017;14(12):749–762.
- Spuhler K, Ding J, Altbach M, et al. Deep learning-based whole breast segmentation to support automated breast density measurements from fat-water decomposition MRI. ISMRM 2019.
- Garriga C, Sanchez-Santos MT, Judge A, et al. Predicting Incident Radiographic Knee Osteoarthritis in Middle-Aged Women Within Four Years: The Importance of Knee-Level Prognostic Factors. Arthritis Care Res (Hoboken). 2020;72:88-97.
- Masaki T, Takahashi K, Hashimoto S, et al. Volume change in infrapatellar fat pad is associated not with obesity but with cartilage degeneration. Journal of Orthopaedic Research®. 2019;37(3):593-600.
- Cowan SM, Hart HF, Warden SJ, et al. Infrapatellar fat pad volume is greater in individuals with patellofemoral joint osteoarthritis and associated with pain. Rheumatology international. 2015;35(8):1439-42.
Figures

Table 1. Selected predictive features for the three prediction models

Table 2. Prediction performance on the training and testing sets
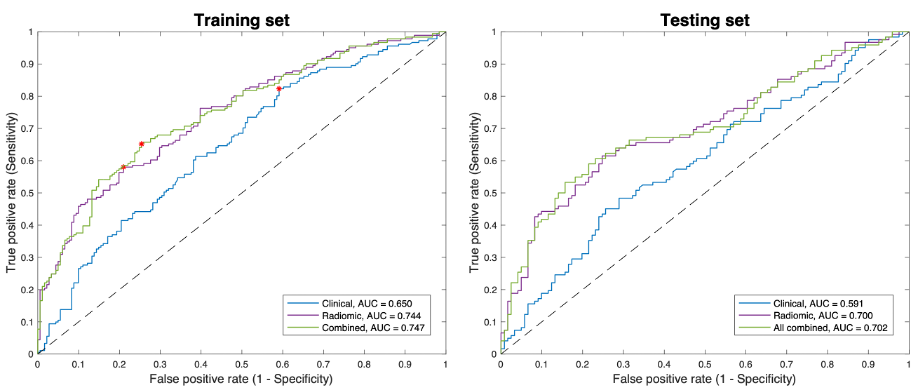
Figure 1. ROC curves of the training and testing sets for the three models. The red points shown in the training set are the optimal thresholds determined using the Youden’s index. The DeLong test found no statistically significant difference between the ROCs of the radiomic model and the combined model (p = 0.831); while a significant difference was observed when comparing the clinical model with the radiomic or combined model (p = 0.014 and 0.004, respectively).
DOI: https://doi.org/10.58530/2022/2409