2408
Knee cartilage radiomics biomarkers are associated with osteoarthritis pain phenotypes1NIHR Nottingham Biomedical Research Centre, University of Nottingham, Nottingham, United Kingdom, 2Radiological Sciences, University of Nottingham, Nottingham, United Kingdom, 3Nuffield Department of Orthopaedics, Rheumatology and Musculoskeletal Sciences, University of Oxford, Oxford, United Kingdom, 4Department of Sports Medicine, University of Nottingham, Nottingham, United Kingdom, 5Centre for Sport, Exercise and Osteoarthritis Research Versus Arthritis, University of Oxford, Oxford, United Kingdom
Synopsis
Pain is a hallmark of knee osteoarthritis, a chronic condition with considerable health and socio-economic burden. Phenotyping this heterogeneous disease is a step towards improved and personalised treatment, and long-term pain phenotypes based on latent class trajectory analysis and knee MRI may facilitate it. In this study, we aimed to examine the correlation between baseline knee cartilage MRI features with established 9-year pain trajectories. Using data from the Osteoarthritis Initiative (n = 9385, 9-year follow-up), we demonstrated a weak correlation between knee cartilage, pain scores and pain trajectories and significant differences in cartilage radiomics between the knee pain trajectories.
Introduction
Pain is the primary symptom and descriptor of osteoarthritis (OA), a chronic and prevalent disease with substantial global effects on disability, morbidity, and cost. (1). OA is a heterogeneous disease in terms of symptomatology and response to available treatments, requiring patient-centred research and a personalised approach (2). Also, it is a whole joint disease, with significant research and novel treatments focused on cartilage damage and repair. Knee cartilage has often been used as an outcome marker for clinical trials (3,4), but the outcome measures have only shown a limited association with the main symptom - knee pain (5). However, novel MRI knee cartilage assessments, i.e., radiomics, might be more suitable imaging biomarker candidates for selecting patients most likely to benefit from specific treatment options. Thus, we aimed to evaluate the relationship between baseline knee cartilage radiomics and long-term knee pain trajectories, previously identified by patient-centred latent class analysis.Method
We utilised the Osteoarthritis Initiative study data and previously identified knee pain trajectories (6). Briefly, group-based trajectory modelling (latent class growth analysis) was used to identify left and right knee pain trajectories based on annually repeated pain assessments over a 9-year follow-up (6). The pain was assessed by the valid and reliable Western Ontario and McMaster Universities Osteoarthritis Index (WOMAC) pain subscale (7). Here, we also used baseline WOMAC pain for cross-sectional assessment. We performed automated knee cartilage segmentation using an ensemble of convolutional neural U-nets (8). A total of 487 radiomic features from the Image Biomarker Standardisation Imitative (9) were extracted for each cartilage label, including lateral and medial tibial cartilage and meniscus, patella cartilage and femoral cartilage. We used cartilage volume and 3D run length variance for each anatomical location as cartilage radiomics biomarkers. We calculated Pearson’s correlation coefficient between cartilage variables with baseline WOMAC pain and pain trajectories. We tested for any significant differences in correlation coefficients for both radiomic biomarkers using Fisher r-to-z transformations. Further, we examined the differences of cartilage radiomics biomarkers between pain trajectory groups using analysis of variance and Tukey-Kramer multi-comparison correction.Results
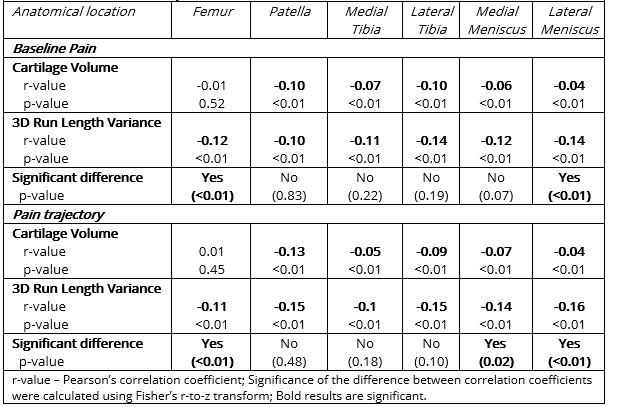
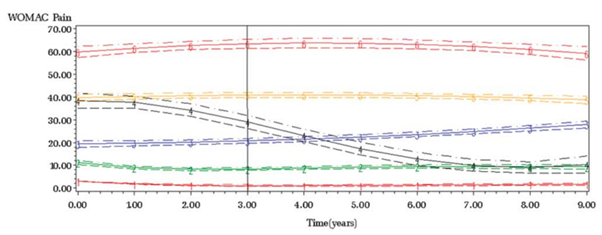
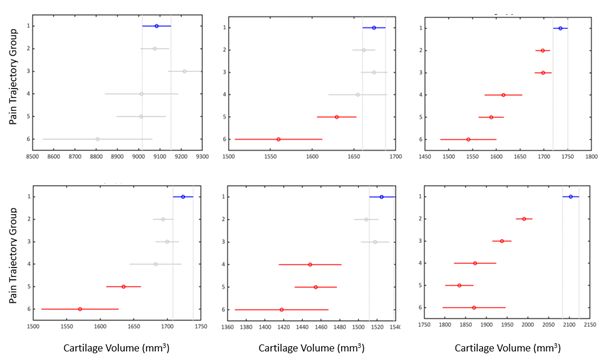
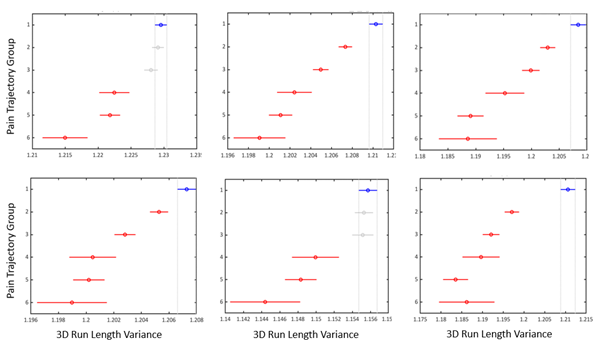
The OAI study involved 4796 participants, and here, we included 9385 (left and right) knees with available and suitable MRI data. There were six previously identified pain trajectory-groups for each knee (Figure 1); the first group (reference) presented no pain phenotype, the second had low-fluctuating pain phenotype, the third mild-increasing, the fourth and fifth had moderate-treatment-sensitive pain, and the sixth group was severe-treatment-insensitive pain phenotype. The reliability of group-based trajectories indicated by posterior probabilities was very good, ranging from 0.80 to 0.90. We found a weak correlation between all 3D run length variance variables with baseline WOMAC knee pain. Furthermore, a positive association was found between all 9-year pain trajectories and cartilage volume radiomics, except femoral (Table 1). Correlation coefficients of baseline pain and pain trajectories with cartilage 3D run length variance of the femur and lateral meniscus and pain trajectory and medial meniscus were significantly different from the correlation coefficients of the same location cartilage volume and pain variables. We observed significant differences in cartilage volume and 3D run length variances between no pain phenotype and different knee pain trajectories, with the lateral tibia and patella variables showing the most consistent differences (Figures 2 and 3).Discussion
We found that knee cartilage radiomics can differentiate long-term knee pain phenotypes to some extent. Cartilage is a non-innervated tissue of the osteochondral structure. Presumably, the level of cartilage damage corresponds to the intensity of pain by sensitising other innervated joint structures, either the denuded bone directly or other joint structures indirectly by degradation products. Radiomics variables like cartilage volume and volume texture parameter (3D run length variance) are assumed to capture the cartilage damage and perform better as imaging biomarkers of OA than the earlier used ones. We observed a weak correlation with cross-sectional and longitudinal pain outcomes, with volume texture showing a slightly stronger correlation than the volume. Also, cartilage volume had higher variance (wider confidence intervals) than the volume texture at all anatomical sites and increasingly with the severity of the pain phenotype. We discriminated knee pain phenotypes from the no pain phenotype, particularly in the patella and lateral tibial cartilage. Overall, it demonstrates the potential of knee cartilage radiomics to differentiate clinical OA phenotypes that should be further explored for personalised medicine purposes.Conclusion
In this study, we demonstrated the relationship between baseline MRI knee cartilage features and long-term knee OA pain trajectories, and consequently, the potential of cartilage radiomics for personalised medicine in OA.Acknowledgements
Data and/or research tools used in the preparation of this manuscript were obtained and analyzed from the controlled access datasets distributed from the Osteoarthritis Initiative (OAI), a data repository housed within the NIMH Data Archive (NDA). OAI is a collaborative informatics system created by the National Institute of Mental Health and the National Institute of Arthritis, Musculoskeletal and Skin Diseases (NIAMS) to provide a worldwide resource to quicken the pace of biomarker identification, scientific investigation and OA drug development.References
1. Hunter DJ, Bierma-Zeinstra S. Osteoarthritis. Vol. 393, The Lancet. Lancet Publishing Group; 2019. p. 1745–59.
2. Hunter DJ, Bowden JL. Therapy: Are you managing osteoarthritis appropriately? . Vol. 13, Nature Reviews Rheumatology. Nature Publishing Group; 2017. p. 703–4. Available from: https://pubmed.ncbi.nlm.nih.gov/28931953/
3. Karsdal, M. A, et al. treatment of symptomatic knee osteoarthritis with oral salmon calcitonin: results from two phase 3 trials. Osteoarthr Cartil. 2015 Apr 1; 23(4):532–43. Available from: https://pubmed.ncbi.nlm.nih.gov/25582279/
4. McAlindon, Timothy E, et al. Effect of Intra-articular Triamcinolone vs Saline on Knee Cartilage Volume and Pain in Patients With Knee Osteoarthritis: A Randomised Clinical Trial. JAMA. 2017 May 16; 317(19):1967–75. Available from: https://pubmed.ncbi.nlm.nih.gov/28510679/
5. Hunter DJ, March L, Sambrook PN. The association of cartilage volume with knee pain. Osteoarthr Cartil. 2003 Oct 1;11(10):725–9.
6. Radojčić MR, Arden NK, Yang X, Strauss VY, Birrell F, Cooper C, et al. Pain trajectory defines knee osteoarthritis subgroups: a prospective observational study. Pain [Internet]. 2020 Dec 1;161(12):2841. Available from: https:/pmc/articles/PMC7654950/
7. Physiotherapy IA-AJ of, 2009 undefined. Western ontario and mcMaster universities osteoarthritis index (WOMAC). core.ac.uk. 2009; Available from: https://core.ac.uk/download/pdf/82202672.pdf
8. Peake EJ, Chevasson R, Pszczolkowski S, Auer DP, Arthofer C. Ensemble learning for robust knee cartilage segmentation: data from the osteoarthritis initiative. bioRxiv. 2020 Sep ; 2020.09.01.267872. Available from: https://doi.org/10.1101/2020.09.01.267872
9. Zwanenburg A, Leger S, Vallières M, Löck S. Image biomarker standardisation initiative. 2016 Dec 2; Available from: http://arxiv.org/abs/1612.07003
Figures