2407
Infrapatellar Fat Pad T2 values Associated with Fat Pad Scarring Severity in Individuals with Total Knee Arthroplasty1Department of Radiology, Hospital for Special Surgery, New York, NY, United States
Synopsis
The infrapatellar fat pad (IPFP) has been implicated as a source of pain after total knee arthroplasty (TKA), but regions close to metallic implants are susceptible to metal artifacts in MRI. Multi-acquisition variable-resonance image combination (MAVRIC) based T2 mapping technique can mitigate these artifacts. The goal of this study was to evaluate how T2 values of the IPFP vary with the degree of IPFP scarring. T2 values were shorter and displayed a wider range for individuals with more severe scarring. MAVRIC T2 mapping may be used as a quantitative biomarker of IPFP scarring.
Introduction
Over 600,000 total knee arthroplasties (TKAs) are performed annually in the US as of 2010, and this number is expected to increase exponentially.1 The infrapatellar fat pad (IPFP) has been implicated as a possible source of postoperative knee pain due to its substantial innervation and proximity to the synovial lining.2–4 TKA surgery can lead to chronic inflammation of the IPFP, which over time can develop into scar tissue.5 T2 mapping, a quantitative magnetic resonance (qMRI) technique, has been used to evaluate the IPFP in patients following anterior cruciate ligament reconstruction ,3 but its application to TKA patients is challenging due to the presence of metallic susceptibility artifact when using traditional fast-spin-echo based imaging techniques.6 Multi-acquisition variable-resonance (MAVRIC) based T2 mapping technique has been developed to mitigate these artifacts, allowing for enhanced detection of soft tissue around implants.7 How T2 values of the IPFP relate to IPFP scarring is currently unknown. Therefore, the objective of this study was to measure T2 values of the IPFP in patients with TKAs using a MAVRIC based T2 mapping technique and to determine if T2 values are related to the degree of IPFP scarring.Methods
This pilot study had local IRB approval and informed written consent was obtained. 22 patients with TKAs undergoing MRIs were sequentially recruited and scanned on clinical 1.5T scanners with an 8-channel phased-array knee coil (GE Healthcare, Waukesha, WI). Morphologic imaging8 and MAVRIC based T2 mapping images9 were acquired. The morphologic images were evaluated for the presence (present/not present) and global severity of fat pad scarring by a board-certified radiologist as: none, mild, moderate or severe. The full volume of the IPFP, as well as smaller defined regions of normal (3.4 mm3) and abnormal (3.4 mm3) IPFP regions were segmented from source T2 mapping images by the radiologist. T2 values in these regions were calculated on a pixel-by-pixel basis with a mono-exponential fit. Statistical Analysis: A one-way ANOVA was performed to evaluate differences of full volume IPFP T2 values by severity of fat pad scarring, with Tukey-adjusted post hoc comparisons to compare T2 values between groups. Paired t-tests were also performed to compare mean T2 values in the normal vs. abnormal regions within all subjects. In addition, the difference of mean T2 values between normal and abnormal subregions within each subject was calculated and evaluated across the level of IPFP scarring severity with a one-way ANOVA and appropriate post hoc comparisons. Finally, one-way ANOVAS with Tukey-adjusted post hoc comparisons were performed to evaluate differences of mean normal and abnormal region T2 values by severity of fat pad scarring. A significance level of p<0.05 was used for all analyses.Results
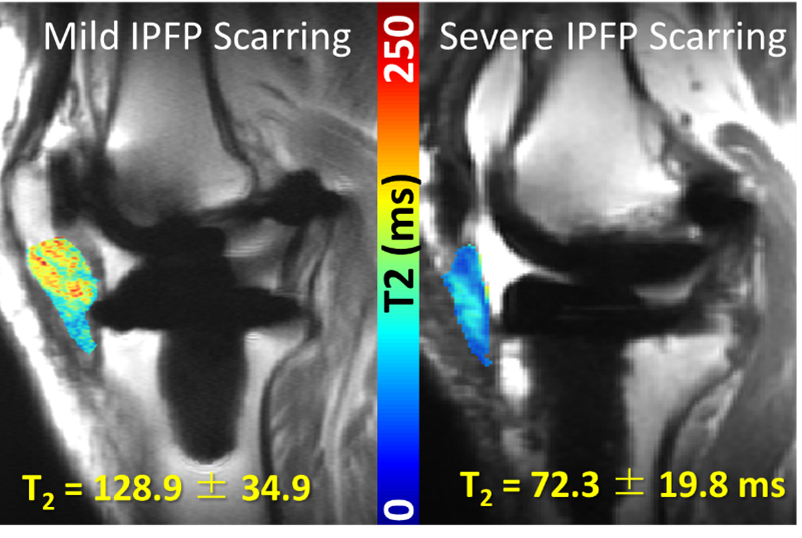
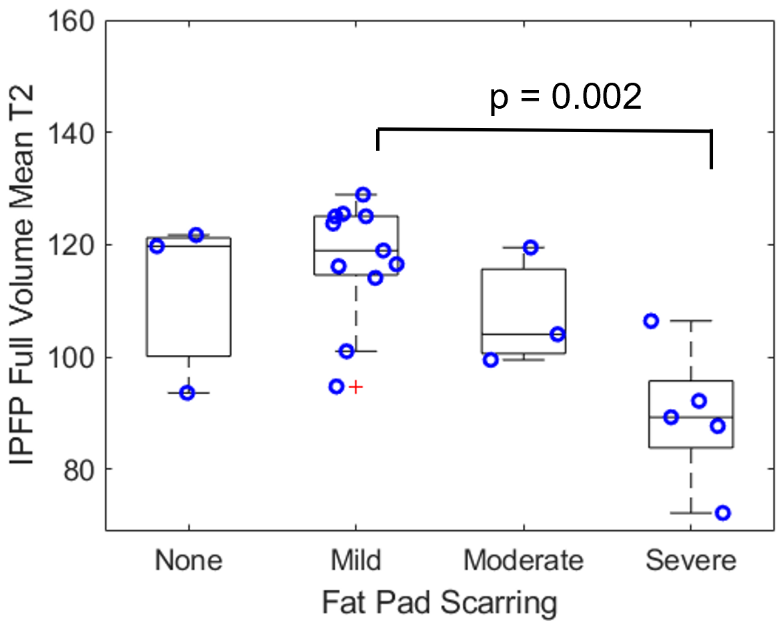
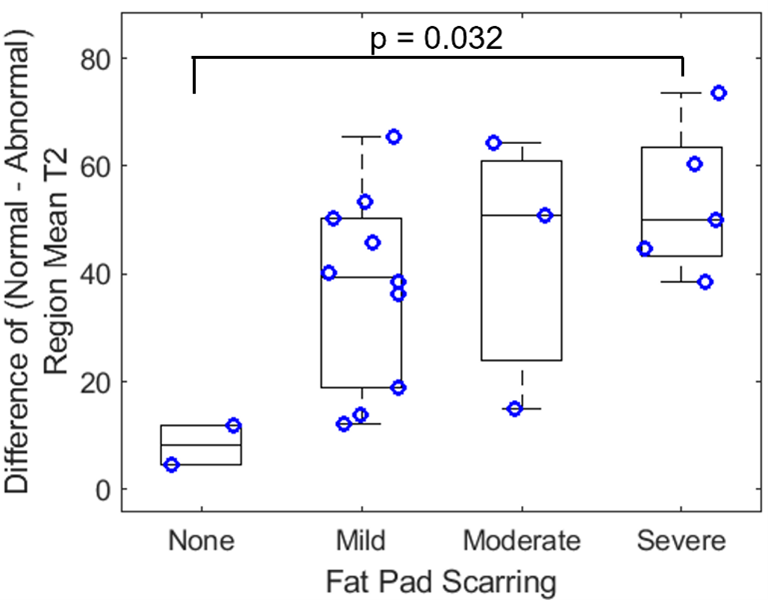
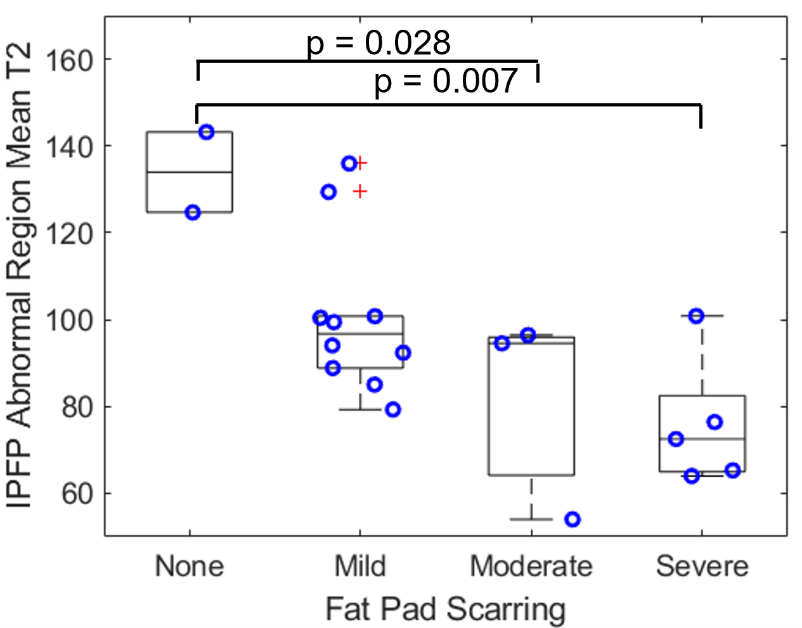
Mean full volume IPFP T2 values were shorter in patients with severe scarring as compared to those with mild scarring (23% reduction, p = 0.002, Figures 1, 2). T2 values were reduced in abnormal regions vs. normal regions within subjects (p < 0.0001). The difference between T2 values in abnormal regions vs. normal regions was greater in patients with severe scarring vs. patients with no scarring (551% increase, p = 0.032, Figure 3). The subregional analysis of the IPFP found that T2 values from the abnormal regions were significantly shorter in patients with global moderate and severe scarring as compared to patients with no global scarring (None vs. Moderate: 39% reduction, p = 0.028, None vs. Severe: 43% reduction, p = 0.007, Figure 4). No differences between T2 values in the normal regions between subjects were found.Discussion
This study evaluated the difference in T2 values of the IPFP with the degree of IPFP scarring in TKA patients using a MAVRIC based T2 mapping technique. This preliminary evaluation found significantly shorter global IPFP T2 values in patients with severe IPFP scarring, as compared to those with normal or mild scarring. These results are in line with previous findings of shorter IPFP T2 values associated with fibrosis found in knees following arthroscopic surgery.3 Reduced T2 values may be explained by increased tissue organization due to scar formation with lower tissue water content.3,10 Notably, the greater difference between T2 values of abnormal regions vs. normal regions in individuals with severe scarring compared to those with normal tissue may indicate increased tissue heterogeneity in the IPFP with increased scarring severity. Limitations of this study include limited patient enrollment and assessment of scarring on morphologic imaging without histological confirmation. Future work may include histological correlation following revision and patient-reported clinical outcomes. These results demonstrate the feasibility of using MAVRIC based T2 mapping to quantitatively evaluate post-arthroplasty IPFP scarring and fibrosis in individuals with TKAs.Significance/Clinical Relevance
MAVRIC based T2 Mapping may be used as a quantitative biomarker of post-operative IPFP scarring in patients following TKA. Longitudinal monitoring of IPFP T2 values may provide a means to assess the development and progression of IPFP scarring, a known complication following TKA implantation.Acknowledgements
Research reported in this abstract was partially supported by NIH/NIAMS under award number R01AR064840.References
1. Singh, J. A., Yu, S., Chen, L. & Cleveland, J. D. Rates of total joint replacement in the United States: Future projections to 2020-2040 using the national inpatient sample. J. Rheumatol. 46, 1134–1140 (2019).
2. Dragoo, J. L., Johnson, C. & McConnell, J. Evaluation and treatment of disorders of the infrapatellar fat pad. Sport. Med. 42, 51–67 (2012).
3. Torriani, M. et al. T2 relaxometry of the infrapatellar fat pad after arthroscopic surgery. Skeletal Radiol. 43, 315–321 (2014).
4. Maculé, F., Sastre, S., Lasurt, S., Sala, P., Segur, J.-M., Mallofré, C. Hoffa’s fat pad resection in total knee arthroplasty. Acta Orthop. Belg. 71, 714–717 (2005).
5. Murakami, S., Muneta, T., Ezura, Y., Furuya, K. & Yamamoto, H. Quantitative analysis of synovial fibrosis in the infrapatellar fat pad before and after anterior cruciate ligament reconstruction. Am. J. Sports Med. 25, 29–34 (1997).
6. Hargreaves, B. A. et al. Metal-induced artifacts in MRI. Am. J. Roentgenol. 197, 547–555 (2011).
7. Cheung, J. et al. Clinical Feasibility of Multi-Acquisition Variable-Resonance Image Combination–Based T2 Mapping near Hip Arthroplasty. HSS J. 17, 165–173 (2021).
8. Li, A. E. et al. MRI for the preoperative evaluation of femoroacetabular impingement. Insights Imaging 7, 187–198 (2016).
9. Bhave, S., Koff, M. F., Sivaram Kaushik, S., Potter, H. G. & Koch, K. M. 3D-multi-spectral T2 mapping near metal implants. Magn. Reson. Med. 82, 614–621 (2019).
10. Cameron, I. L., Ord, V. A. & Fullerton, G. D. Characterization of proton NMR relaxation times in normal and pathological tissues by correlation with other tissue parameters. Magn. Reson. Imaging 2, 97–106 (1984).
Figures