2406
Radiomic Variance within Soft Tissue Pathologies Near Total Hip Arthroplasty: A Cluster-based Analysis1Radiology, Medical College of Wisconsin, Milwaukee, WI, United States, 2Radiology and Imaging, Hospital for Special Surgery, New York City, NY, United States
Synopsis
In this exploratory study, radiomic measures were computed across radiologist-segmented image patches within 3D-MSI STIR images collected on symptomatic total hip replacements (THR). Utilizing radiologist classifications of normal, infection, polymeric wear, or metallosis debris for each image patch, principle-component based cluster analysis was deployed to visualize and estimate radiomic distinctions between different soft-tissue pathology classifications. The study results offer insights to future studies seeking to utilize quantitative MR to characterize and classify soft-tissue complications near THR.
Introduction
MRI is routinely utilized to differentiate soft tissue abnormalities such as metallosis, polymeric wear, and infection near total hip replacements (THR). Identifying the presence, location, and extent of these tissue abnormalities can substantially assist surgeons managing symptomatic THR patients. In this exploratory study, radiomic measures derived from the widely utilized PyRadiomics1 package were computed within radiologist-segmented pathological image patches near symptomatic THR. Utilizing radiologist classifications of each segment, principle-component based cluster analysis was deployed to visualize and estimate radiomic distinctions between different soft-tissue pathology classifications. These results offer insights to future studies seeking to utilize quantitative MR to characterize and classify soft-tissue complications near THR.Methods
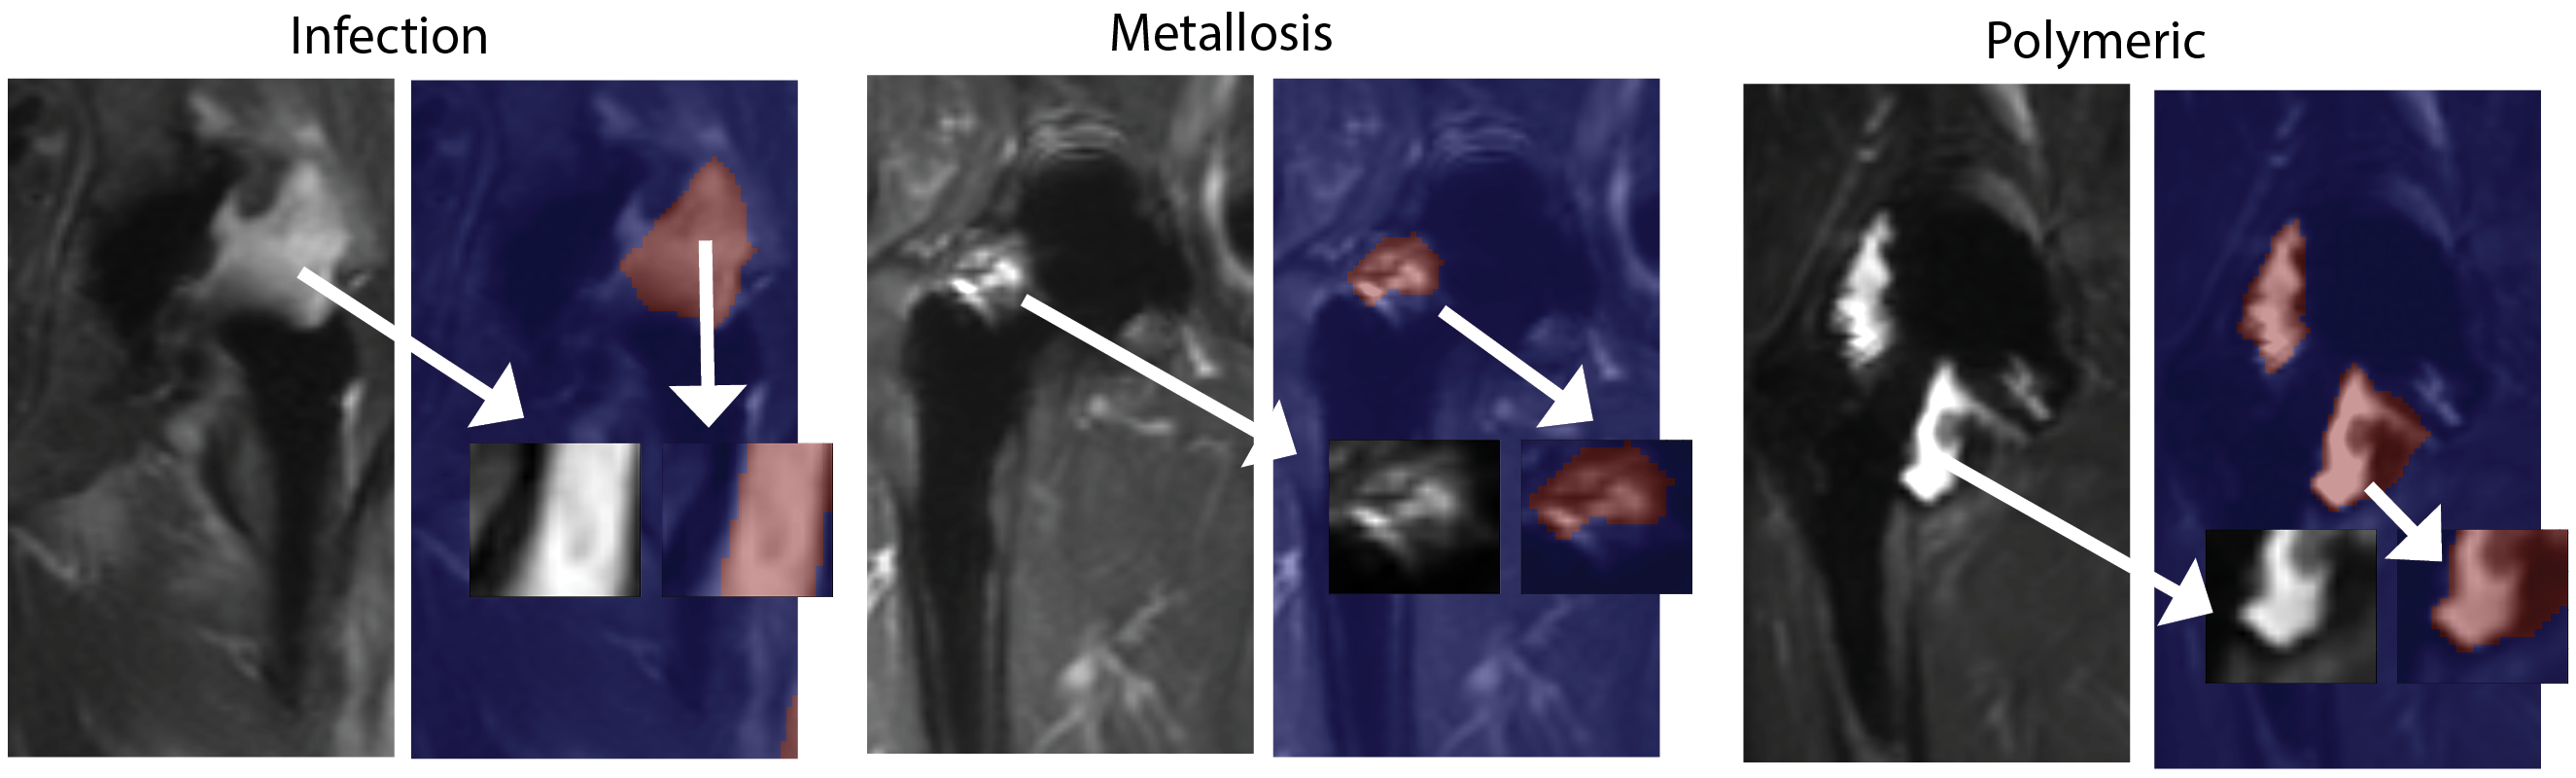
Subjects: Radiomic analyses were performed on 70 THR within 69 unique subjects. Subjects provided written consent into a local IRB-approved study. The study cohort included 28 males [age: 67.4±7.7 yrs] and 41 females [63.0±8.9 yrs].Image Acquisition and Analysis: MRI were collected at 1.5-T using 3D-MSI metal artifact reduction methods. Radiomic analysis was focused on the STIR-based 3D-MSI images. These coronal images were acquired with 0.78x1.56 mm in-plane resolution [zero-filled interpolated to 0.78x0.78] mm in 3.6 mm slice sections. Radiologist-based segmentations and synovial classifications were performed by two radiologists, one of which has over 20 years of experience in imaging near arthroplasty. Synovial classification definitions followed established paradigms2: normal -> thin capsule with low signal intensity3; metallosis -> low signal intensity deposits located in the capsular lining within the joint or in an extracapsular location, infection -> lamellated synovial lining with pericapsular edema4; and polymeric -> intracapsular foci of particulate, intermediate signal intensity debris2.
Radiomics: Within each coronal image dataset, 25x25mm patches were staggered throughout each synovial segmentation volume with 50% overlap. The python PyRadiomics package1 was utilized to develop a radiomic feature cascade for each 2D image patch. In total, 95 radiomic image features, including first order features (e.g. mean, median, skewness, etc.) and second order features (e.g. Gray Level Co-occurrence Matrix [GLCM] and the derived variables of autocorrelation, contrast, energy, entropy, etc.) were utilized for the present analysis.
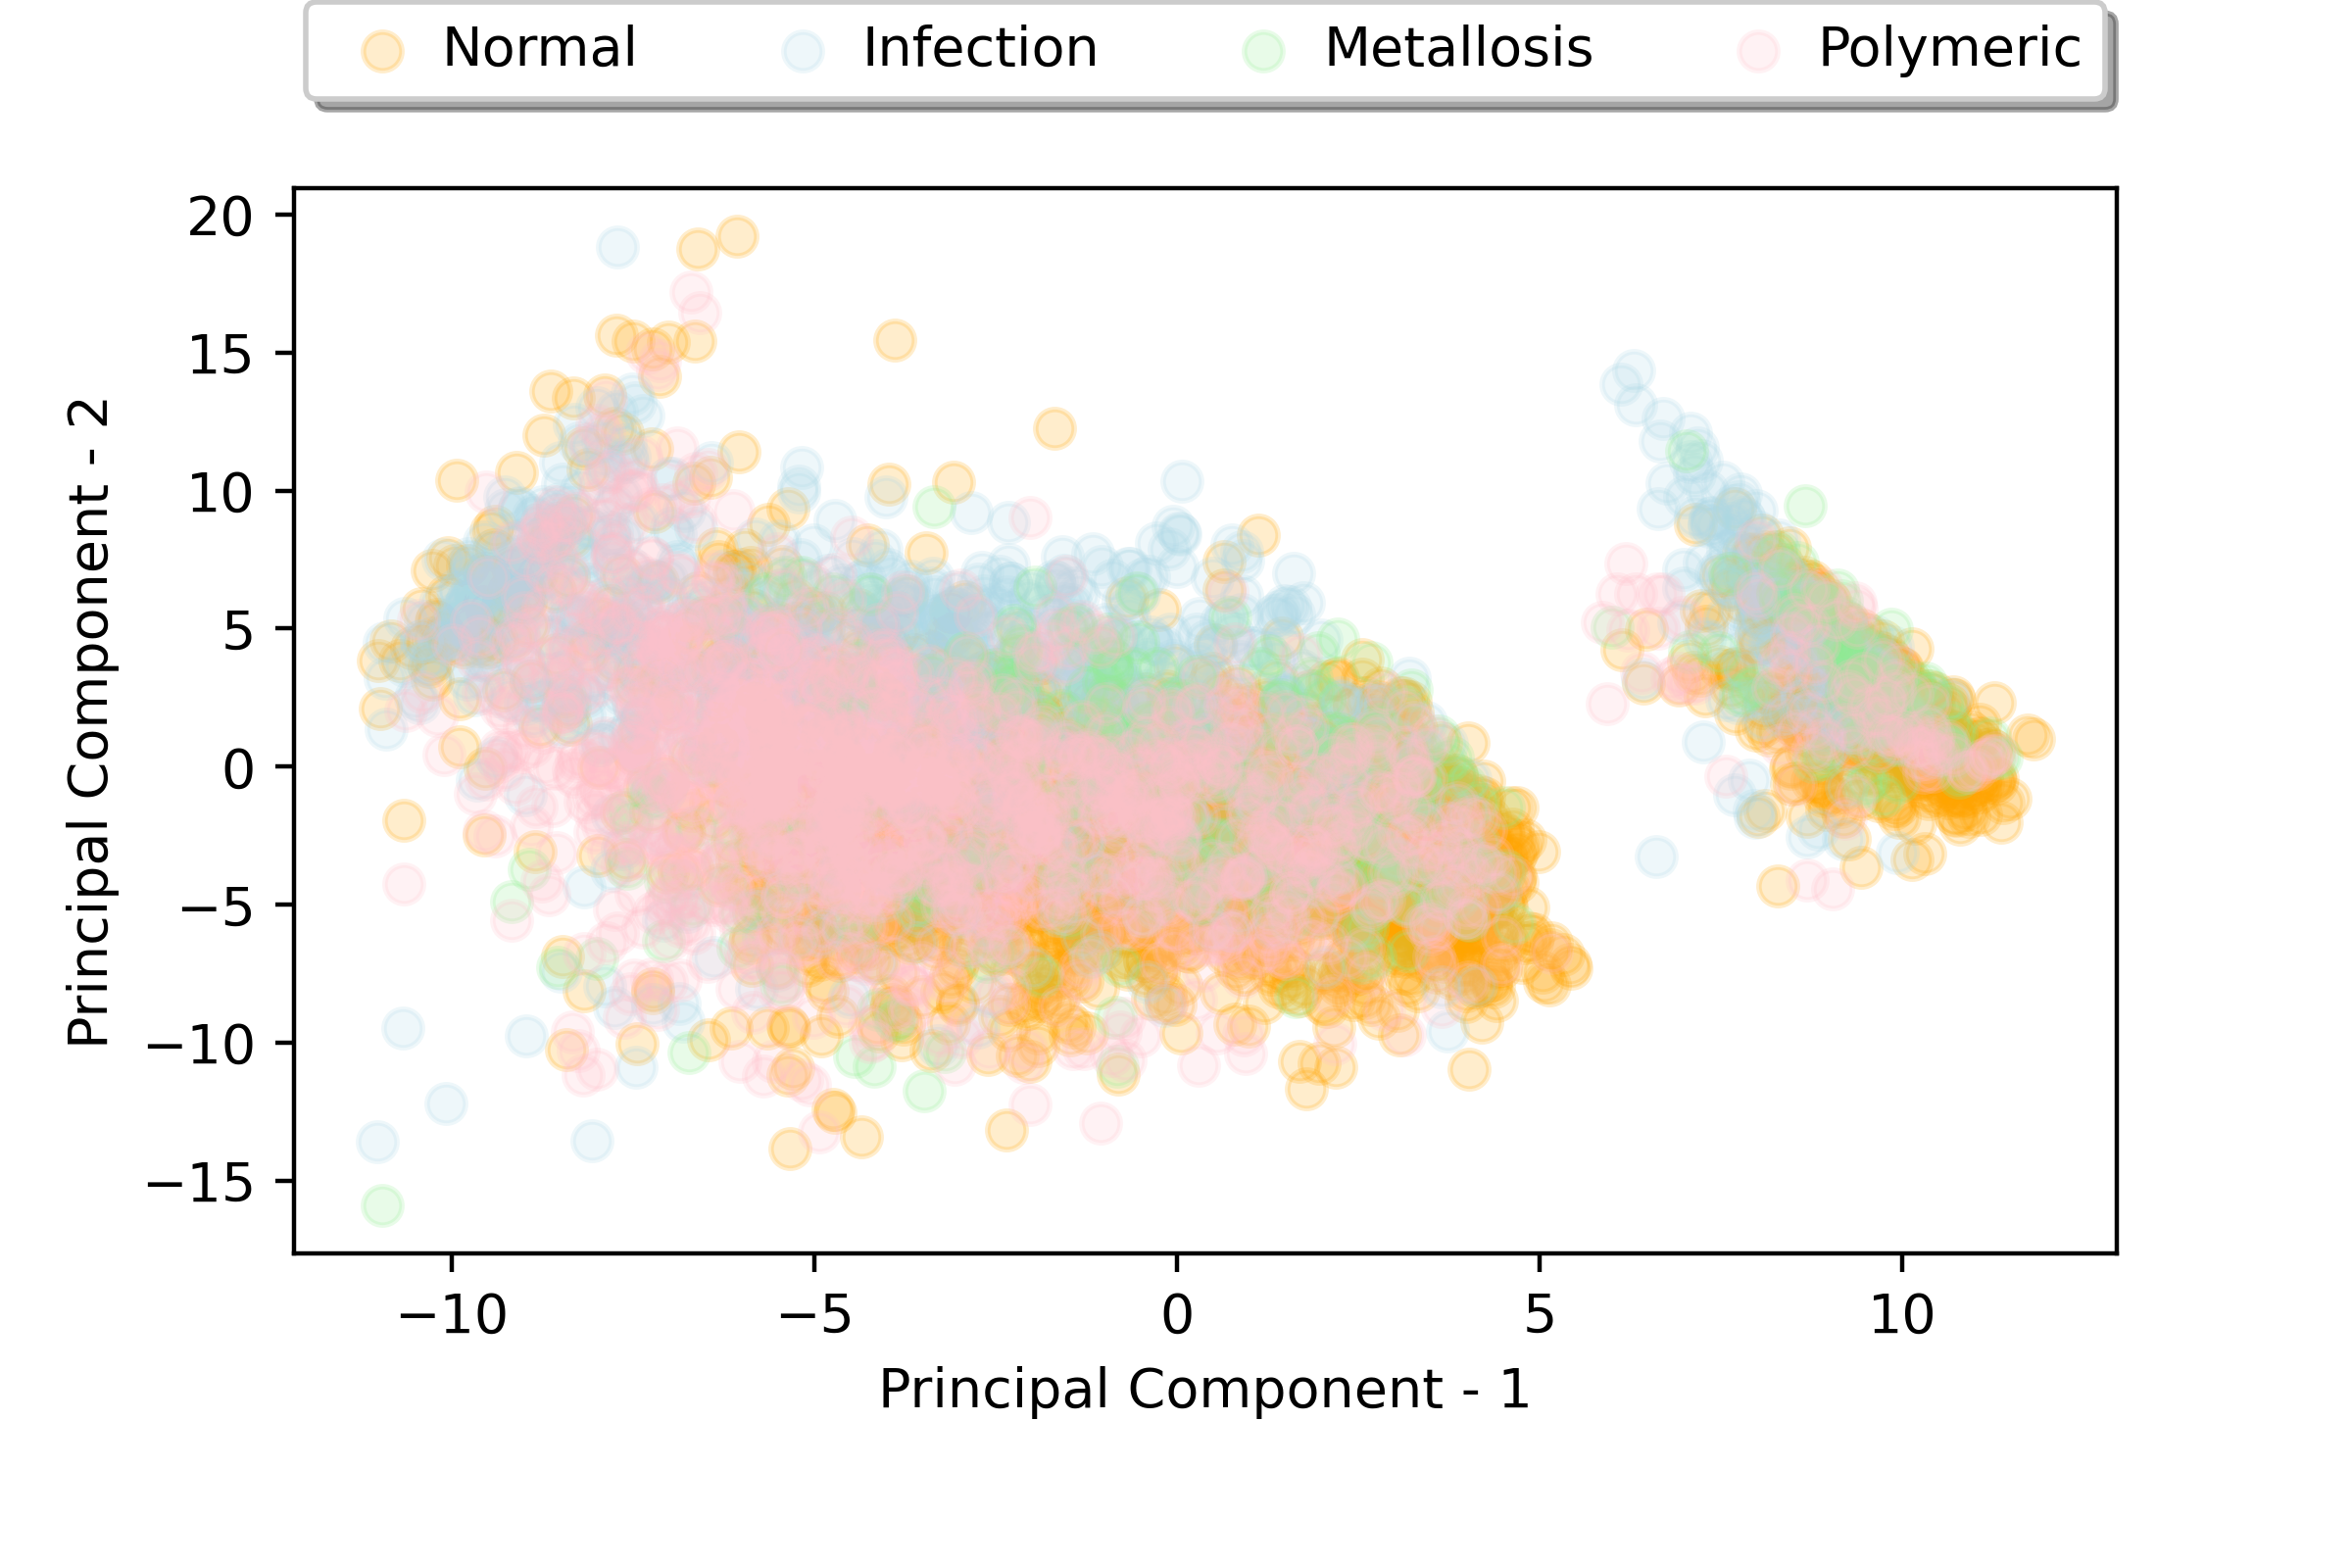
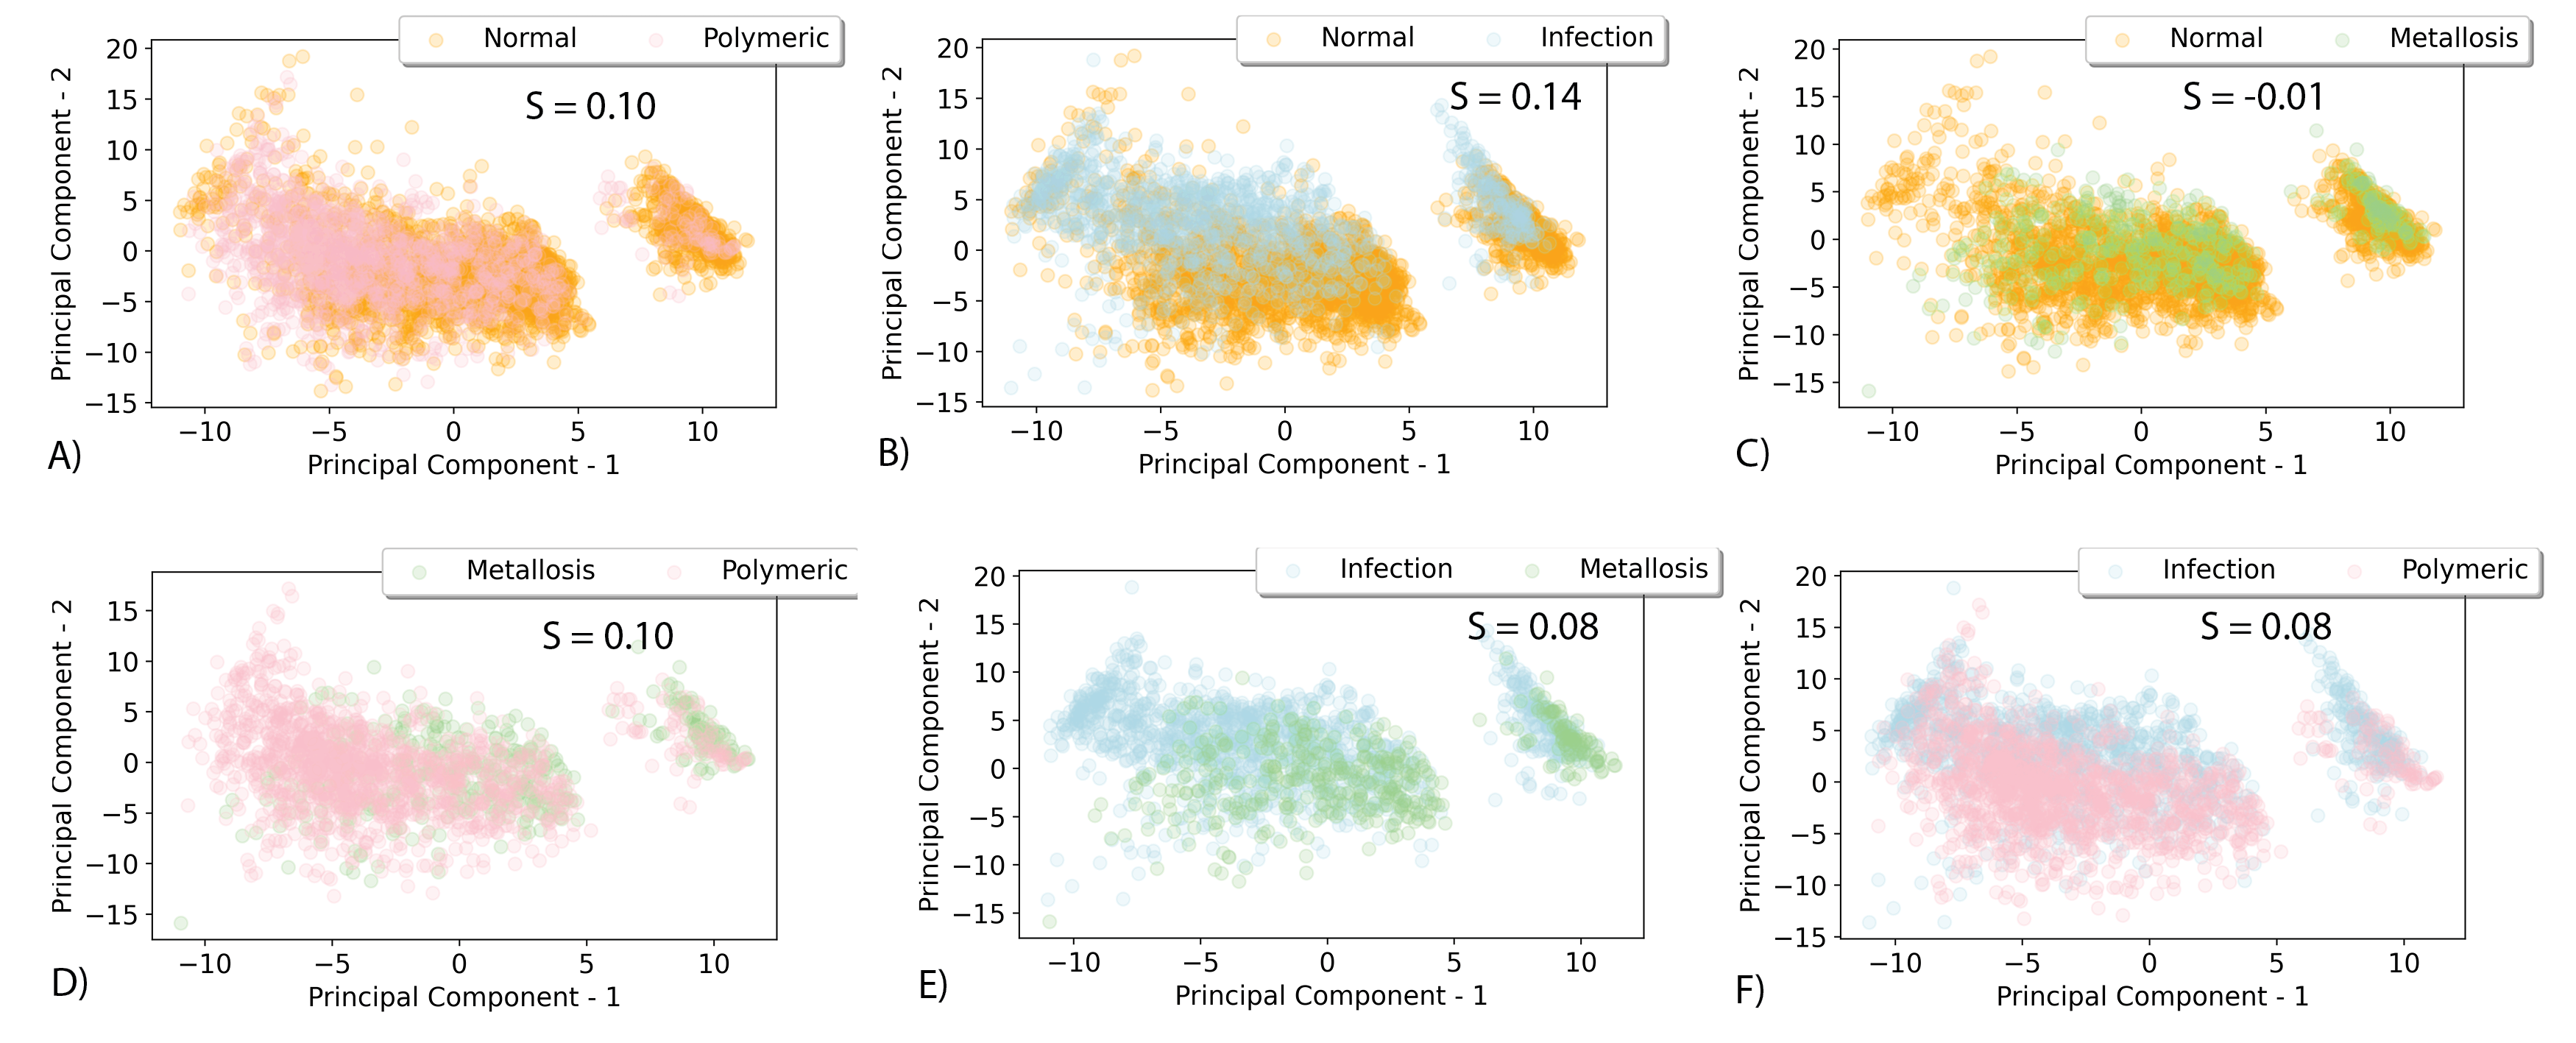
Cluster Analysis: PCA was deployed to construct two principle-component vectors from the full radiomic feature and patch cascade. These dimensionality-reduced vectors were utilized for cluster visualization and analysis. Grouped and paired classification cluster visualizations were analyzed and scored using the silhouette cluster definition metric5. In addition, unsupervised k-means clustering was performed and compared against the radiologist-based classifications. All analyses were performed using scikitlearn in python.
Results
5,789 patches were curated for radiomic analysis. Class balances were as follows: normal-2588, infection-1257, metallosis-449, and polymeric-1495. Figure 1 provides sample images and patches extracted for radiomic analyses, while Figure 2 provides the scatter plot of all classified patches in the PCA-decomposed radiomic feature space. Given the heavy overlap and lack of cluster definition of the full classification grid in Figure 2, Fig. 3 then presents a series of paired scatter plots used for interrogating the ability of the radiomic features to differentiate classes from one another. Each scatter plot also indicates the quantitative cluster-defintion silhouette score (s) pair of classes. The study results identified an elevated silhouette score, indicative of metric distinction, between infection vs normal the elevated distinction of infection vs normal (S=0.14) and polymeric vs metallosis (S=0.10). The unsupervised k-means clustering of the dimensionality-reduced dataset had limited agreement with the radiologist assigned classifications (adjusted rand and homogeneity indices of 0.076 and 0.074).Discussion
The results of this investigation have presented the raw capabilities and limitations of conventional cluster analysis algorithms using radiomic features derived from soft tissue pathologies collected near total hip replacements. Though the data demonstrated trending capabilities in distinguishing infection from normal tissue and metallosis from polymeric reactions, the dataset showed substantial overlap between the PCA-decomposed radiomic features, suggesting an inability to automatically classify the pathological patches. It may be anticipated that larger datasets alone will alleviate this practical limitation. This study displays that radiomic features of STIR MSI images near THR can offer distinctive information relating infection vs normal and polymeric vs metallosis pathology. As the presented cluster-based radiomic analysis was not able to differentiate synovial classifications using only STIR MSI images alone, future studies that incorporate such as T2 mapping6,7, diffusivity8, and metallosis measures9,10 may be beneficial for the quantitative metric cascades in soft-tissue pathology classification near THR.Acknowledgements
This research was supported by National Institute of Health (NIH) grant R01AR064840.References
[1 ] Van Griethuysen, Joost JM, et al. "Computational radiomics system to decode the radiographic phenotype." Cancer research 77.21 (2017): e104-e107.
[2] Koff, M. F.et al (2019). MRI of THA Correlates With Implant Wear and Tissue Reactions. Clinical Orthopaedics and Related Research, 477, 159–174.
[3] Potter HG et al. Magnetic resonance imaging after total hip arthroplasty: evaluation of periprosthetic soft tissue. J Bone Joint Surg Am. 2004;86:1947-1954.
[4] Plodkowski AJ, et al, Lamellated hyperintense synovitis: potential MR imaging sign of an infected knee arthroplasty. Radiology. 2013;266:256-260.
[5] Peter J. Rousseeuw (1987). “Silhouettes: a Graphical Aid to the Interpretation and Validation of Cluster Analysis” . Computational and Applied Mathematics 20: 53–65.
[6] Bhave, Sampada, et al. "3D multispectral T2 mapping near metal implants." Magnetic resonance in medicine 82.2 (2019): 614-621.
[7] Cheung, Jacky, et al. "Clinical Feasibility of Multi-Acquisition Variable-Resonance Image Combination–Based T2 Mapping near Hip Arthroplasty." HSS Journal® 17.2 (2021): 165-173.
[8] Koch, Kevin M., et al. "Multispectral diffusion‐weighted imaging near metal implants." Magnetic resonance in medicine 79.2 (2018): 987-993.
[9] Koch, Kevin M., et al. "Off‐resonance based assessment of metallic wear debris near total hip arthroplasty." Magnetic resonance in medicine 79.3 (2018): 1628-1637.
[10] Sherafati, Mohammad, et al. "Multivariate use of MRI biomarkers to classify histologically confirmed necrosis in symptomatic total hip arthroplasty." Journal of Orthopaedic Research® 38.7 (2020): 1506-1514.
Figures