2403
Measuring Fixation in Cementless Total Knee Replacement Tibial Baseplates with RSA and MRI1Medical Biophysics, Western University, London, ON, Canada, 2Robarts Research Institute, London, ON, Canada, 3Lawson Health Research Institute, London, ON, Canada, 4Radiology and Imaging, Hospital for Special Surgery, New York, NY, United States, 5Surgery, Western University, London, ON, Canada
Synopsis
This prospective evaluation of cementless total knee replacement tibial baseplate fixation using RSA and MRI at paired time points identified a stabilization of migration and mostly normal integration of the bone-implant interface by 3 months post-operation. A potential relationship between RSA migration magnitude and the evaluated bone-implant interface supports the use of MRI as a tool for evaluating implant fixation.
Introduction
Modern cementless total knee replacement (TKR) implants have porous metal surfaces that allow for bone ingrowth to create a biological fixation mechanism. The gold standard for investigating implant fixation is radiostereometric analysis (RSA), a stereo x-ray technique that measures migration of the implant relative to bone. However, RSA labs are uncommon in North America and requires the insertion of tantalum marker beads into bone during surgery, limiting its use to small groups of patients enrolled in research studies. Magnetic resonance imaging (MRI) techniques have been developed to analyze the bone-implant interface allowing radiologists to classify an implant as loose if there is poor bone integration. MRI is a more common imaging modality, does not require any marker beads, and does not use ionizing radiation. These advantages could allow MRI to be used for more widespread studies of implant fixation. The objective of this study is to investigate cementless TKR tibial baseplate migration measured using RSA in comparison to evaluation of the corresponding bone-implant interfaces for bone ingrowth using MRI.Methods
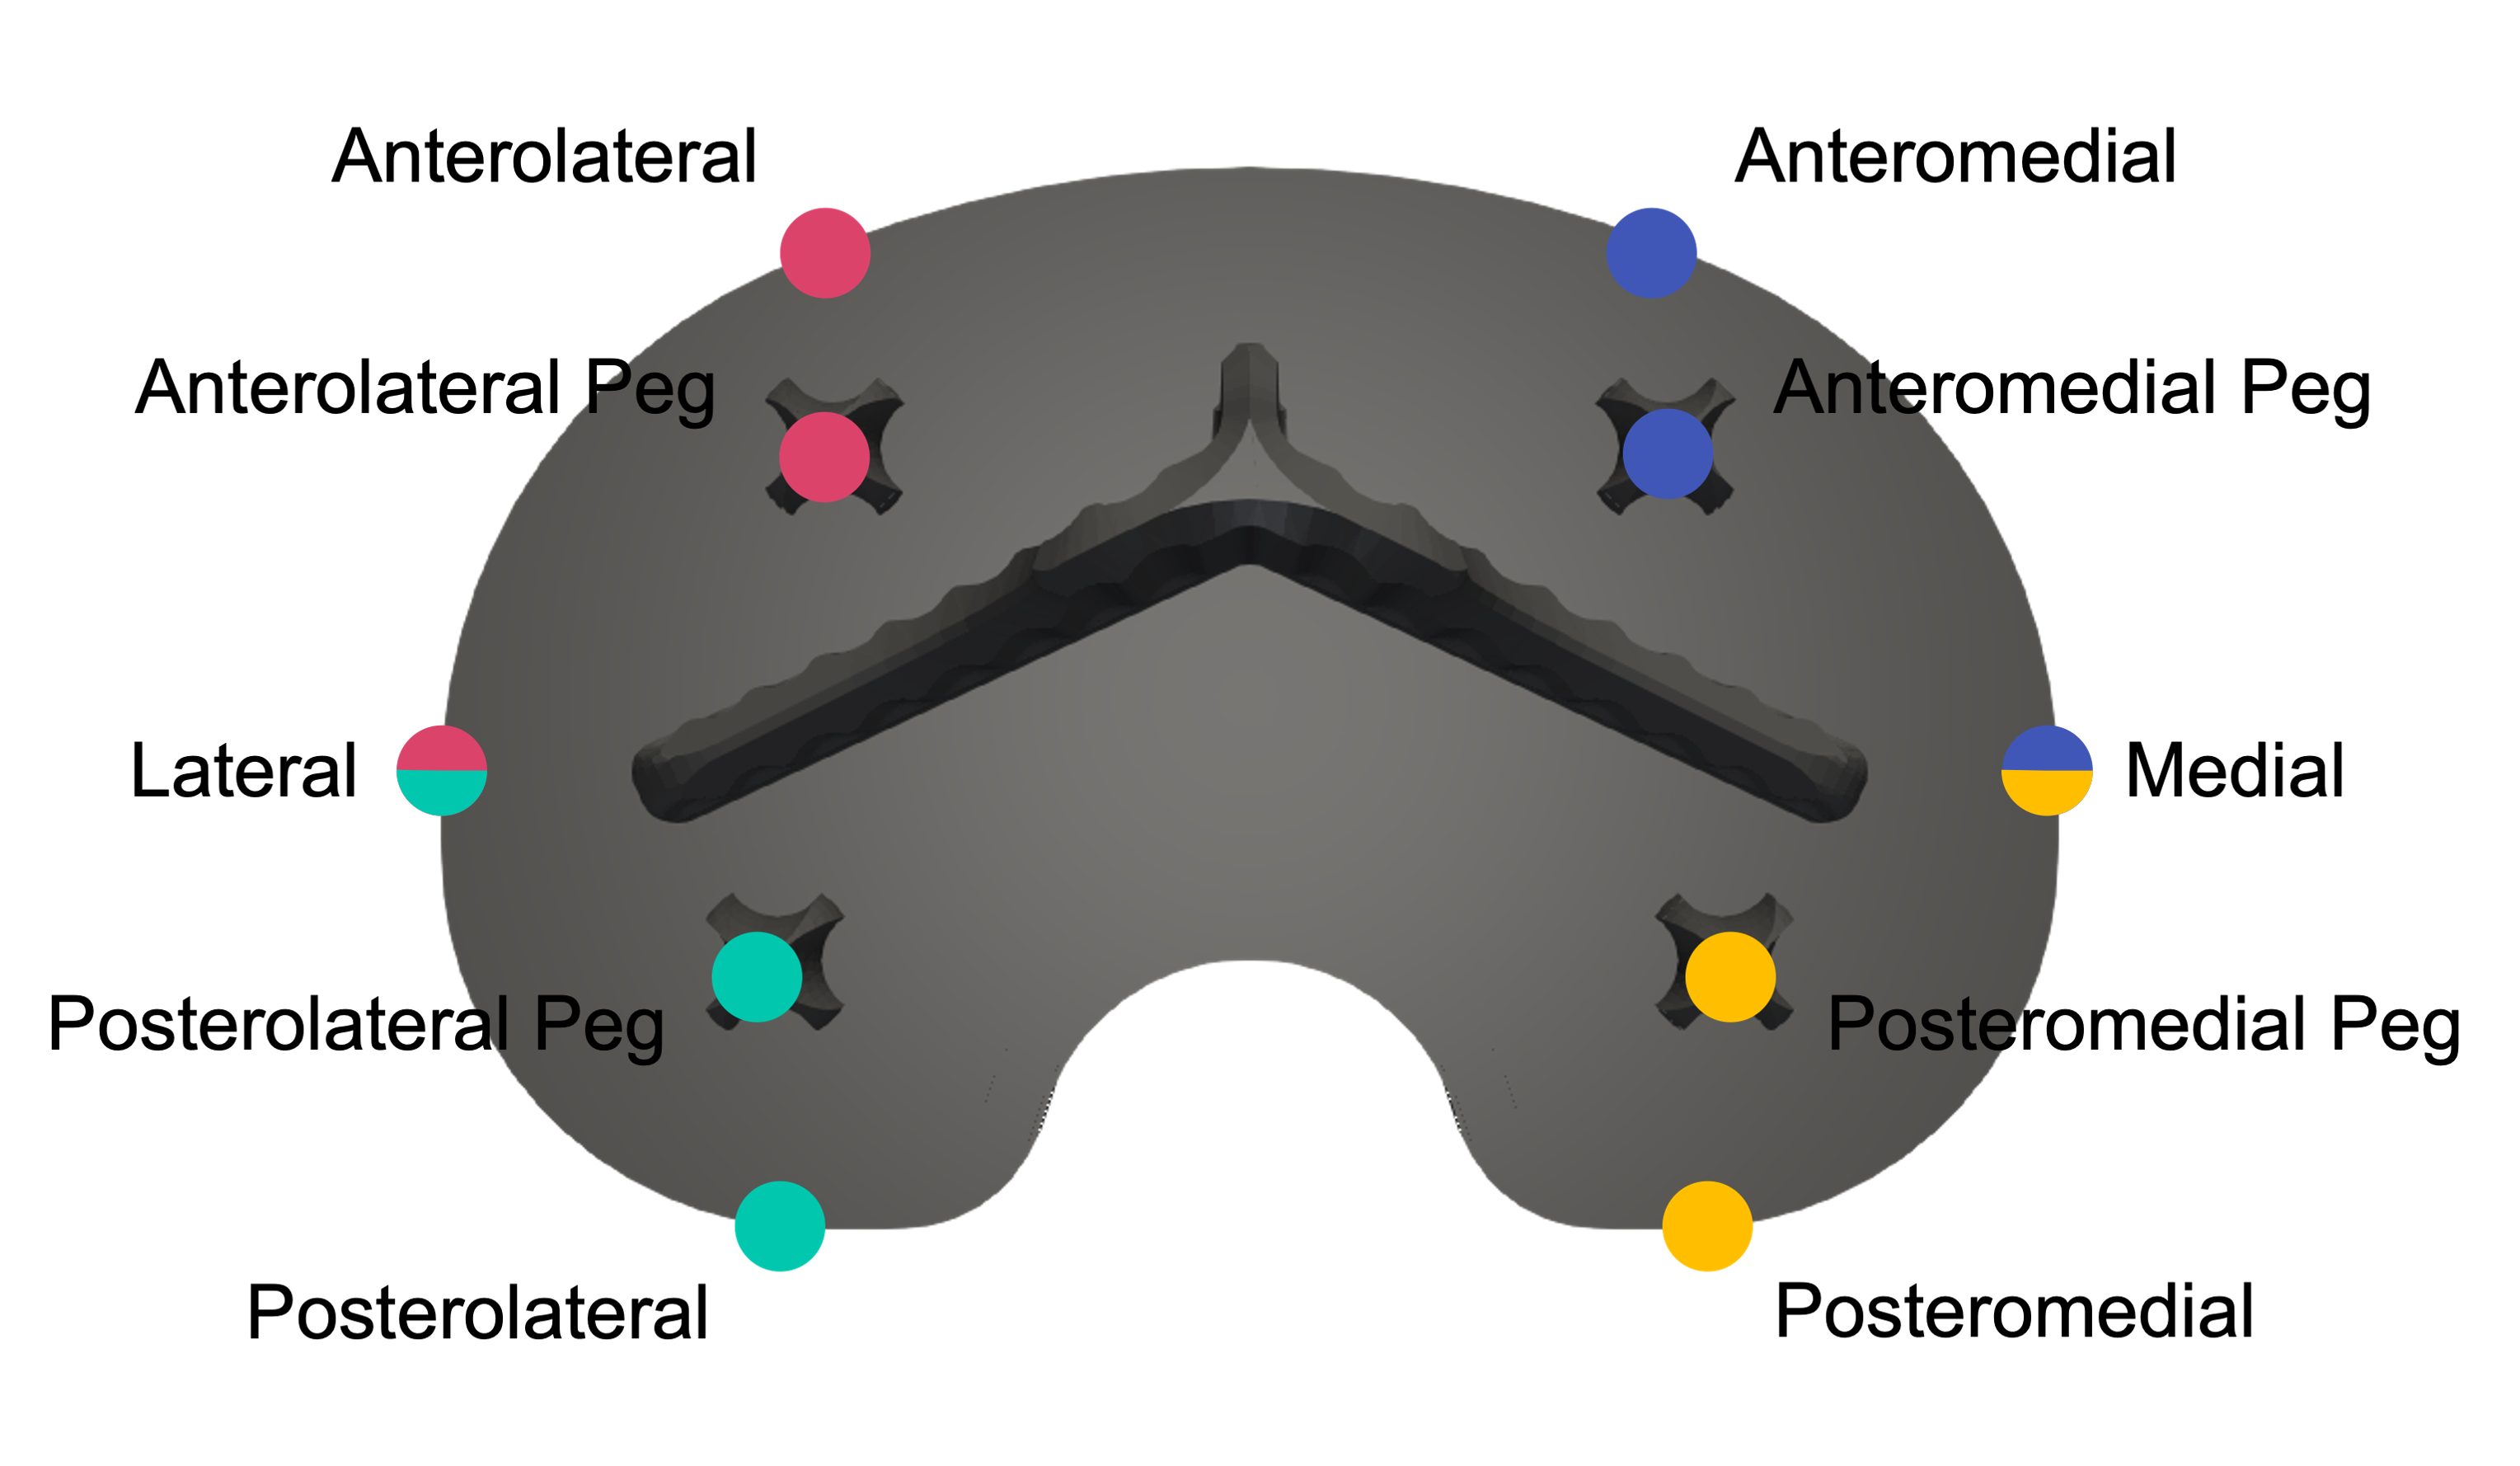
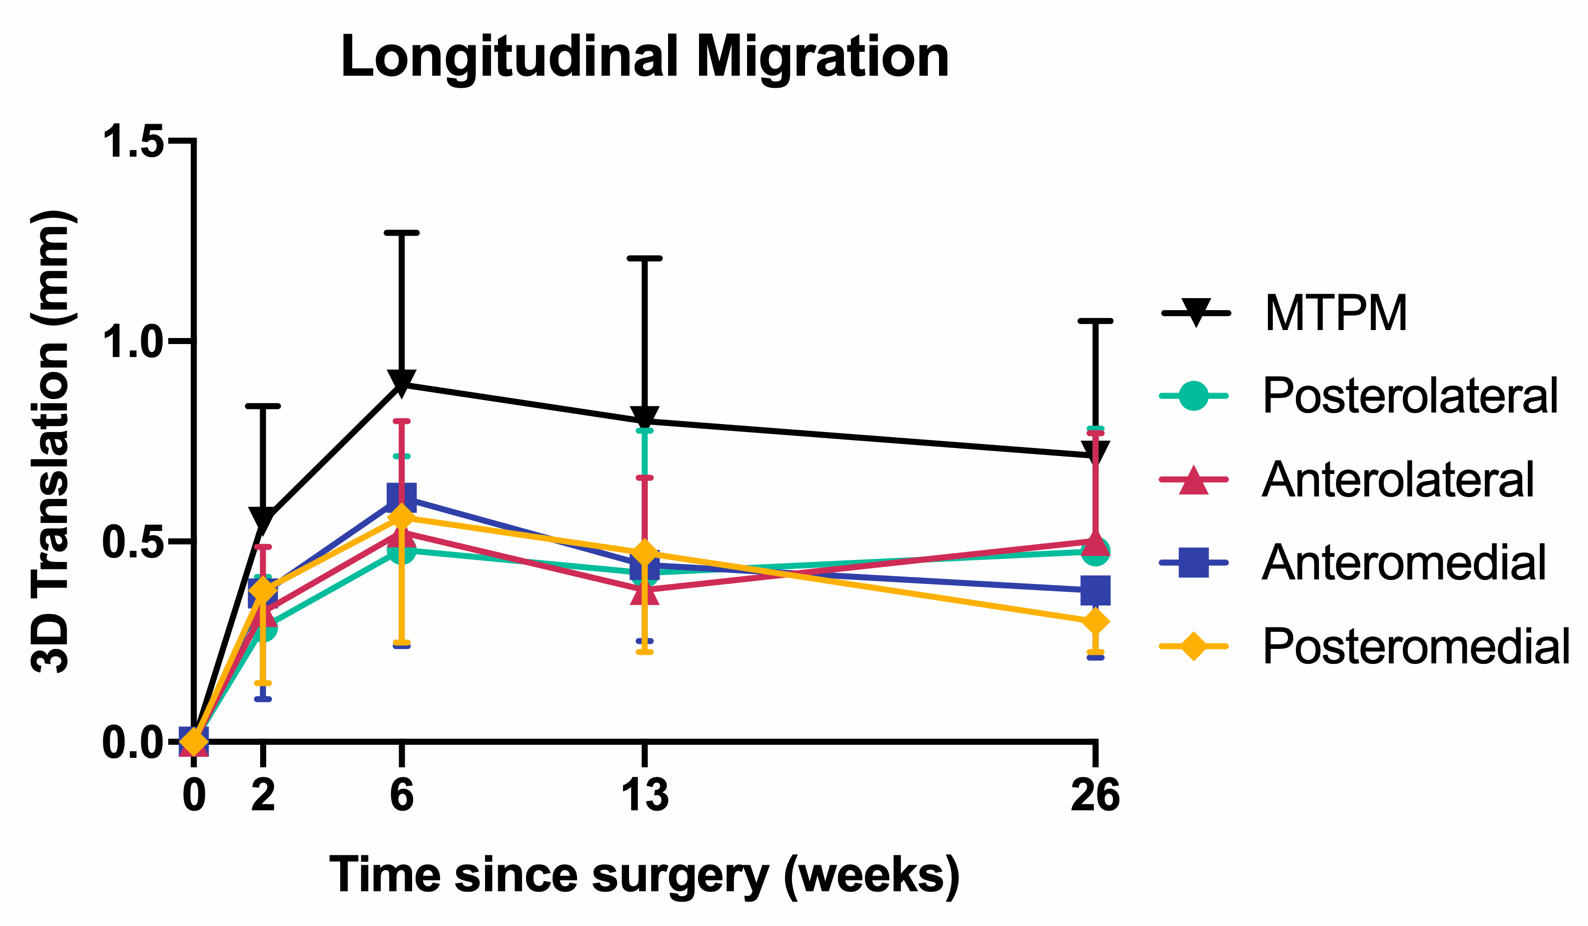
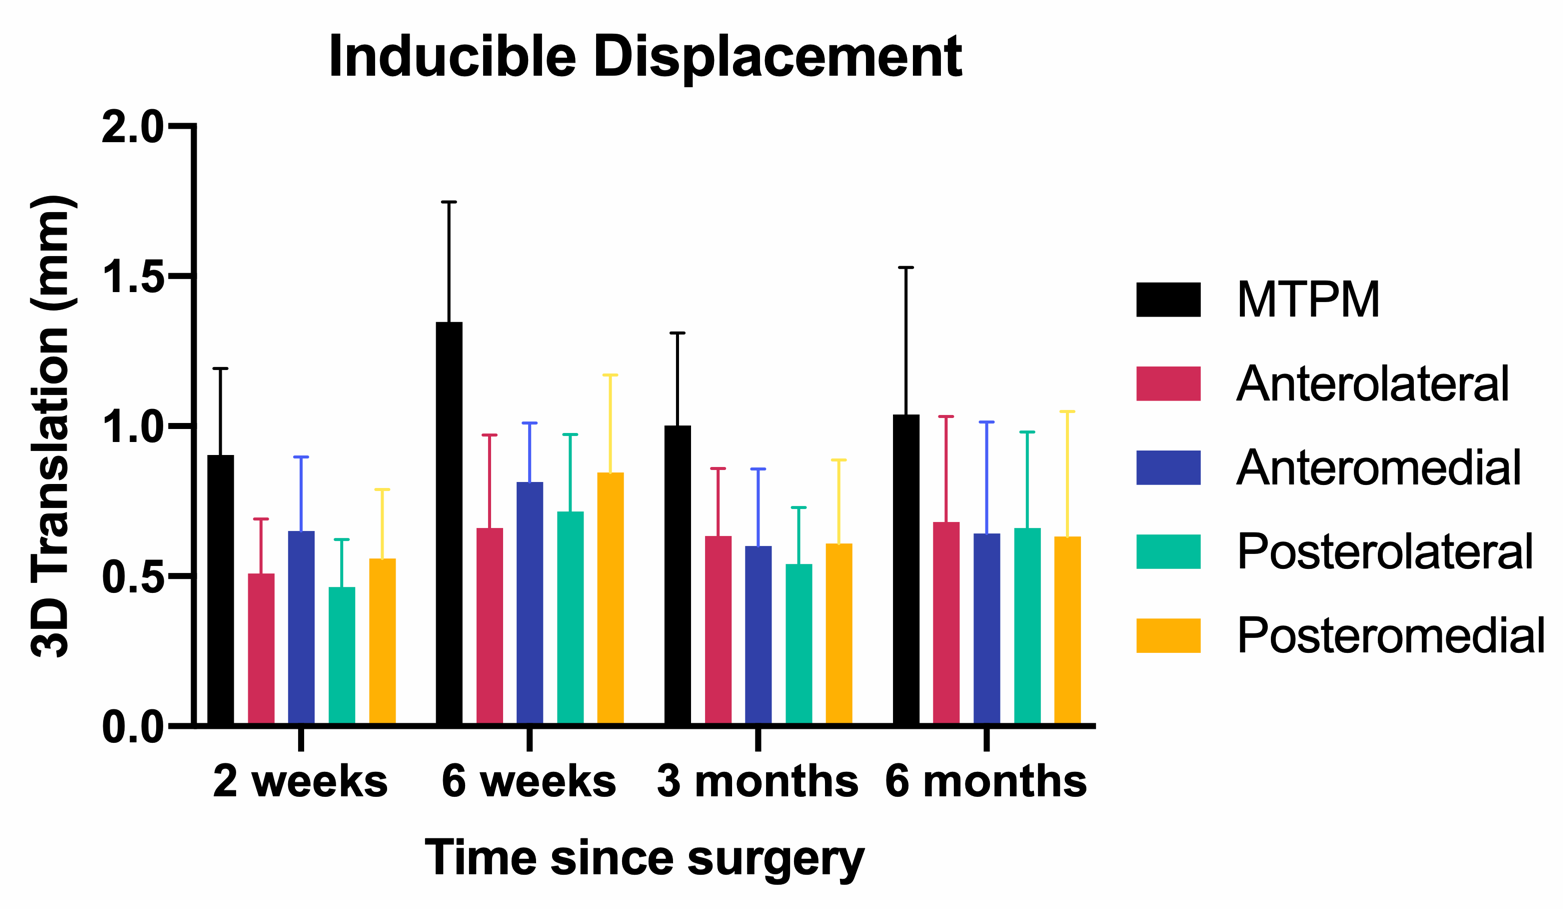
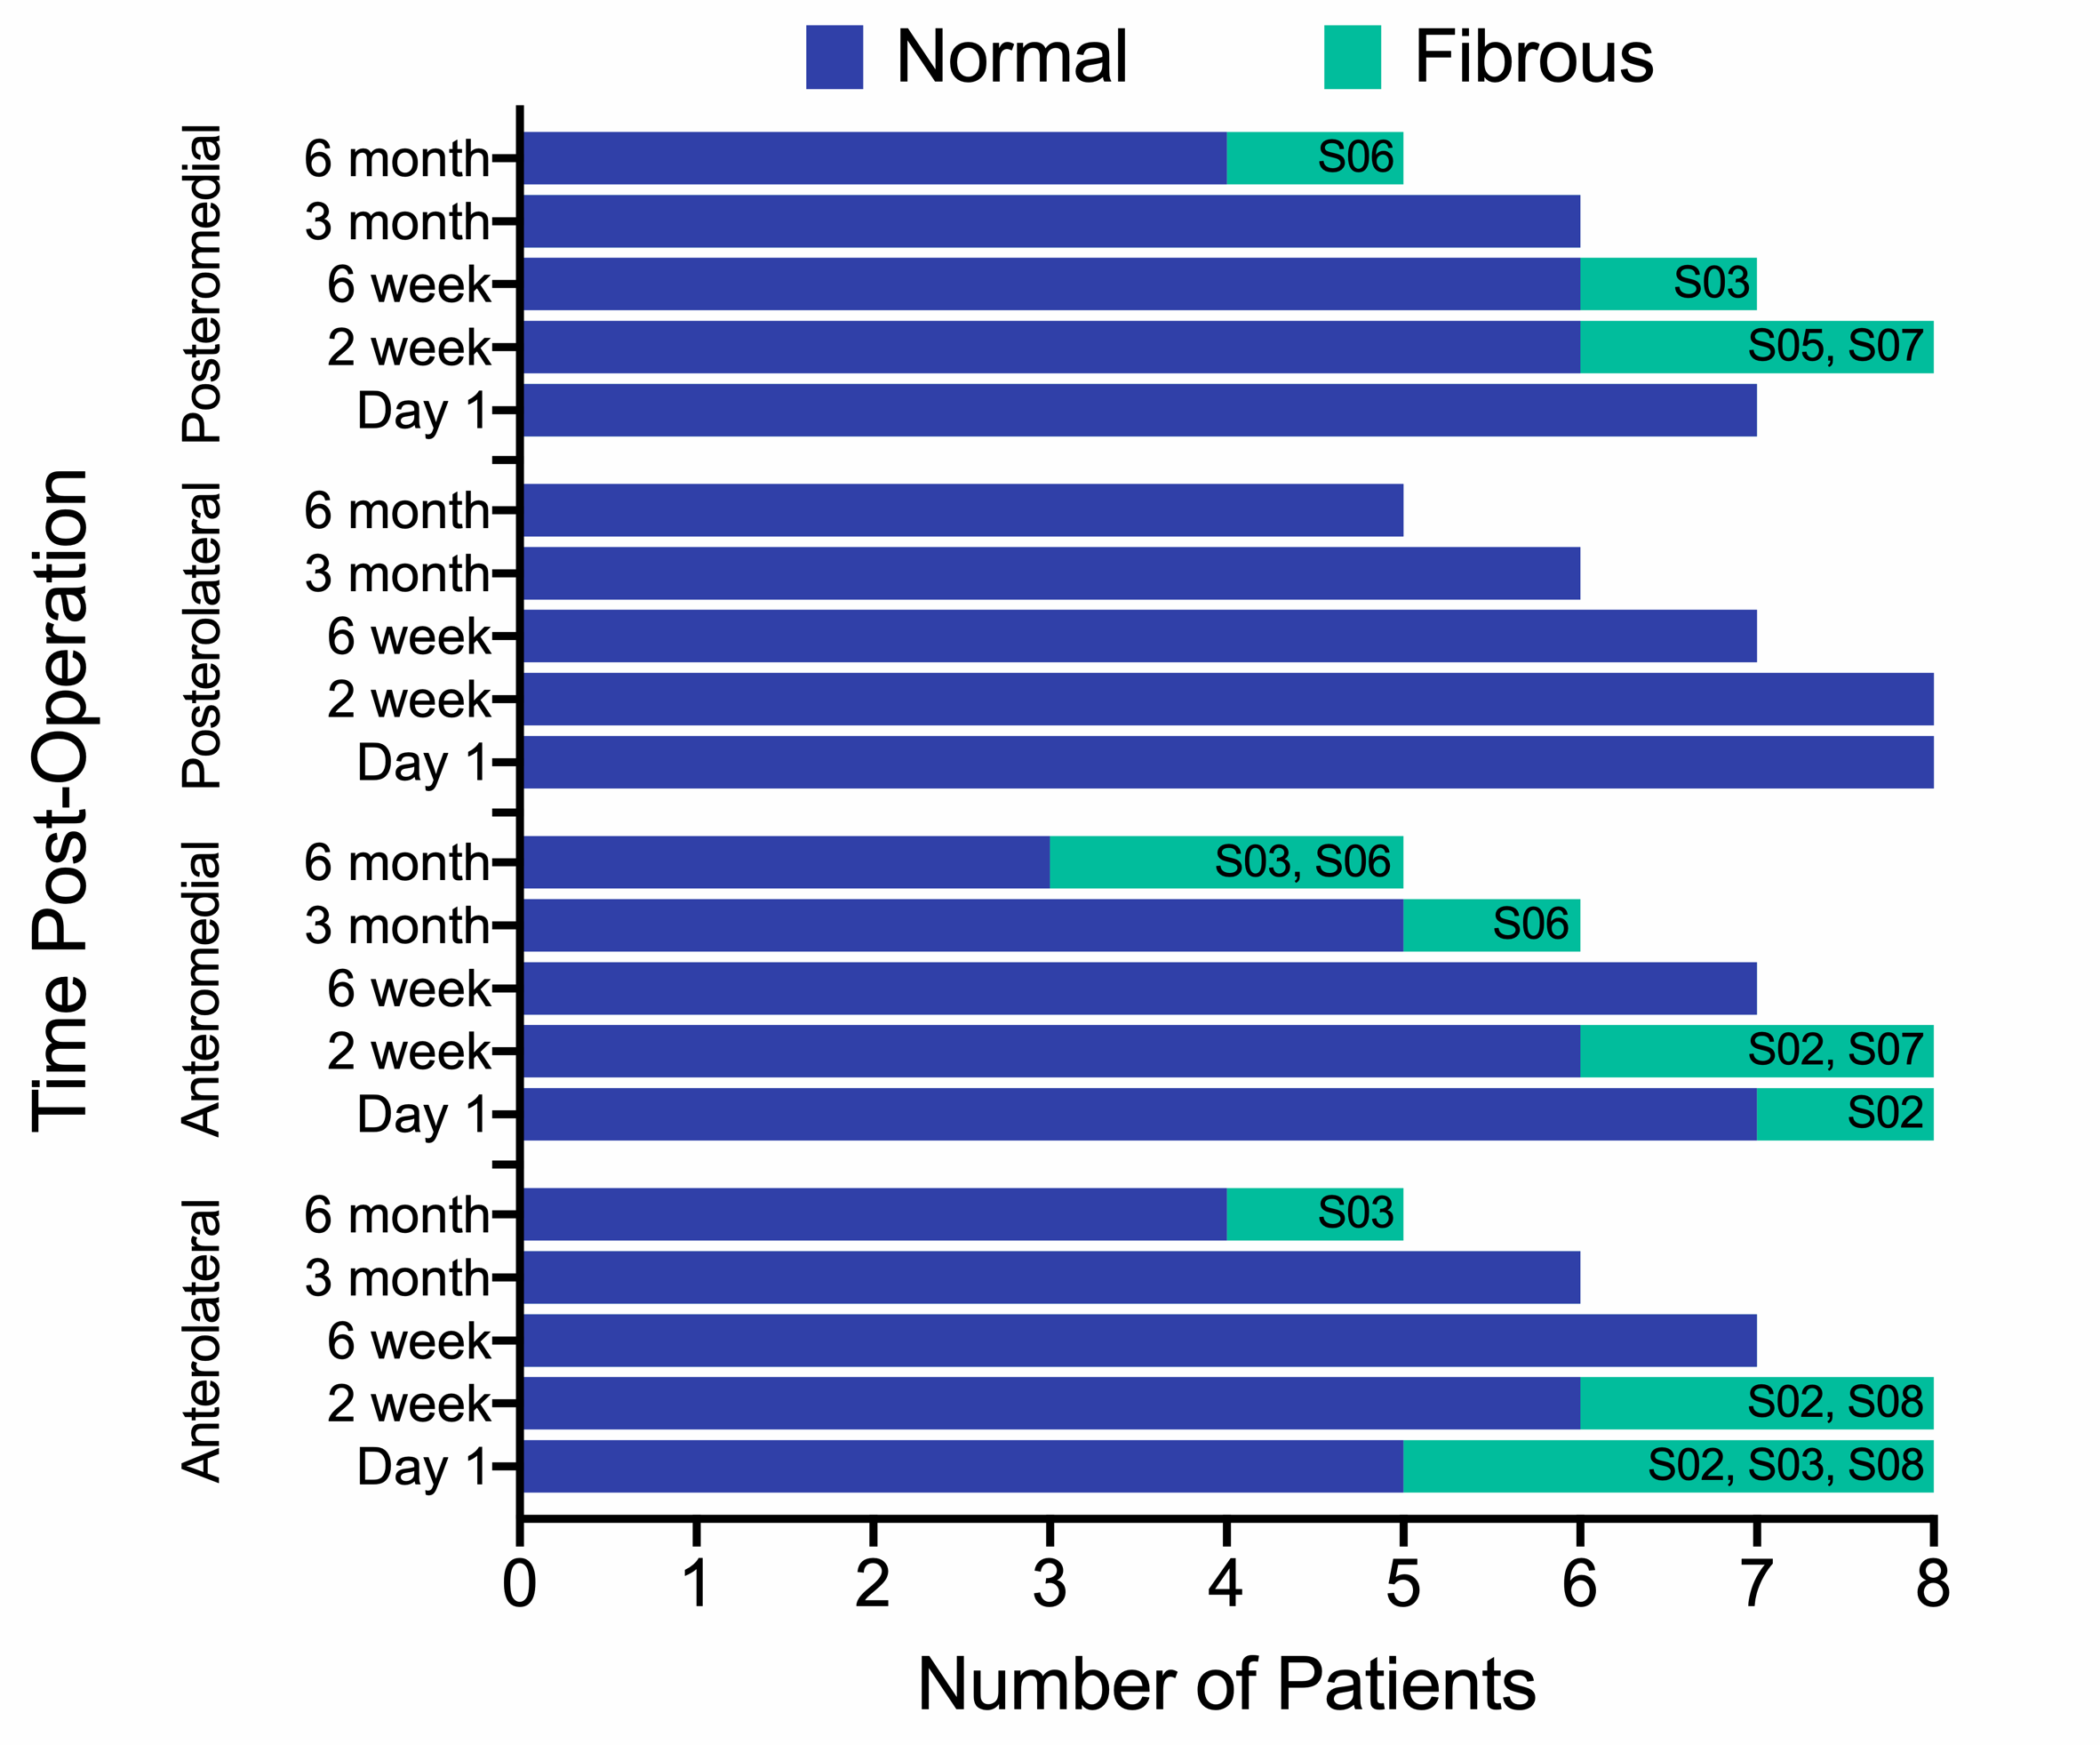
A total of 8 patients (5 male, 3 female) have been recruited thus far. A cementless cruciate-retaining TKR implant was used in all cases. Supine RSA and MRI exams were performed at a baseline of one day after TKR surgery and again at 2 weeks, 6 weeks, 3 months, and 6 months post-operation. At the 6 week visit, a second supine RSA exam was performed to assess measurement repeatability. Weight-bearing RSA exams were also performed at all timepoints following the baseline exam. With RSA, maximum total point motion (MTPM) and migration at fictive points surrounding the tibial baseplate were calculated (Figure 1). Longitudinal migration was determined between the supine baseline exam and each follow-up supine exam. Inducible displacement was determined between the supine and standing exams at each time point. The bone-implant interface surrounding the tibial baseplate was assessed using morphologic images acquired on a clinical 3T scanner that incorporated a multispectral image acquisition to reduce metallic susceptibility artifact.1 The interface was evaluated in four distinct regions: anterolateral, anteromedial, posterolateral, and posteromedial. The interface was classified as normal, fibrous, fluid, or osteolytic and the percent contact of bone (<33%, 33%–66%, >66%) with the porous metal implant surface in each region was assessed. Implants were then scored as either loose or not loose. A mixed-effects model was used for statistical analysis of longitudinal migration and inducible displacement. Unpaired t-tests or Mann-Whitney tests were used to compare the migration in quadrants classified as normal and quadrants with a non-normal classification at each timepoint.Results
Patients were age 52 to 71 years old, with body mass indexes of 28.4 to 52.0 kg/m2. Five patients have completed all study visits, 1 is through 3 months post-operation, 1 is through 6 weeks post-operation, and 1 is through 2 weeks post-operation. The precision, reported as the standard deviation of MTPM measurements, was 0.21 mm. Average longitudinal migration (MTPM) from day 1 post-operation progressed to 0.55 mm (range=0.16–1.17 mm) at 2 weeks, 0.89 mm (range=0.21–1.46 mm) at 6 weeks, 0.80 mm (range=0.28–1.30 mm) at 3 months, and 0.72 mm (range=0.34–1.21 mm) at 6 months post-operation (Figure 2). There were no differences (p=0.94) in longitudinal migration between quadrants of the tibial baseplate. Average inducible displacement (MTPM) was 0.90 mm (range=0.58–1.31 mm) at 2 weeks, 1.35 mm (range=0.88–2.00 mm) at 6 weeks, 1.00 mm (range=0.42–1.26 mm) at 3 months, and 1.04 mm (range=0.60–1.78 mm) at 6 months post-operation (Figure 3). There were also no differences (p=0.72) in inducible displacement between baseplate quadrants. The results from MRI showed that all patients had >66% integration of bone with the porous metal implant surface in all four quadrants at each timepoint, except for one patient who had 33-66% integration in the posteromedial region at 6 months post-operation. No implants were scored as loose, however, six patients had fibrous interfaces present between the implant and bone (Figure 4). There was a significant difference between quadrants classified as normal and fibrous for longitudinal migration at 2 weeks (mean difference=0.27 mm, p=0.009), but not at 6 weeks (mean difference=0.07 mm, p=0.67), 3 months (mean difference=0.01 mm, p=0.96), or 6 months post-operation (mean difference=0.04 mm, p=0.96).Discussion
This is the first study using RSA and MRI to examine implant fixation in the same cohort of patients. Tibial baseplate longitudinal migration and inducible displacement were consistent with literature reports for cementless designs, with the change in migration slowing by 3 months post-operation.2,3 Six patients had fibrous interfaces present in at least one quadrant, however, of these, three went on to have bone ingrowth by their latest follow-up. All but one implant had >66% integration of bone with the implant at all follow-ups and no baseplates were scored as loose. There was a significant difference in early migration, with quadrants that were classified as fibrous at 2 weeks post-operation having greater migration. This suggests a potential relationship may exist between RSA-measured migration and the MRI-evaluated strength of the bone-implant interface. Recruitment of additional subjects and continued follow-up is ongoing.Acknowledgements
No acknowledgement found.References
1. Koch KM, Brau AC, Chen W, et al. Imaging Near Metal with a MAVRIC-SEMAC Hybrid. Magn Reson Med. 2011;65(1):71-82.
2. Williams HA, Broberg JS, Howard JL, et al. Effect of gap balancing and measured resection techniques on implant migration and contact kinematics of a cementless total knee arthroplasty. Knee. 2021;31:86-96.
3. Hasan S, van Hamersveld KT, Marang-van de Mheen PJ, et al. Migration of a novel 3D-printed cementless versus a cemented total knee arthroplasty: two-year results of a randomized controlled trial using radiostereometric analysis. Bone Joint J. 2020;102-B(8):1016-1024.
Figures