2402
Relevance of diffusion time for DKI detection of liver pathology1Champalimaud Research, Champalimaud Centre for the Unknown, Lisbon, Portugal
Synopsis
Despite the recent interest in diffusion kurtosis imaging (DKI) for assessing liver pathologies, its added value over more standard diffusion-weighted or diffusion tensor imaging techniques remains to be established. Importantly, mean diffusivity (MD) and mean kurtosis (MK) estimations are strongly dependent on the diffusion time (DT), a parameter generally overlooked in liver DKI studies. Here, we demonstrate ex vivo the relevance of short DT – namely 10 ms rather than 40 ms – for MK detection of liver disease, using two well-described mouse models of liver metastasis and fibrosis.
INTRODUCTION
Diffusion kurtosis imaging (DKI) – a method that analyses non-gaussian water diffusivity – has been raising interest for assessing liver disease, with applications spanning from non-alcoholic fatty liver disease [1] to fibrosis [2, 3] and cancer [4, 5], including treatment response [6]. Despite some studies reporting on the added clinical value of mean kurtosis (MK) over more standard diffusion-weighted or diffusion tensor metrics (such as the apparent diffusion coefficient and mean diffusivity, MD) e.g. for grading hepatocellular carcinoma [5], this remains to be established [4] leaving room for improvement. While MK estimates depend strongly on the diffusion time (DT), this parameter is generally overlooked in liver DKI studies. Thus, short DT is generally advised for DKI [7] and 45 ms have even been recommend for its clinical use (based on brain studies, [8]). We set to investigate the effect of DT on DKI detection of liver pathology using two well-described mouse models of liver lesion, metastasis and fibrosis, and comparing two short DT regimes, 10 and 40 ms.METHODS
All animal experiments were preapproved by institutional and national authorities, and carried out according to European Directive 2010/63. C57BL6/j mice were used, 18-20g.Syngeneic model of liver metastasis
Each animal (n=3) was anesthetized, and the left abdominal/flank region shaved, followed by incisions on the abdominal skin and underlying muscle to grasp and externalize part of the liver, where 10E6 Pan02 pancreatic cancer cells diluted in 30µL of Matrigel were injected, simulating the natural metastatic spread from a primary pancreatic cancer to the liver. The liver was then internalized and the two incisions sutured. Animals were sacrificed 15 days after injection, their livers removed and fixed in 4% PFA for 24h at 4ºC.
Liver fibrosis model
Repeated i.p. injections of 0.28 g/Kg CCl4 (n=5) and sham olive-oil (n=5) were administered to each animal every 5 days up to 4 total doses [9]. Under full pentobarbital anesthesia, the mouse liver was perfused with 4% PFA through the portal, as before [10]. Each liver was resected and immersed in 4% PFA for 24h at 4ºC; one lobule was separated for histology and the rest kept for MRI. For histology, samples were further fixed overnight in 2% PFA + 20% sucrose, OCT-embedded and frozen; tissue cryosections were immunostained for F4/80+ and analyzed by fluorescence microscopy.
MRI
Each fixed sample was kept in PBS for 24h at 4ºC, then loaded on a 15mm NMR tube filled with Fluorinert and sodium azide, and kept at 4ºC for 1 week before scanning. This was performed on a Bruker 16.4T Aeon Ascend spectrometer equipped with an Avance IIIHD console and a Micro2.5 probe (Gmax 1500 mT/m in all directions). DKI was encoded using the remmiRARE pulse sequence (kindly provided by Prof. Mark D Does from Vanderbilt University, USA) using the following acquisition parameters: RARE factor, 12; TE1, 43.9ms; Echo Spacing, 3.3ms; TR, 2s; averages, 2; FOV/matrix, 22.4x15.5mm/104x72 (0.215x0.215mm in plane resolution); 0.8mm slice thickness (10 slices, total); total acquisition time, 67min. For the diffusion weighting, eight b-values were spaced between 20-2000s/mm2, with 20 directions per b-value, 8 non-diffusion weighted acquisitions (b0) for normalization, 1.8ms gradient duration, and 10 or 40 ms DT.
Data analysis
Immunofluorescence data were analyzed with Graph Pad Prism 5.0a (La Jolla/CA, USA). MRI data were analyzed in Matlab R2015a (Natick/MA, USA). Preprocessing included Marchenko-Pastur PCA denoising [11] and Gibbs unringing [12]. For the metastasis model, liver pathology (lesion) and remaining tissue (control) were compared based on manually drawn ROIs for each sample; whereas for the fibrosis model, the whole liver was considered as control or lesion according to the respective group. Data were analyzed by pixel-wise fitting to extract mean diffusivity (MD) and mean kurtosis (MK), based on the literature [13-17]. The groups were compared for each metric with a two-tailed t-Test.
RESULTS
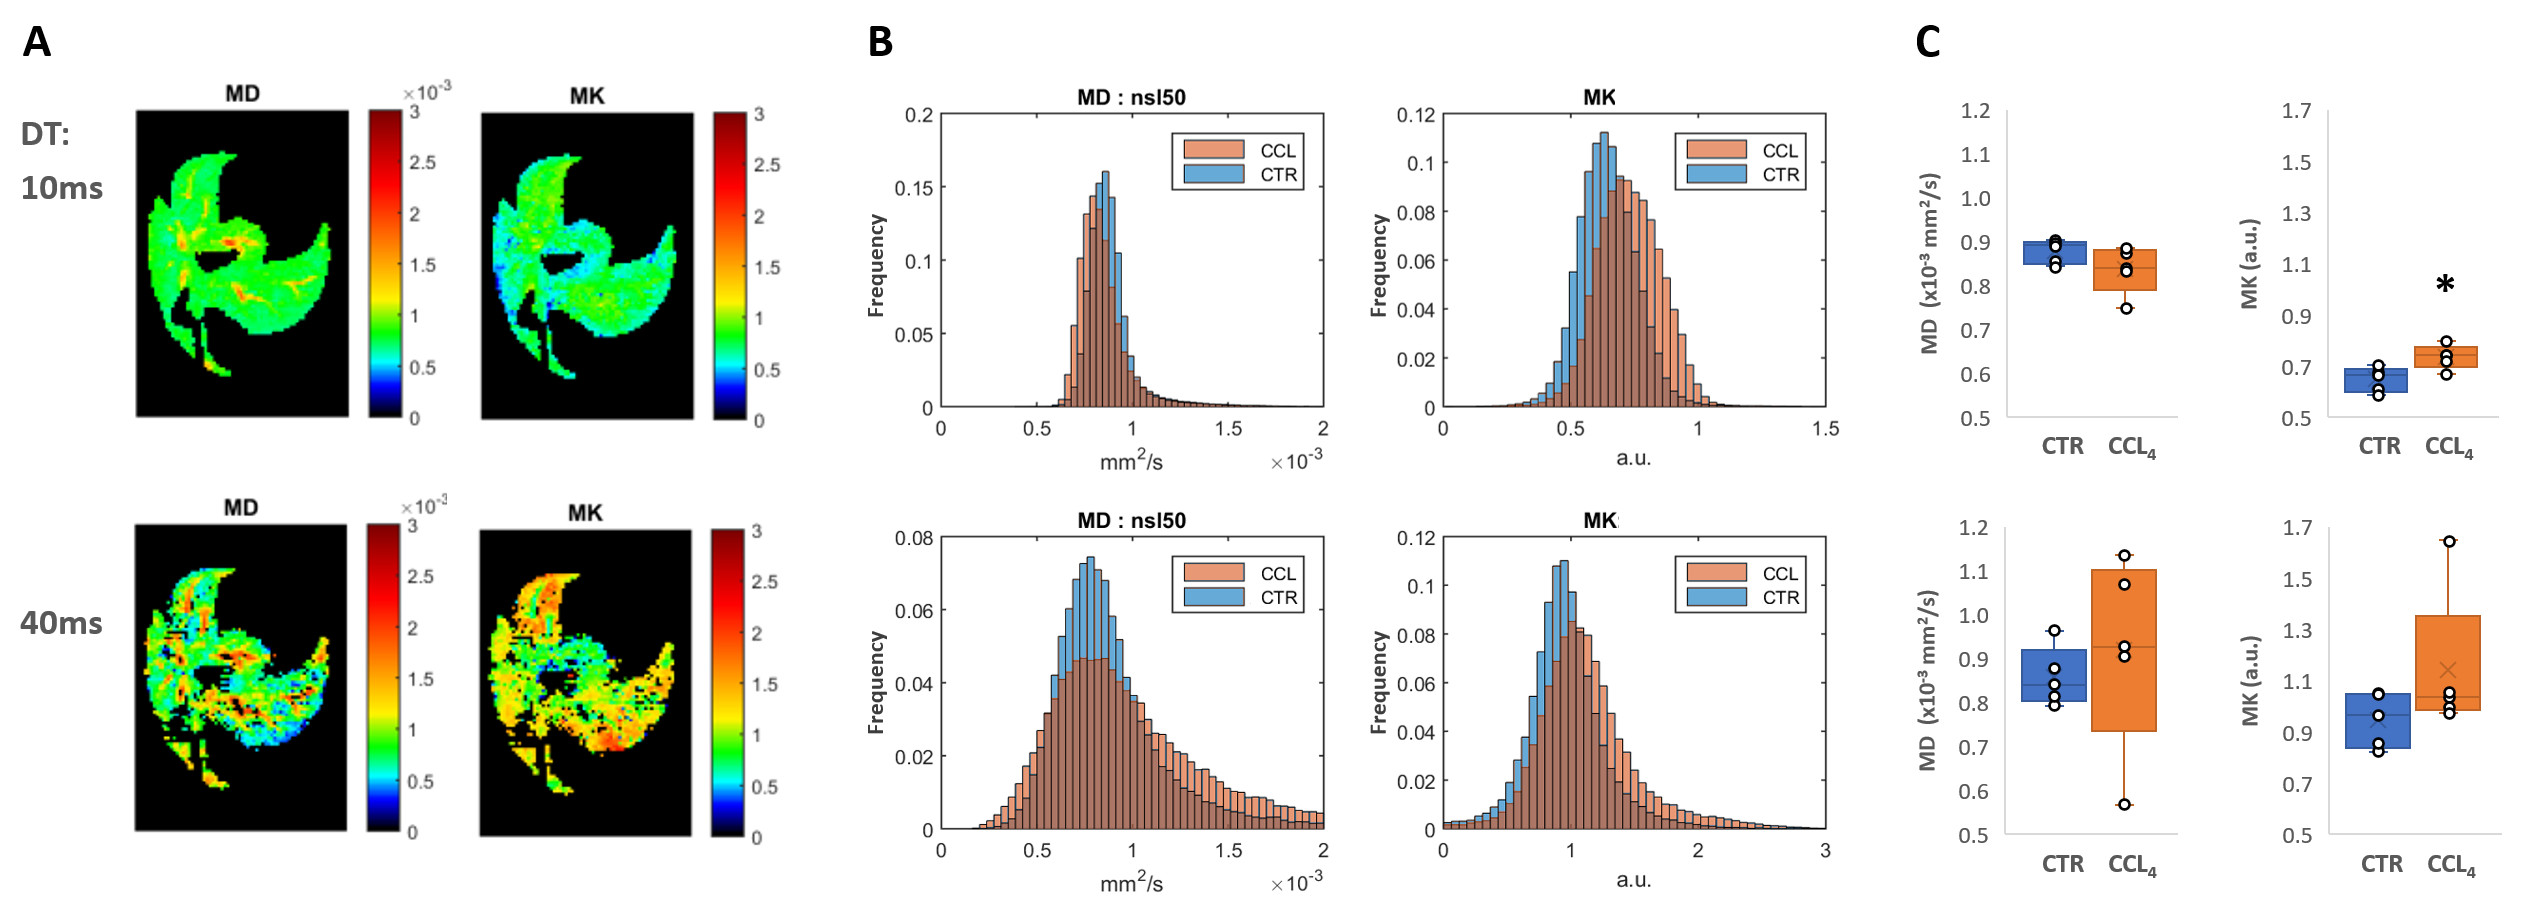
Mouse allograft tumors, simulating pancreatic metastases to the liver, were associated with decreased MD and increased MK compared to non-tumor regions (Fig. 1-A-B). Specifically, MK was significantly higher in these lesions at 10ms DT (p=0.002), but not at 40ms (Fig. 1-C). This was also observed in the fibrosis model, where CCl4-treated livers were characterized by increased MK compared to controls (Fig. 2-A-B), although only significantly at 10ms DT (p=0.020) (Fig. 2-C). Further analysis of these samples demonstrated the heterogeneity of the model, showing a wide range of macrophage infiltration (as a marker of fibrosis [18]) within the CCl4-treated group (Fig. 3-A), which correlated with MK at 10 ms DT (R=0.66, p=0.039); whereas no correlation could be detected at 40ms (Fig 3-B).DISCUSSION
Our results with two well-established mouse models of liver pathology – metastasis and fibrosis – demonstrate the importance of DT below 40ms for ex vivo MK-detection of liver lesions. Further studies should validate these findings in vivo in preclinical models and patients.CONCLUSION
Given the translational relevance of DKI for assessing liver pathology and the current advances of the technique [19], future studies should strongly consider its dependence on DT and report this parameter.Acknowledgements
Funding Support: Champalimaud Foundation; H2020-MSCA-IF-2016 grant, ref. 751547; H2020-MSCA-IF-2018 grant, ref. 844776EMBO Installation Grant, ref. 3921; NIH, ref. EB019980. The authors thank the Vivarium of the Champalimaud Centre for the Unknown, a research infrastructure of CONGENTO co-financed by Lisbon Regional Operational Programme (Lisboa2020), under the PORTUGAL 2020 Partnership Agreement, through the European Regional Development Fund (ERDF) and Fundação para a Ciência e Tecnologia (Portugal), under the project LISBOA-01-0145-FEDER-022170.References
1. Li, C., et al., Evaluation of diffusion kurtosis imaging in stratification of nonalcoholic fatty liver disease and early diagnosis of nonalcoholic steatohepatitis in a rabbit model. Magn Reson Imaging, 2019. 63: p. 267-273.
2. Xie, S., et al., Differentiating mild and substantial hepatic fibrosis from healthy controls: a comparison of diffusion kurtosis imaging and conventional diffusion-weighted imaging. Acta Radiol, 2020. 61(8): p. 1012-1020.
3. Hu, G., et al., Staging of rat liver fibrosis using monoexponential, stretched exponential and diffusion kurtosis models with diffusion weighted imaging- magnetic resonance. Oncotarget, 2018. 9(2): p. 2357-2366.
4. Jia, Y., et al., Diffusion Kurtosis MR Imaging versus Conventional Diffusion-Weighted Imaging for Distinguishing Hepatocellular Carcinoma from Benign Hepatic Nodules. Contrast Media Mol Imaging, 2019. 2019: p. 2030147.
5. Wang, G.Z., et al., Magnetic Resonance Diffusion Kurtosis Imaging versus Diffusion-Weighted Imaging in Evaluating the Pathological Grade of Hepatocellular Carcinoma. Cancer Manag Res, 2020. 12: p. 5147-5158.
6. Goshima, S., et al., Diffusion kurtosis imaging to assess response to treatment in hypervascular hepatocellular carcinoma. AJR Am J Roentgenol, 2015. 204(5): p. W543-9.
7. Rosenkrantz, A.B., et al., Body diffusion kurtosis imaging: Basic principles, applications, and considerations for clinical practice. J Magn Reson Imaging, 2015. 42(5): p. 1190-202.
8. Fukunaga, I., et al., Effects of diffusional kurtosis imaging parameters on diffusion quantification. Radiol Phys Technol, 2013. 6(2): p. 343-8.
9. Ramachandran, P., et al., Differential Ly-6C expression identifies the recruited macrophage phenotype, which orchestrates the regression of murine liver fibrosis. Proc Natl Acad Sci U S A, 2012. 109(46): p. E3186-95.
10. Simões, R.V., et al., Detection of pre-metastatic niches in perfused mouse livers by diffusion-weighted imaging at ultra-high field. Proc. Intl. Soc. Mag. Reson. Med., 2019. 5196.
11. Veraart, J., E. Fieremans, and D.S. Novikov, Diffusion MRI Noise Mapping Using Random Matrix Theory. Magnetic Resonance in Medicine, 2016. 76(5): p. 1582-1593.
12. Kellner, E., et al., Gibbs-ringing artifact removal based on local subvoxel-shifts. Magn Reson Med, 2016. 76(5): p. 1574-1581.
13. Pierpaoli, C. and P.J. Basser, Toward a quantitative assessment of diffusion anisotropy. Magnetic Resonance in Medicine, 1996. 36(6): p. 893-906.
14. Basser, P.J., J. Mattiello, and D. LeBihan, MR diffusion tensor spectroscopy and imaging. Biophys J, 1994. 66(1): p. 259-67.
15. Henriques, R.N. and M.M. Correia, Interpreting age-related changes based on the mean signal diffusion kurtosis. Proc. ISMRM, 2017. Abs p. 1270.
16. Henriques, R.N., et al., Exploring the 3D geometry of the diffusion kurtosis tensor-Impact on the development of robust tractography procedures and novel biomarkers. Neuroimage, 2015. 111: p. 85-99.
17. Jensen, J.H., et al., Diffusional kurtosis imaging: the quantification of non-gaussian water diffusion by means of magnetic resonance imaging. Magn Reson Med, 2005. 53(6): p. 1432-40.
18. Wynn, T.A. and L. Barron, Macrophages: master regulators of inflammation and fibrosis. Semin Liver Dis, 2010. 30(3): p. 245-57.
19. Xu, H., et al., Feasibility study of simultaneous multislice diffusion kurtosis imaging with different acceleration factors in the liver. BMC Med Imaging, 2021. 21(1): p. 132.
Figures