2401
Development and Testing of an In-House Phantom to Assess T2*/R2* Relaxometry Measurements of Liver Iron Concentration1Medical Imaging and Medical Physics, Sheffield Teaching Hospitals NHS Foundation Trust, Sheffield, United Kingdom
Synopsis
T2* relaxometry measurements of Liver Iron Concentration are demonstrated to be reliable and reproducible in publications. However, no suitable phantom exists for individual hospitals to validate the accuracy, reliability or precision of their methods. We demonstrate a novel phantom mimicking physiological T2* liver values for this purpose. The accuracy of 2 clinical sequences, reproducibility between 2 scanners and reliability of the phantom was investigated.
Introduction
MRI is a useful and accurate non-invasive tool for the assessment of iron deposition in the liver 1–6. Multiple studies have shown biopsy acquired liver iron concentration (LIC) is correlated with the MRI measured transverse relaxation time constant, T2 or T2* (or their inverse R2 and R2*), within the liver 6-9. Iron assessment through R2 measurement is commercially available as a software service through Ferriscan ®, but the long imaging times (~20 min), centralised ‘black-box’ data processing, and service fee per patient make it unsuitable for many hospitals or patients5. T2* relaxometry methods are fast single breath-hold acquisitions, allowing full volumetric coverage of the liver. They show superb reproducibility and the literature is clear that existing biases can be corrected, or are negligible, resulting in clinically acceptable estimation of LIC 2,5. However, the variety of published sequence parameters and analysis methods, with no clear consensus, has led to uncertainty by clinicians and reduced take up of these methods in many centres. Some scanner manufacturer’s offer iron quantification through software options such as Siemens “LiverLab” 10,11, Philips “StarQuant” 12, or GE “IDEAL-IQ” 13. These are useful in being a simple and efficient method of quantification, but have limitations such as failing to segment the liver or giving erroneous T2* values in severely iron loaded patients. Independent verification through phantom validation is highly desirable for users of in-house relaxometry methods and manufacturers’ software. There are no commercially available phantoms with T2 or T2* values that are representative of those observed during LIC MRI relaxometry, particularly for the more severely iron loaded patient. Most commercially available gels have a shortest T2* of approximately 15 ms, longer than the 1.5 – 12.6 ms range required to cover all LIC categories 14. We proposed to create a novel phantom suitable for testing the accuracy, reliability, and precision of T2*/R2* relaxometry methods. Measurement uncertainty at high iron concentrations is greater, but without a suitable phantom, accurate estimates of the measurement precision cannot be given, as is desirable for clinical measures.Methods
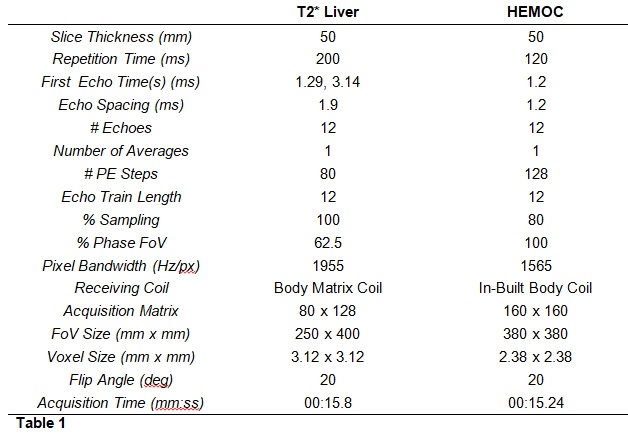
Two sets of gels with Fe3O2 concentrations of 12.5, 25, 50, 100, 200, and 400 mg/ml in agar were created following Mobini et al.15. T2* values were confirmed using spectroscopy. Images were acquired 15 times over three months on two MRI scanners (Siemens Aera 1.5T, Siemens, Erlangen, Germany) using two sequences used for the assessment of Liver Iron Concentration (a clinical multi-echo GRE and “HEMOC”) (Table 1). The T2* of each gel was compared between each sequence on the same scanner and between each scanner for the same sequence. T2* was measured by fitting the signal data to the decay equation show in equation 1, using in-house software written in ImageJ (ImageJ 1.53i, National Institutes of Health, USA, http://imagej.nih.gov/ij).$$STE=S0e-TE/T2*
Where St is the signal at time t.
LIC values were calculated using the calibration curve from Wood et al 6. Kappa statistics 16 were used to calculate the agreement of the two sequences and the two scanners when categorising these LIC results.
Results
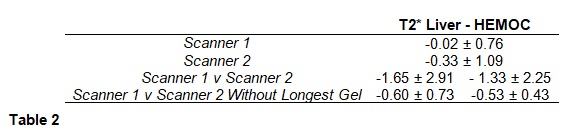
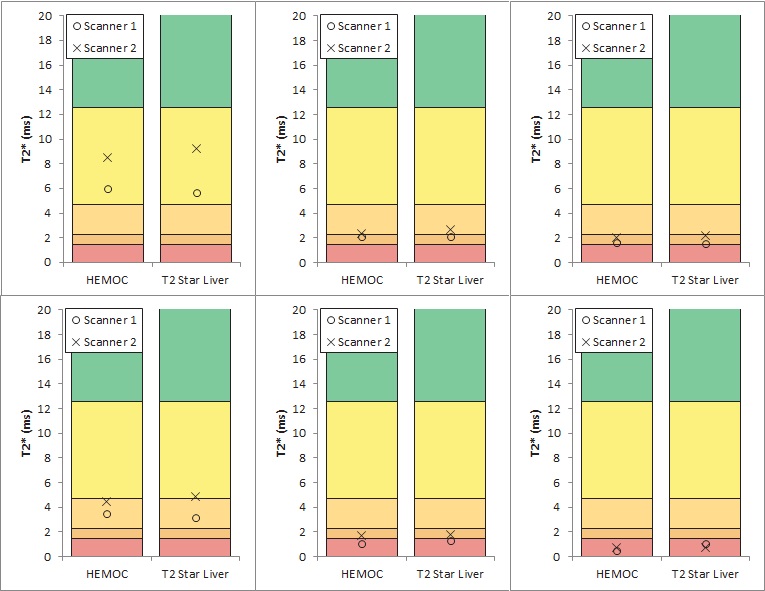
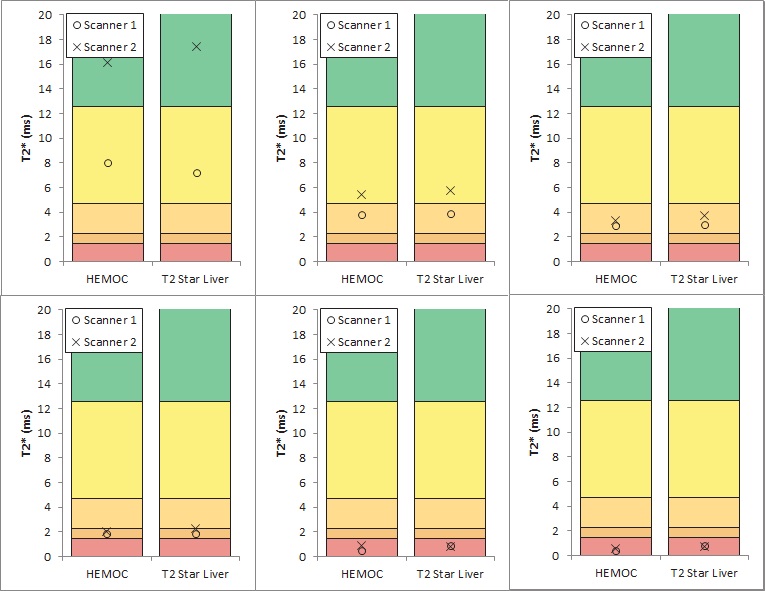
Gel T2* values ranged from 0.5 to 17 ms. There was almost perfect agreement between the two sequences on each scanner (kappa = 1.00 for scanner 1 and 0.894 (0.942 weighted) for scanner 2) and substantial agreement between the two scanners for each sequence (weighted kappa = 0.724) (Table 2, Figures 1 and 2). Bland-Altman plots 16 for inter-scanner comparisons showed a bias (scanner 1 – scanner 2) of -1.65 ms and -1.33 ms for the “T2* Liver” and “HEMOC” sequences respectively. This was mainly due to the gel with the lowest iron concentration whose T2* would have been more susceptible to local field variations than the others. Removing that gel from the data brought the bias down to -0.60 ms and -0.53 ms.Discussion
There are some differences between the two scanners, but these are minimal at higher iron concentrations. The differences present at lower concentrations may be due to the temperature difference between the two scanner rooms (mean temperature in scanner room 1 and 2 was 21oC and 18oC, respectively) or due to the increased effect of the magnetic field in-homogeneities surrounding the gels. This is unlikely to affect clinical measurements as the temperature of the liver would be more consistent and the local field will be dominated by the surrounding tissue, not air.Conclusion
The use of this novel phantom demonstrated a small bias between scanners; however, this was shown to be too small to affect clinical categorisations. The use of such a phantom allows centres to assess, and correct, present biases. A simple cradle is currently being fashioned to hold the gels suspended in a solution of phantom fluid 18 which will reduce the effects of local field variations around each gel. Regular monthly testing of these gels is currently underway to assess their stability over time.Acknowledgements
No acknowledgement found.References
1. Castiella, A., Alústiza, J. M., Zapata, E. & Emparanza, J. I. Is MRI becoming the new gold standard for diagnosing iron overload in hemochromatosis and other liver iron disorders? Imaging Med. 5, 515–524 (2013).
2. Alústiza, J. M. et al. Measurement of liver iron concentration by MRI is reproducible. Biomed Res. Int. (2015).
3. Sirlin, C. B. & Reeder, S. B. MRI Quantification of liver Iron. Magn. Reson. Imaging Clin. N. Am. 1–40 (2012) doi:10.1016/j.mric.2010.08.014.Magnetic.
4. Szurowska, E. et al. The role of MR imaging in detection of hepatic iron overload in patients with cirrhosis of different origins. BMC Gastroenterol. 10, (2010).
5. Henninger, B., Alustiza, J., Garbowski, M. & Gandon, Y. Practical guide to quantification of hepatic iron with MRI. Eur. Radiol. 30, 383–393 (2020).Henninger, B., Alustiza, J., Garbowski, M. & Gandon, Y. Practical guide to quantification of hepatic iron with MRI. Eur. Radiol. 30, 383–393 (2020).
6. Wood, J. C. et al. MRI R2 and R2* mapping accurately estimates hepatic iron concentration in transfusion-dependent thalassemia and sickle cell disease patients. Blood 106, 1460–1465 (2005).
7. Hankins J, McCarville M, Loeffler R, Smeltzer M, Onciu M, Hoffer F, Li C-S, Wang W, Ware R, Hillenbrand C. R2* magnetic resonance imaging of the liver in patients with iron overload. Blood. 14;113(20):4853-5 (2009)
8. Garbowski M, Carpenter J-P, Smith G, Roughton M, Alam M, He T, Pennell D, Porter J. Biopsy-based calibration of T2* magnetic resonance for estimation of liver iron concentration and comparison with R2 Ferriscan. J Cardiovasc Magn Reson. Jun 10;16(1):40 (2014).
9. Henninger, B., Zoller H, Rauch S, Finkenstedt A, Schocke M, Jaschke W, Kremser C. R2* relaxometry for the quantification of hepatic iron overload: biopsy-based calibration and comparison with the literature. RoFo Jun;187(6):472-9 (2015)
10. Sellers, R. MR LiverLab. MAGNETOM Flash 39–43 (2016).
11. Kannengiesser, S. & Ph, D. Iron Quantification with LiverLab. Siemens Healthc. 44–46 (2016).
12. Philips. Non-invasive assessment of myocardial tissue characteristics Philips StarQuant for 1.5T and 3.0T systems Key. www.philips.com/healthcare (2015). 13. Eskreis-Winkler, S. et al. IDEAL-IQ in an oncologic population: meeting the challenge of concomitant liver fat and liver iron. doi:10.1186/s40644-018-0167-3.
14. T1 & T2 Gels MRI Gel Tubes A set of 18 gel-filled tubes with calibrated T1 and T2 values, sized to insert into the contrast sections of MagIQ Solo and MagIQ Duo phantoms. www.leedstestobjects.com (2015).
15. Mobini, N., Malekzadeh, M., Haghighatkhah, H. & Saligheh Rad, H. A hybrid (iron–fat–water) phantom for liver iron overload quantification in the presence of contaminating fat using magnetic resonance imaging. Magn. Reson. Mater. Physics, Biol. Med. 33, 385–392 (2020).
16. McHugh ML. Interrater reliability: the kappa statistic. Biochemia medica: Biochemia medica. 2012;22(3):276-82.
17. Giavarina D. Understanding Bland Altman analysis. Biochem Med (Zagreb). 2015;25(2):141-151. Published 2015 Jun 5. doi:10.11613/BM.2015.015
18. Phantom Test Guidance for Use of the Large MRI Phantom for the ACR MRI Accreditation Program, American College of Radiology, (2018).
Figures