2399
Reproducibility of MR Elastography Stiffness Measurements across Field Strength in Obese Adults1Department of Radiology, University of Wisconsin - Madison, Madison, WI, United States, 2Department of Radiology and Nuclear Medicine, Universität zu Lübeck, Lübeck, Germany, 3Department of Radiology, University of California San Diego, San Diego, CA, United States, 4Computational and Applied Statistics Laboratory, San Diego Supercomputer Center, University of California San Diego, La Jolla, CA, United States, 5Department of Medical Physics, University of Wisconsin - Madison, Madison, WI, United States, 6Department of Biomedical Engineering, University of Wisconsin - Madison, Madison, WI, United States, 7Department of Electrical and Computer Engineering, University of Wisconsin - Madison, Madison, WI, United States, 8Department of Medicine, University of Wisconsin - Madison, Madison, WI, United States, 9Department of Emergency Medicine, University of Wisconsin - Madison, Madison, WI, United States
Synopsis
MR elastography (MRE) allows for the quantification of liver stiffness as a quantitative biomarker of liver fibrosis. Between field strength reproducibility has been shown to be high in non-obese populations. Data in obese individuals are limited, however, and obese patients may benefit from early diagnosis as they have an increased risk of liver fibrosis. Therefore, in this work we examined the reproducibility of MRE measurements across field strength in a cohort of 34 obese adults. MRE based liver stiffness measurements were highly reproducible between field strengths. Technical success rate was nearly 100% in this challenging, but relevant population.
Introduction
Nonalcoholic fatty liver disease (NAFLD) is the most common cause of chronic liver disease in the western world afflicting about 30% of Americans1-4 and an estimated 1 billion people worldwide. Isolated steatosis (NAFL) may progress to nonalcoholic steatohepatitis (NASH) and cirrhosis, which is associated with an increased risk of liver failure and hepatocellular carcinoma. The presence of fibrosis in NAFLD is a major determining factor of outcome. Early-stage fibrosis may be reversible, thus early detection and quantitative assessment of fibrosis are critical for timely intervention and treatment5.Magnetic resonance elastography (MRE) is a non-invasive method for quantifying liver stiffness as a quantitative biomarker of fibrosis. It has shown high repeatability6 and reproducibility7.
Because obese individuals have increased risk for developing NAFLD, this patient group would benefit from detection of early-stage fibrosis. However, increased subcutaneous adipose tissue in this population may attenuate wave propagation and limit the accuracy and reproducibility of MRE stiffness measurements. Therefore, the question arises whether this particular habitus challenges the acquisition of diagnostic images.
Previous studies have shown good agreement between 1.5T and 3.0T MRE results in non-obese populations8-10.
To date, data describing the diagnostic performance of MRE in obese subjects are limited, despite the clinical relevance that MRE could have in the management of these patients. Therefore, the purpose of this work is to examine the technical success and reproducibility of MRE stiffness measurements at 1.5T and 3.0T in a cohort of obese adults.
Methods
This analysis is part of an ongoing multicenter study in patients undergoing weight loss surgery (WLS). IRB approval and informed consent were obtained from all subjects. We included all study participants who have participated in at least one study visit to date. Each study visit involves MRE on two MR imaging systems at both 1.5T and 3.0T (GE Signa Artist and GE Signa Premier, respectively, Chicago, IL, USA) performed on the same day. The imaging protocol includes two-dimensional spin-echo planar imaging (2D SE-EPI) pulse sequences performed on both systems (Table 1) using a phased array abdominal coil. The MRE data were analyzed by an experienced reader using an image analysis software tool (Resoundant, Inc., Minnesota, USA). Vessels, bile ducts, and the liver edges were avoided, and only areas with bright linear wave patterns and valid pixels were considered when drawing ROIs on four slices of each MRE acquisition. For the analysis of differences, Bland-Altman analysis was performed for shear stiffness values computed under two different fields strengths with other conditions held fixed.Results
34 consecutive patients (30 female), mean age 46.9 years (range: 30-65 years), were included in this analysis (Figure 1). 28 of those patients had additional data from a similar second visit following 2-4 weeks of a low-calorie diet in preparation for weight loss surgery. One patient who completed the second visit did not have analyzable MRE data from the 3.0T examination, due to an erroneously low setting of the MRE motion-encoding gradient (MEG) amplitude. Constituting a technical success rate of 121/122 (99.2%). Thus, in total, we had 61 1.5T/3.0T data pairs.Patient weight and BMI were 130.9kg (range, 93.6-181.6kg) and 46.6 (range, 37.4-58.1) for visit 1 and 126.5kg (range, 90.2-168.7kg) and 45.6 (range, 36.2-56.6) for visit 2 respectively.
Reproducibility analysis of shear stiffness values under two different fields strengths showed high intraclass correlation (ICC = 0.830; 95% CI: 0.627-0.956), although with a small but significant bias (Bias: – 0.088 kPa; 95% CI: (-0.142, -0.035); p<0.001) with consistently higher MRE values obtained at 3.0T. The coefficient of variation for paired data was 7.7% and the reproducibility coefficient was 21.4%. The Bland-Altman plot and additional reproducibility metrics are shown in Figure 2.
Discussion
In this work, we demonstrated high pairwise reproducibility of 2D SE-EPI MRE -derived shear stiffness values across different field strengths in obese adults. The technical success rate of the 2D SE-EPI MRE was higher than 99%. 3.0T yielded consistently higher MRE values compared to 1.5T. However, the observed bias was so small that it can be considered clinically insignificant.Interestingly and somewhat unexpectedly, we observed a higher intraclass correlation coefficient than previous studies conducted in a nonobese population and utilizing the same vendor/pulse sequence combination had (ICC: 0.83 vs. 0.62)8. The RDC observed in this study is not significantly different from the reported RC of 19% at fixed field strength11, suggesting that field strength has minimal impact on measurement variability.
One limitation of this work is that we only examined the agreement between MRE stiffness measurements at 1.5T and 3.0T using one specific pulse sequence. We did so because previous studies had suggested that SE-EPI sequences provide superior image quality and reduced susceptibility artifacts with elevated liver iron content compared to gradient echo sequences12 . Furthermore, this study utilized MRI systems from a single vendor. To thoroughly validate the utility and reproducibility of MRE in obese adults, future studies should include widely used pulse sequences like 2D GRE as well as 3D MRE encoding methods in a multi-vendor study design.
Conclusion
In conclusion, we have demonstrated that MR elastography measurements of liver stiffness are technically feasible and highly reproducible across field strengths in obese adults, a clinically relevant yet technically challenging population.Acknowledgements
This work was supported by the NIH (R01 DK088925). The authors also acknowledge GE Healthcare who provides research support to the University of Wisconsin-Madison, as well as clinical research support from Pfizer Inc.. Dr. Oechtering receives funding from the German Research Foundation (OE 746/1-1). Finally, Dr. Reeder is a Romnes Faculty Fellow, and has received an award provided by the University of Wisconsin-Madison Office of the Vice Chancellor for Research and Graduate Education with funding from the Wisconsin Alumni Research Foundation.References
1. Ahmed A, Wong RJ, Harrison SA. Nonalcoholic Fatty Liver Disease Review: Diagnosis, Treatment, and Outcomes. Clin Gastroenterol Hepatol 2015;13:2062-70.
2. Byrne CD, Targher G. NAFLD: a multisystem disease. J Hepatol 2015;62:S47-64.
3. Torres DM, Williams CD, Harrison SA. Features, diagnosis, and treatment of nonalcoholic fatty liver disease. Clin Gastroenterol Hepatol 2012;10:837-58.
4. Rinella ME. Nonalcoholic fatty liver disease: a systematic review. JAMA 2015;313:2263-73.
5. Arthur MJ. Reversibility of liver fibrosis and cirrhosis following treatment for hepatitis C. Gastroenterology 2002;122:1525-8.
6. Hines CD, Bley TA, Lindstrom MJ, Reeder SB. Repeatability of magnetic resonance elastography for quantification of hepatic stiffness. J Magn Reson Imaging 2010;31:725-31.
7. Shire NJ, Yin M, Chen J, et al. Test-retest repeatability of MR elastography for noninvasive liver fibrosis assessment in hepatitis C. J Magn Reson Imaging 2011;34:947-55.
8. Trout AT, Serai S, Mahley AD, et al. Liver Stiffness Measurements with MR Elastography: Agreement and Repeatability across Imaging Systems, Field Strengths, and Pulse Sequences. Radiology 2016;281:793-804.
9. Yasar TK, Wagner M, Bane O, et al. Interplatform reproducibility of liver and spleen stiffness measured with MR elastography. J Magn Reson Imaging 2016;43:1064-72.
10. Kim HJ, Kim B, Yu HJ, et al. Reproducibility of hepatic MR elastography across field strengths, pulse sequences, scan intervals, and readers. Abdom Radiol (NY) 2020;45:107-15.
11. QIBA. QIBA Profile: Magnetic Resonance Elastography of the Liver. RSNA. May 2, 2018. https://qibawiki.rsna.org/images/6/66/MRE-QIBA_Profile-2021-06-22-CONSENSUS-maintenance.pdf. Accessed November 10, 2021.
12. Wagner M, Besa C, Bou Ayache J, et al. Magnetic Resonance Elastography of the Liver: Qualitative and Quantitative Comparison of Gradient Echo and Spin Echo Echoplanar Imaging Sequences. Investigative radiology 2016;51:575-81.
Figures

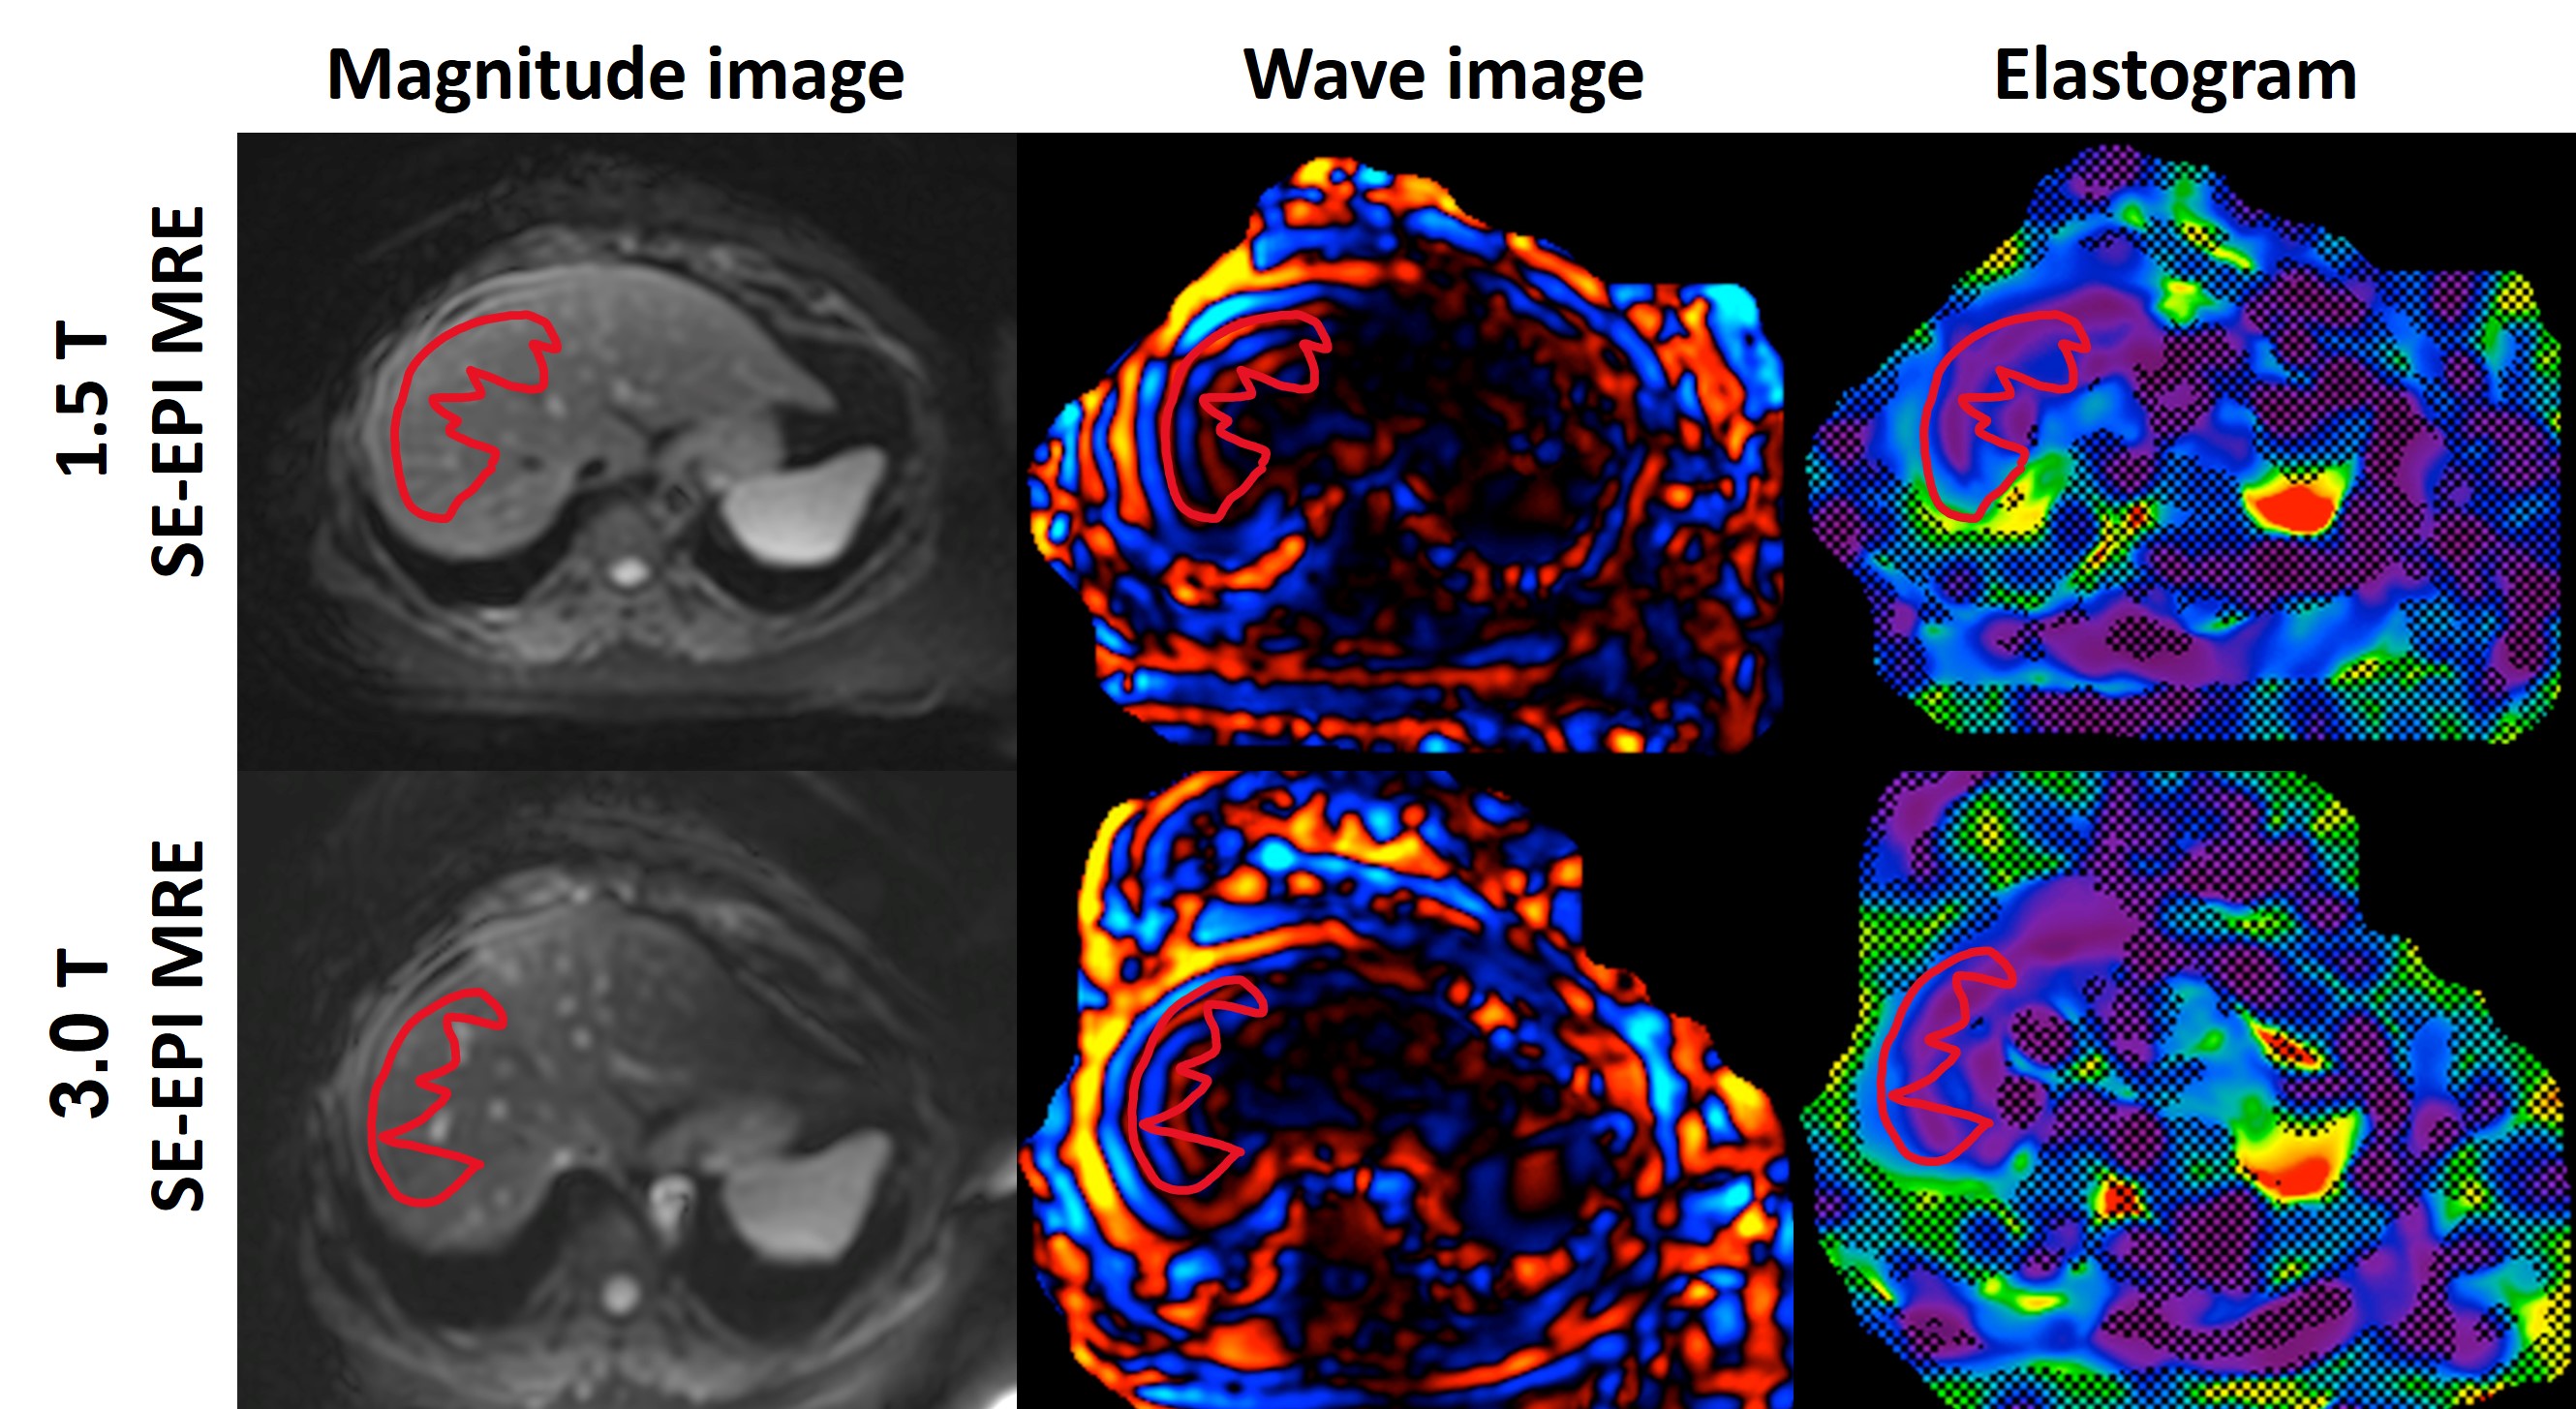
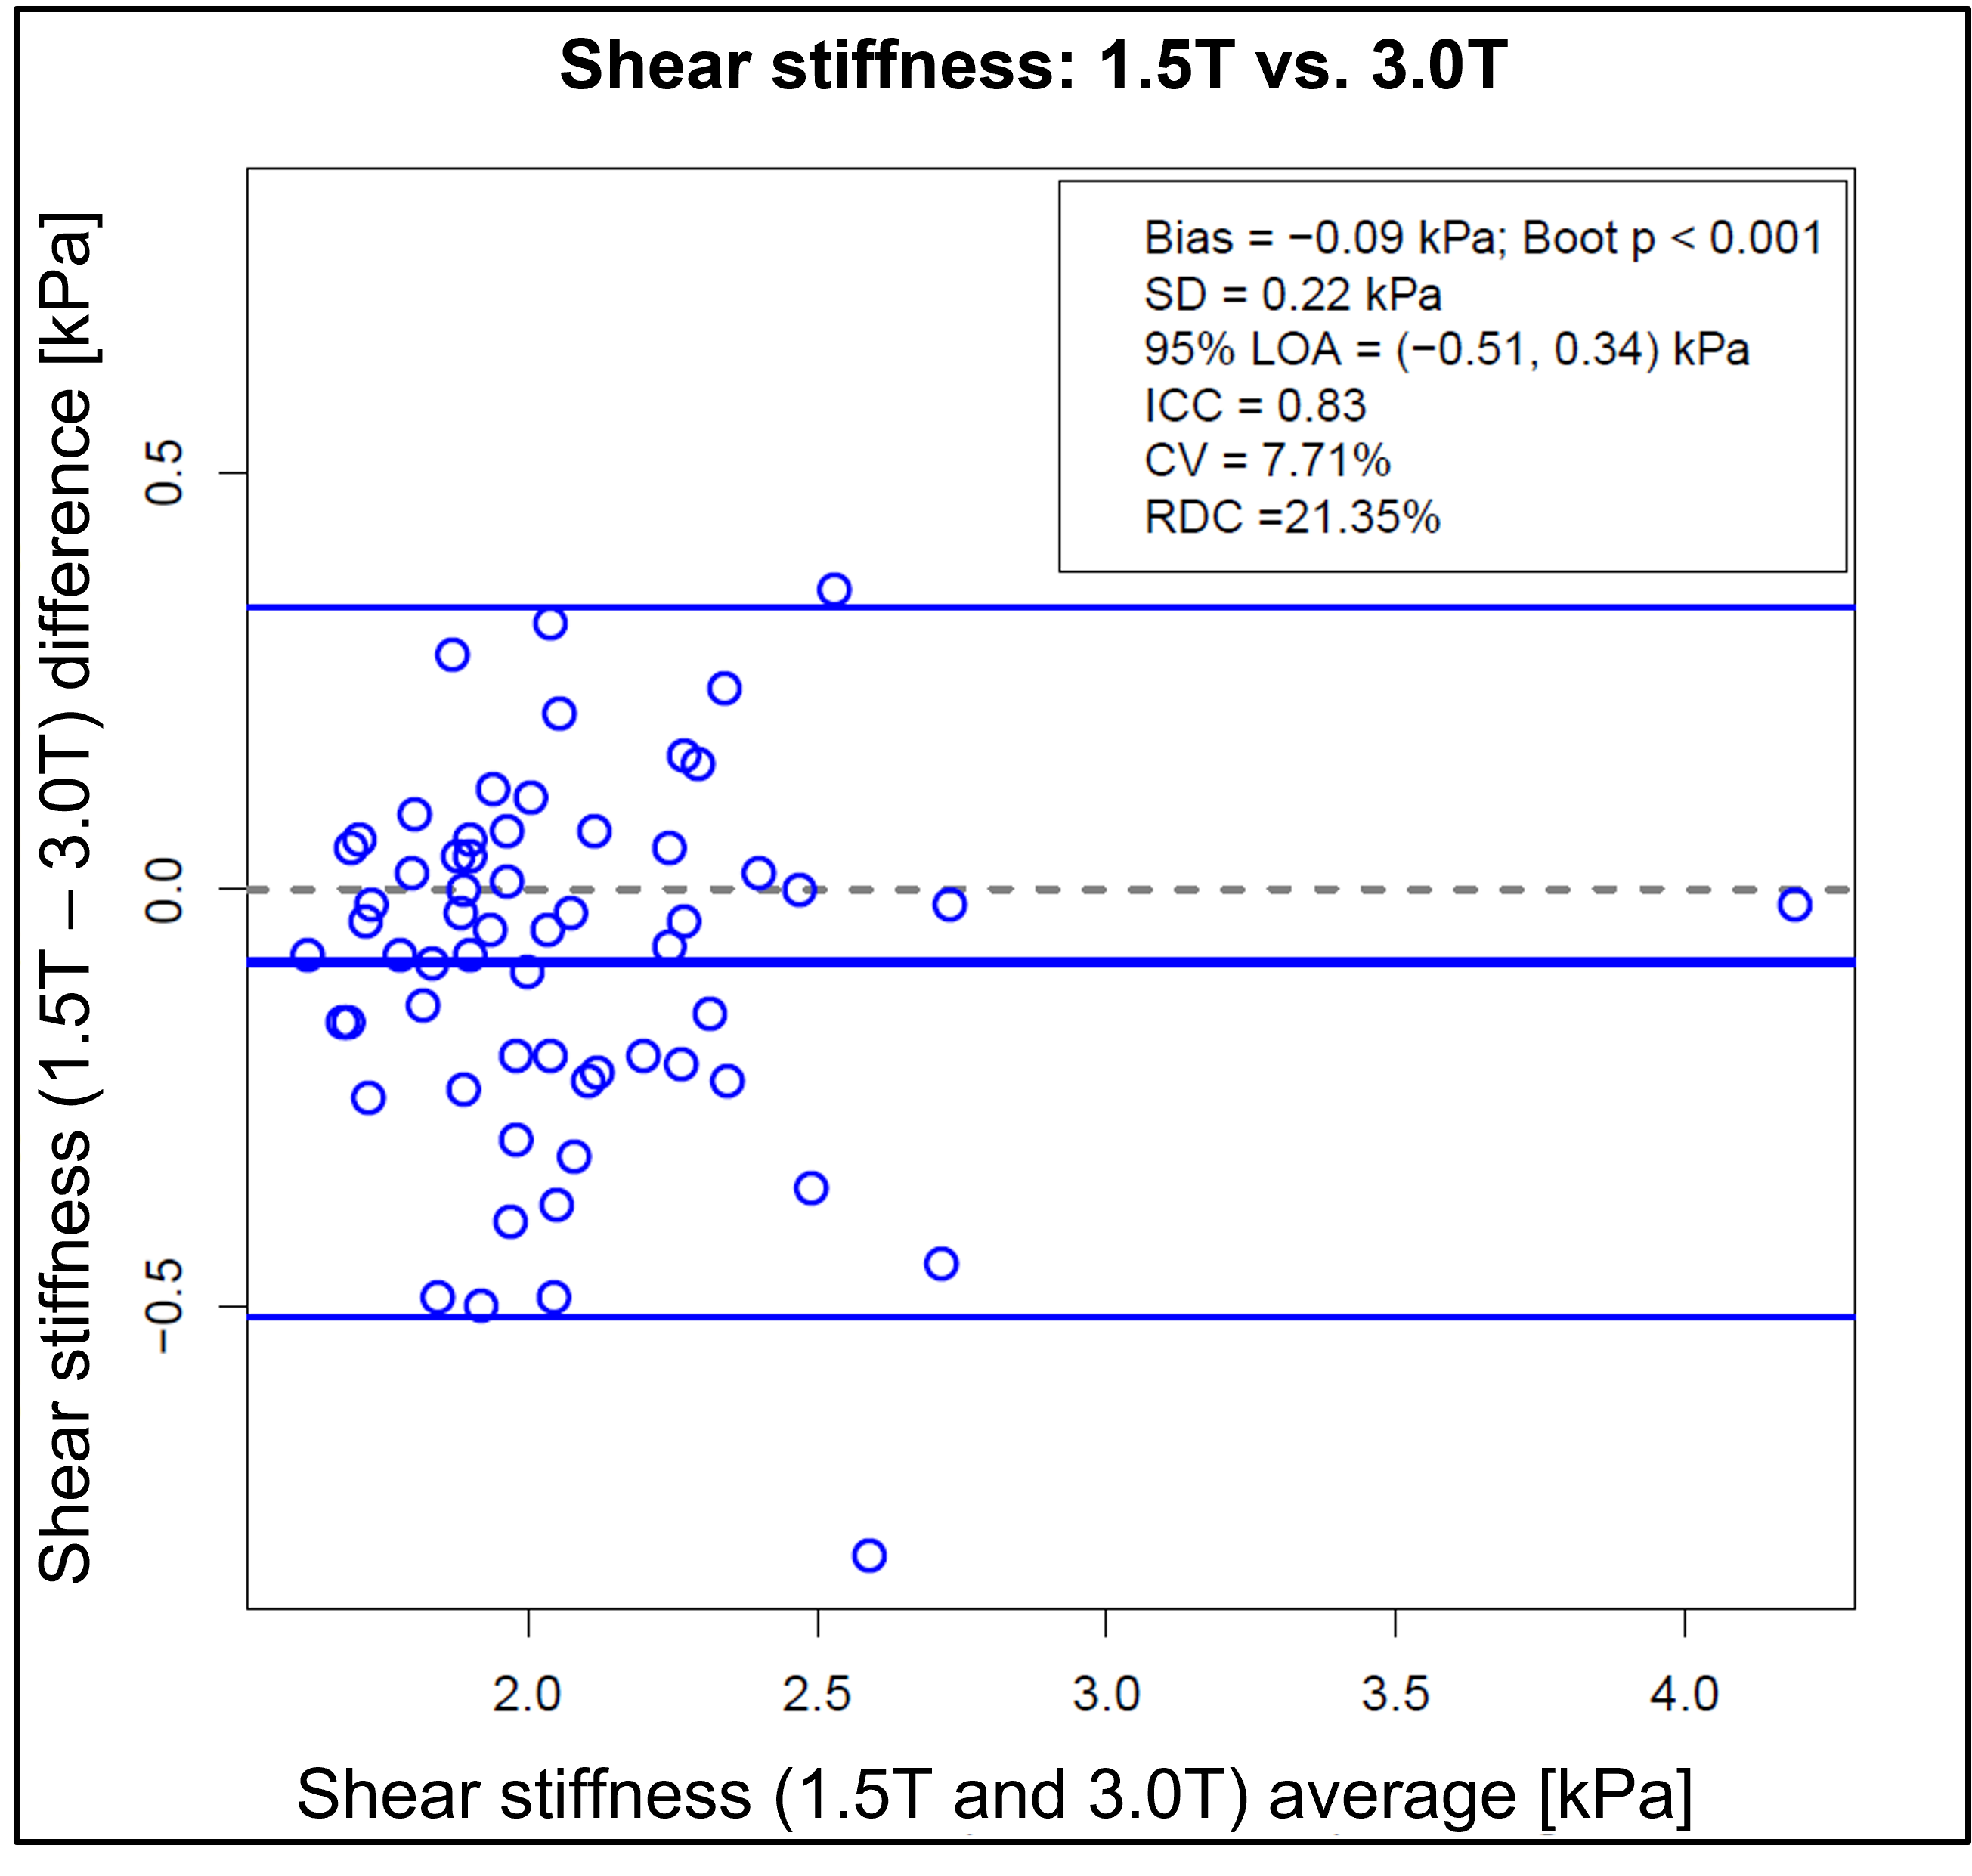
Figure 2: Bland-Altman plot generated for shear stiffness values computed under the fields strengths of 1.5T and 3.0T with other conditions held fixed. Data of visits 1 and visit 2 have been combined.
SD: standard deviation of the differences;
LOA: limits of agreement;
ICC: intraclass correlation coefficient;
CV: Coefficient of variation;
RDC: Reproducibility coefficient.