2398
Quantitative Dixon imaging to characterise early alterations in liver fat in a novel model of diet-induced MAFLD1Laboratory of Molecular Imaging, Agency for Science Technology and Research (A*STAR), Singapore, Singapore, 2University of Liverpool, Liverpool, United Kingdom, 3Lee Kong Chian School of Medicine, Singapore, Singapore, 4Nanyang Technological University, Singapore, Singapore
Synopsis
Introduction
Metabolic associated fatty liver disease (MAFLD) is the hepatic manifestation of metabolic syndrome, with a prevalence of 1 in 4 worldwide1. MAFLD comprises a spectrum of increasingly pathological states with the initiation of lipid accumulation, or steatosis, in the presence of other metabolic aberrations such as in insulin signalling. MAFLD development is mostly attributed to overnutrition and sedentary lifestyles. Steatohepatitis develops as lipotocixity grows and inflammation, immune system involvement and fibrotic deposition is generated. Cirrhosis may follow if steatohepatitis is not abated, characterised by substantial parenchymal replacement and fibrotic scarring.Proton density fat fraction (PDFF) imaging provides quantitative information on fat accumulation and permits in-vivo longitudinal assessment of liver disease progression2.
A LIver Disease Progression Aggravation Diet (LIDPAD) was developed to fill a requirement for a wild-type murine model which matches all physiologically relevant alterations present in human MAFLD, in a suitable timeframe.
Methods
6-8-week-old, wild-type C57BL/6 mice were fed the high-fat LIDPAD (L) or control (C) diet of comparable protein composition, for up to 48 weeks.A multi-gradient eight-point Dixon imaging sequence, using 9.4T Bruker Biospec MR system, was employed to cross-sectionally quantify hepatic fat fraction from 4- (n: L=3, C=3), 8- (n: L=5, C=4) and 16-week (n: L=5, C=6) diet fed mice. Dixon sequence variables; TEs 1.85, 2.08, 2.32, 2.56, 2.80, 3.04, 3.27ms, 3.51; TR 12ms, flip angle 5 degrees, 30 slices, 1mm thickness; 256x256 image size, 40x40mm FOV. High resolution T1 and T2 weighted images were obtained for anatomical information.
After imaging mice were sacrificed and liver tissues collected for high-resolution magic angle spinning nuclear magnetic resonance (HRMAS-NMR) analysis. HRMAS-NMR was performed on 30mg of liver tissues with 10μL TSP reference. Samples spun at 5KHz in a 4mm ZrO2 rotor at 277K.
Dixon imaging data utilised to calculate the PDFF maps using Fat-Water Toolbox3. ROIs were placed in each liver, covering 3350mm3.
Statistical analysis (Mann-Whitney tests) performed on SPSS software.
Standardised methodology was followed for intraperitoneal glucose- and insulin- tolerance tests (IG-/I-TT)4.
Gene expression analysis completed through RNA sequencing.
Results
Hepatic PDFF in LIDPAD-fed mice ranged from 12.9% at four weeks to 30.13% at 16 weeks post-diet-initiation, and was significantly higher than control diet fed mice PDFF (7.4-12.5%) at all timepoints (4 weeks p=0.05, 8 weeks p=0.014, 16 weeks p=0.011) (Figures 1 and 2A).A 2.2-fold increase in LIDPAD liver PDFF was observed between the fourth and eighth week, from 12.9% to 28.9% (p=0.025), but lipid aggregation slowed at the last timepoints (p=0.46).
LIDPAD-fed mouse body weight was significantly higher over controls at every week (Figure 3).
HRMAS-NMR analysis confirmed the trend of swift hepatic lipid accumulation, followed by a plateau (Figure 2B). Mice fed for 12 weeks on the LIDPAD diet exhibited 1.2 times more liver fat than 4-week control livers (p=0.034). 12- and 40-week livers had similar lipid content (p=0.81). A significant decrease in lipid concentration, from 34.2% to 27.5%, was detected between the 40th- and 48th-week in LIDPAD livers (p=0.025).
Insulin response data showed significant deviation in LIDPAD mice from the eighth week through IGTT, with resistance appearing at week 24 (Figure 3B and 3C).
Histological alterations appeared at week one following diet commencement – steatosis histologically scored through H&E staining at this timepoint. Picrosirius red stains revealed fibrosis as early as week 8 in some mice and was present in all LIDPAD livers by week 16 (Figure 4A).
Transcriptomic analyses depicted altered lipid metabolism in LIDPAD-fed mice from week one. Nuclear transcription factors and cholesterol biosynthesis expression was altered compared to control-diet mice. Occurring at the eighth week, upregulated genetic expression of inflammation, immune cell and fibrotic processes occurred (Figure 4B).
Discussion
The LIDPAD diet initiates a pathological sequence in wild-type mice which closely resembles human MAFLD progression. Significant steatosis was observed in-vivo at four weeks through PDFF imaging and was confirmed through histological scoring to be present from the first week. In human disease progression, transcriptomic alterations accompany phenotypical changes. Cholesterol biosynthetic and lipogenic processes display an upregulation, whereas anti-inflammatory and anti-lipolytic signalling decreases5–7. The LIDPAD diet induced the same, with increased cholesterol synthesis and lipogenic LXR/RXR signalling, and a reduced protective FXR/RXR profile.Insulin resistance is a key step in the steatosis-to-steatohepatitis transition, frequently appearing alongside obesity. By week eight, LIDPAD-fed mice were considered obese and insulin signalling dysregulation appears at this timepoint.
Steatohepatitis presented by week 8 where, like human disease, inflammation and immune cell involvement becomes the main pathological feature. Immune cell extravasation is a well characterised feature of steatohepatitis and an indication of increasing disease severity8,9. LIDPAD feeding induced both granulocyte and agranulocyte diapedesis, alongside increased leukocyte extravasation signalling. Gene expression for GADD45, a stress-inducible protein linked to cell survival, had its transcriptomic profile reduced, indicating cellular and organ stress10.
Cirrhosis, end-stage liver disease, results in organ shrinkage from fibrosis. This phenomenon is seen in LIDPAD mice between the 40th and 48th week.
Conclusion
The LIDPAD model shows essential morphological and molecular changes at various stages of MAFLD which mirror human pathology. Metabolic imaging provides a unique way to monitor the full range of MAFLD states affecting liver function in-vivo and can offer a method of early detection to prevent steatohepatitis development.Acknowledgements
We would like to thank the Institute of Bioengineering and Bioimaging and the Lee Kong Chian School of Medicine for their support.References
1. Mitra, S., De, A. & Chowdhury, A. Epidemiology of non-alcoholic and alcoholic fatty liver diseases. Transl. Gastroenterol. Hepatol. 5, (2020).
2. Caussy, C., Reeder, S. B., Sirlin, C. B. & Loomba, R. Non-invasive, quantitative assessment of liver fat by MRI-PDFF as an endpoint in NASH trials HHS Public Access. Hepatology 68, 763–772 (2018).
3. ISMRM Workshop on Fat-Water Separation: Insights, Applications & Progress in MRI. https://www.ismrm.org/workshops/FatWater12/data.htm.
4. Nagy, C. & Einwallner, E. Study of In Vivo Glucose Metabolism in High-fat Diet-fed Mice Using Oral Glucose Tolerance Test (OGTT) and Insulin Tolerance Test (ITT). J. Vis. Exp. 2018, 56672 (2018).
5. Min, H.-K. et al. INCREASED HEPATIC SYNTHESIS AND DYSREGULATION OF CHOLESTEROL METABOLISM IS ASSOCIATED WITH THE SEVERITY OF NONALCOHOLIC FATTY LIVER DISEASE. Cell Metab. 15, 665 (2012).
6. Ni, M. et al. Biological mechanisms and related natural modulators of liver X receptor in nonalcoholic fatty liver disease. Biomed. Pharmacother. 113, 108778 (2019).
7. Biagioli, M. & Fiorucci, S. Bile acid activated receptors: Integrating immune and metabolic regulation in non-alcoholic fatty liver disease. Liver Res. 5, 119–141 (2021).
8. Meli, R., Mattace Raso, G. & Calignano, A. Role of Innate Immune Response in Non-Alcoholic Fatty Liver Disease: Metabolic Complications and Therapeutic Tools. Front. Immunol. 0, 177 (2014).
9. Bartneck, M. & Wang, J. Therapeutic Targeting of Neutrophil Granulocytes in Inflammatory Liver Disease. Front. Immunol. 10, (2019).
10. Tanaka, N. et al. Growth arrest and DNA damage-inducible 45α protects against nonalcoholic steatohepatitis induced by methionine- and choline-deficient diet. Biochim. Biophys. Acta 1863, 3170 (2017).
Figures
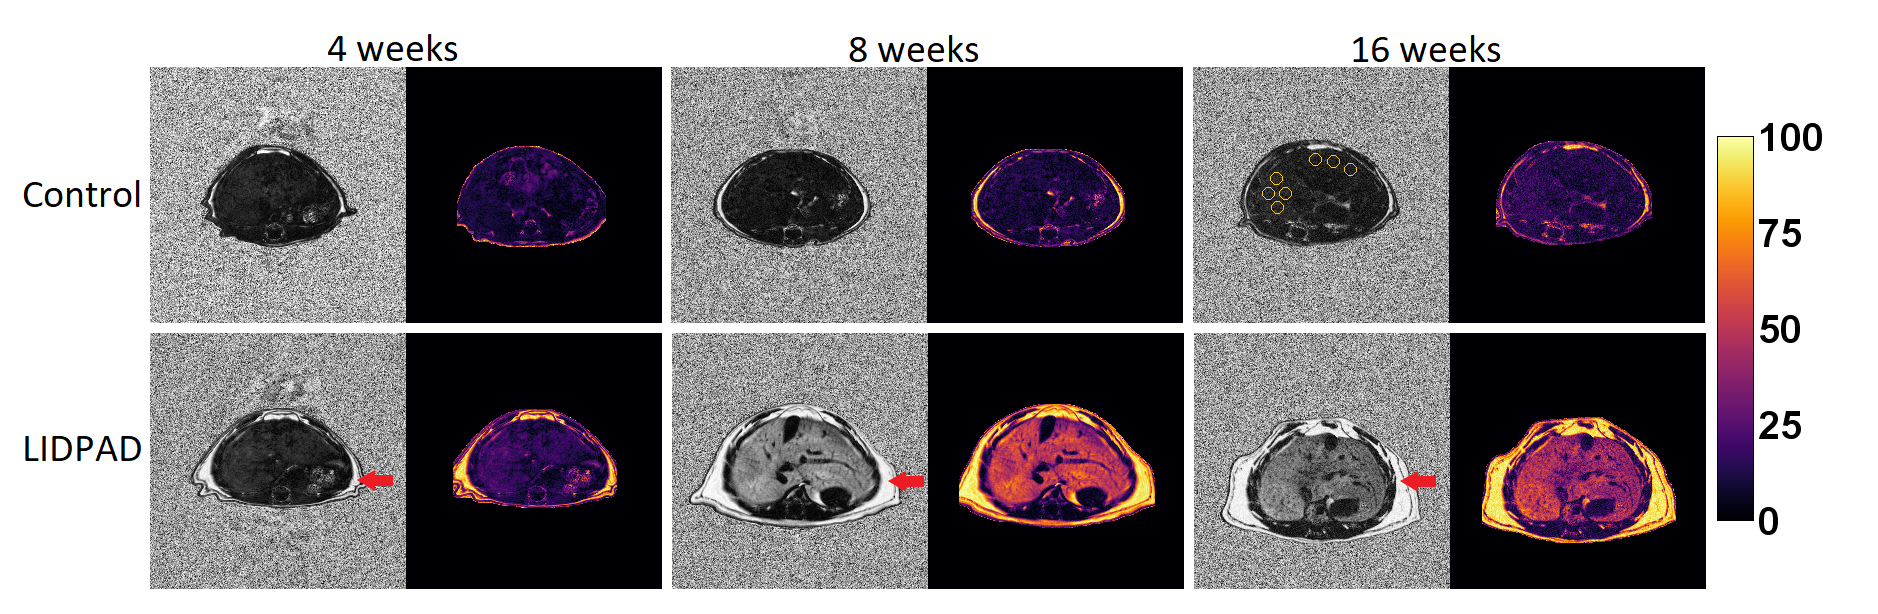
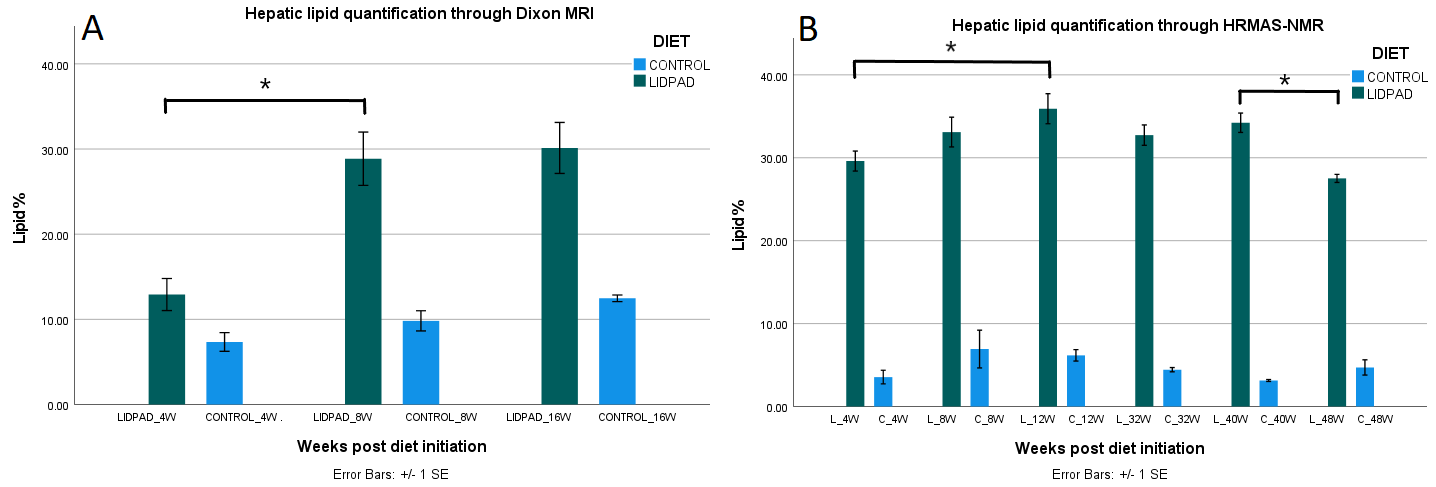
Figure 2: Proton density fat fraction (A) and HMRAS-NMR (B) quantification of liver fat in control and LIDPAD mice. Peak fat content is reached between 12 and 16 weeks, followed by a plateau and eventual decrease in lipid content.
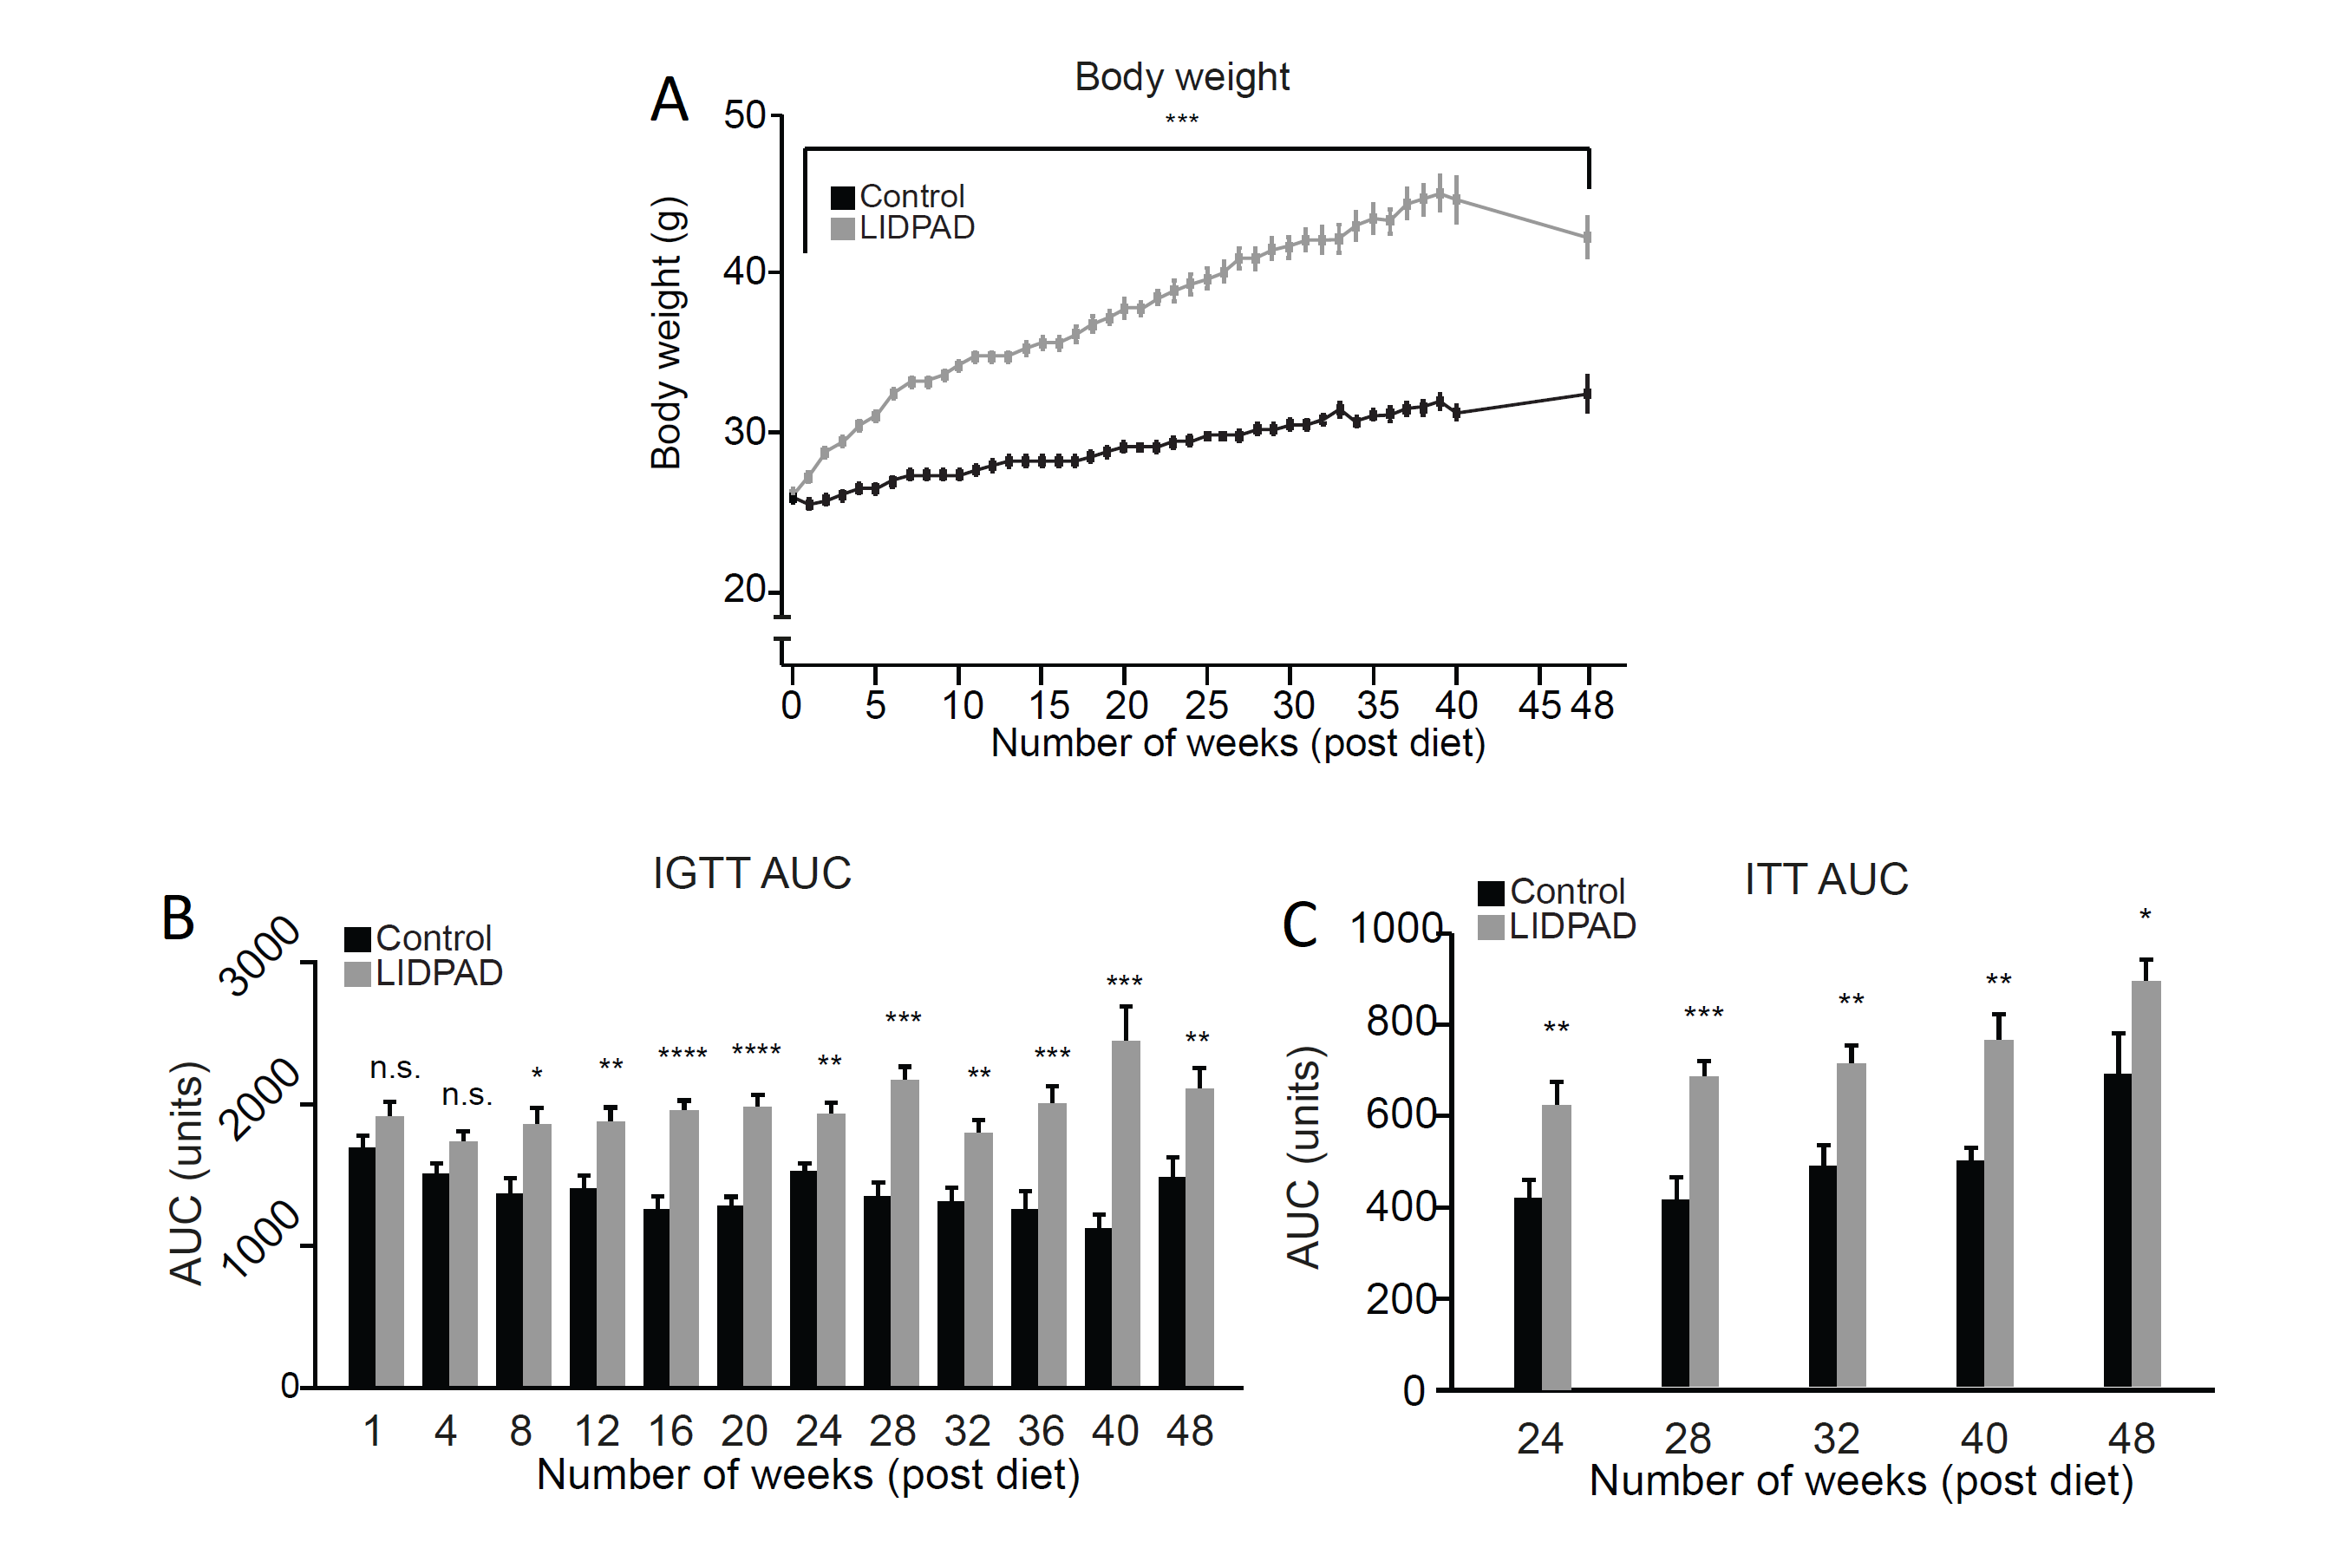
Intraperitoneal glucose tolerance test (B) and Insulin tolerance test (C) depict difference in blood glucose levels. Significance in IGTT area under the curve values seen at week 8 in LIDPAD mice over control counterparts. Reveals elevated blood glucose when physiologically typical mice had reduced glucose load. ITT reveals insulin resistance at 24 weeks as administered insulin fails to elicit reduction in blood sugar concentration.
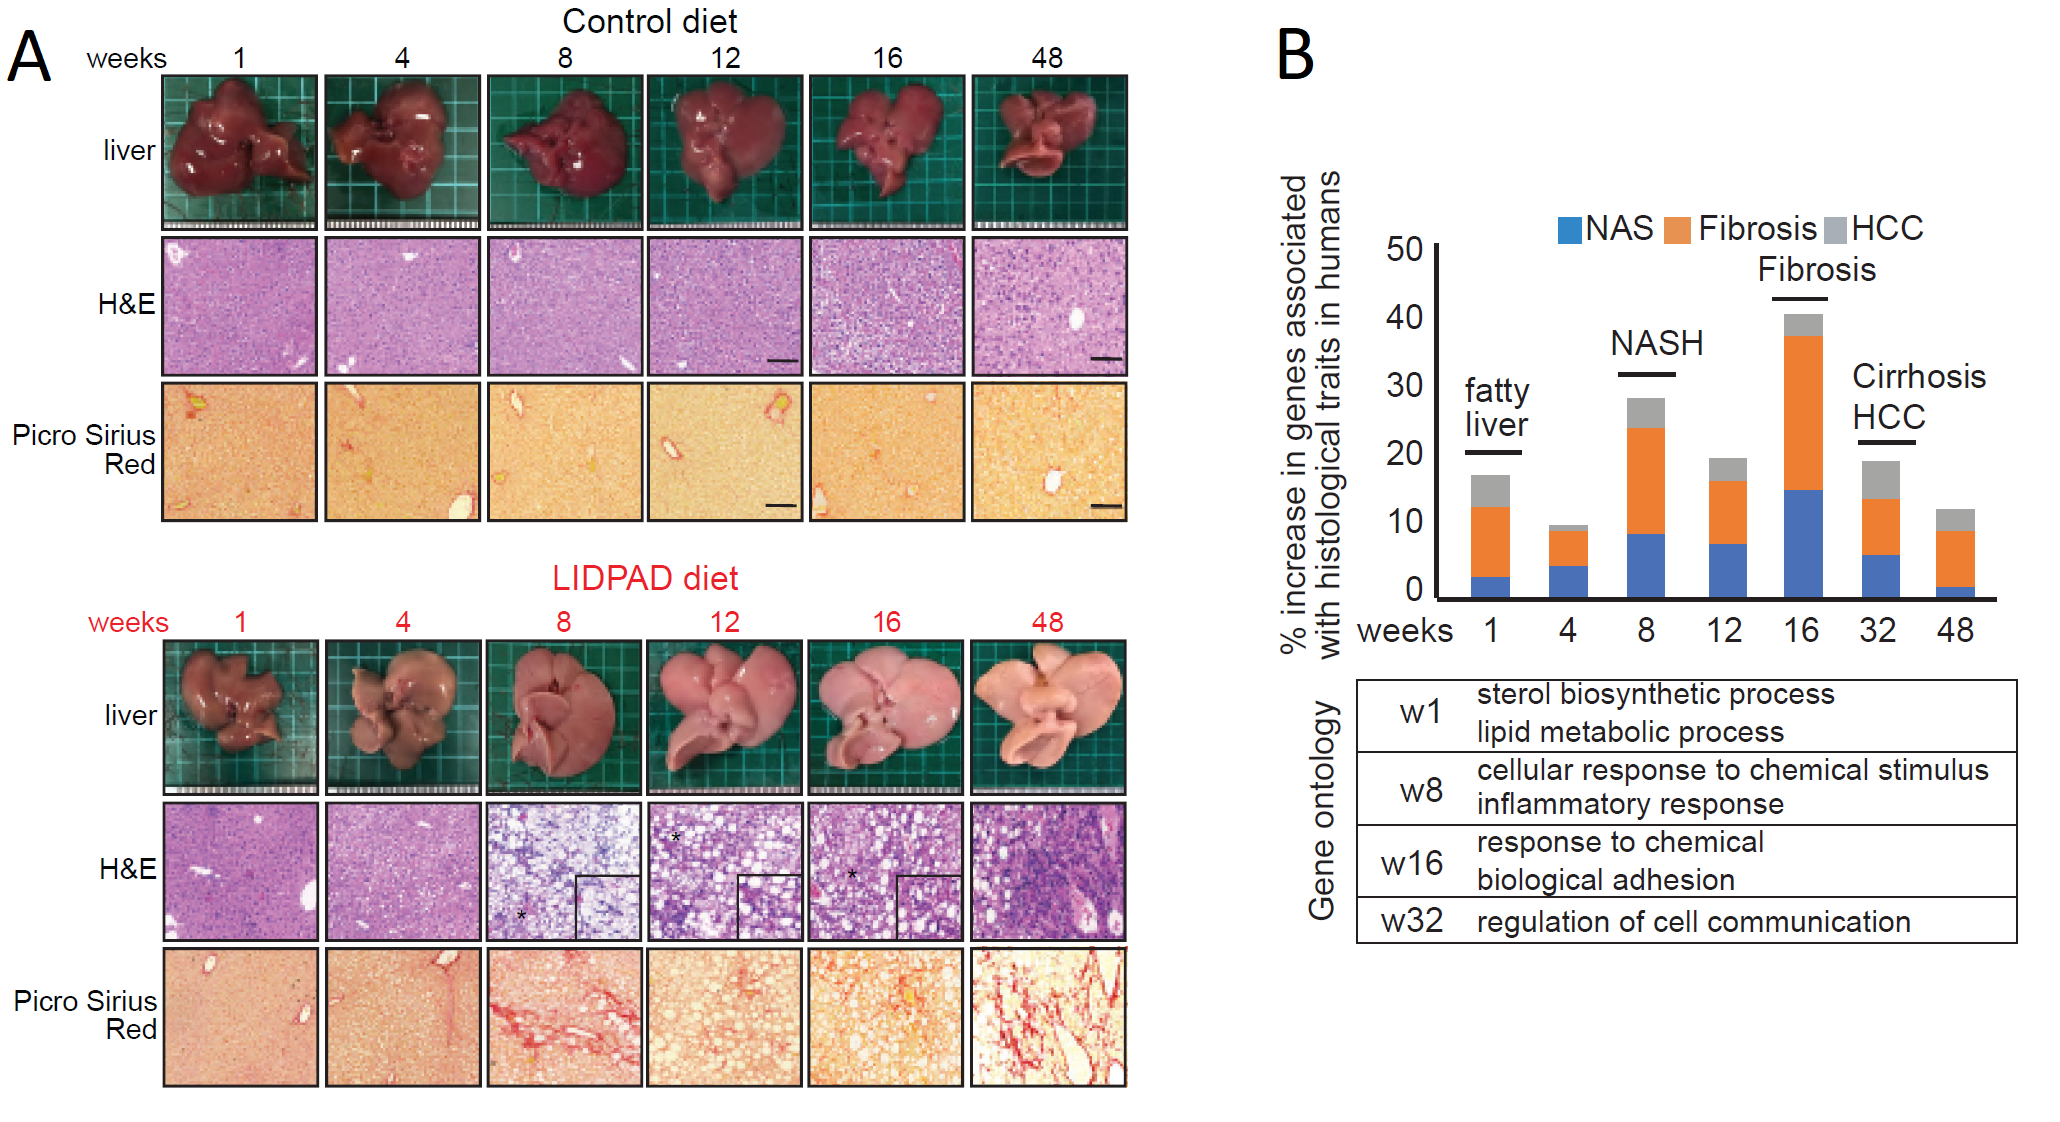
Figure 4: (A) Histologic changes in control and LIDPAD mice. H&E staining highlights lipid accumulation while Picrosirius Red stains reveal fibrotic activity.
(B) Gene expression levels associated in progression of disease, showing transcriptomic switches at key stages of increasing severity.