2397
Accuracy of a commercial high-speed T2-corrected multi-echo single voxel sequence at 3T as a function of R2* for measurement of liver fat content1Medical Imaging, McGill University Health Center, Montreal, QC, Canada, 2Medical Physics Unit, McGill University, Montreal, QC, Canada, 3Research Institute of McGill University Health Center, Montreal, QC, Canada, 4Diagnostic Radiology, McGill University, Montreal, QC, Canada, 5Montreal Imaging Experts, Inc., Montreal, QC, Canada
Synopsis
Commercial methods for single breath-hold proton density fat fraction (PDFF) quantification in liver can suffer from bias due to the presence of iron. In this work, the PDFF accuracy of a high-speed T2-corrected multi-echo (HISTO) sequence was evaluated at 3T in phantoms at variable R2*, mimicking different iron levels. PDFF errors up to 70% for R2* larger than 150 s-1 were obtained, suggesting that HISTO is unreliable at large liver R2*, as seen with moderate to high iron overload. A Dixon sequence was more accurate at large R2*. Both techniques agreed in patients and phantoms at low PDFF and R2*.
INTRODUCTION
Liver fat quantification is crucial for diagnosis and treatment monitoring of non-alcoholic fatty liver disease. Many noninvasive techniques based on magnetic resonance imaging (MRI) and spectroscopy have shown excellent accuracy1,2, and are now available on MRI systems. The accuracy, repeatability, and reproducibility of selected techniques were investigated in a phantom study at 1.5T and 3T3. In that study, two techniques available from one vendor, qDixon (multi-echo Dixon) and HISTO (high-speed T2-corrected multi-echo single voxel spectroscopy), demonstrated high accuracy3. qDixon and HISTO were also consistent for muscle fat quantification at 3T4. In liver, the presence of iron increases R2* and biases the MR-based fat quantification5. HISTO has been validated in the presence of iron at 1.5T in phantoms6,7. This work presents an evaluation of HISTO fat fraction accuracy with variable R2* at 3T for liver imaging.METHODS
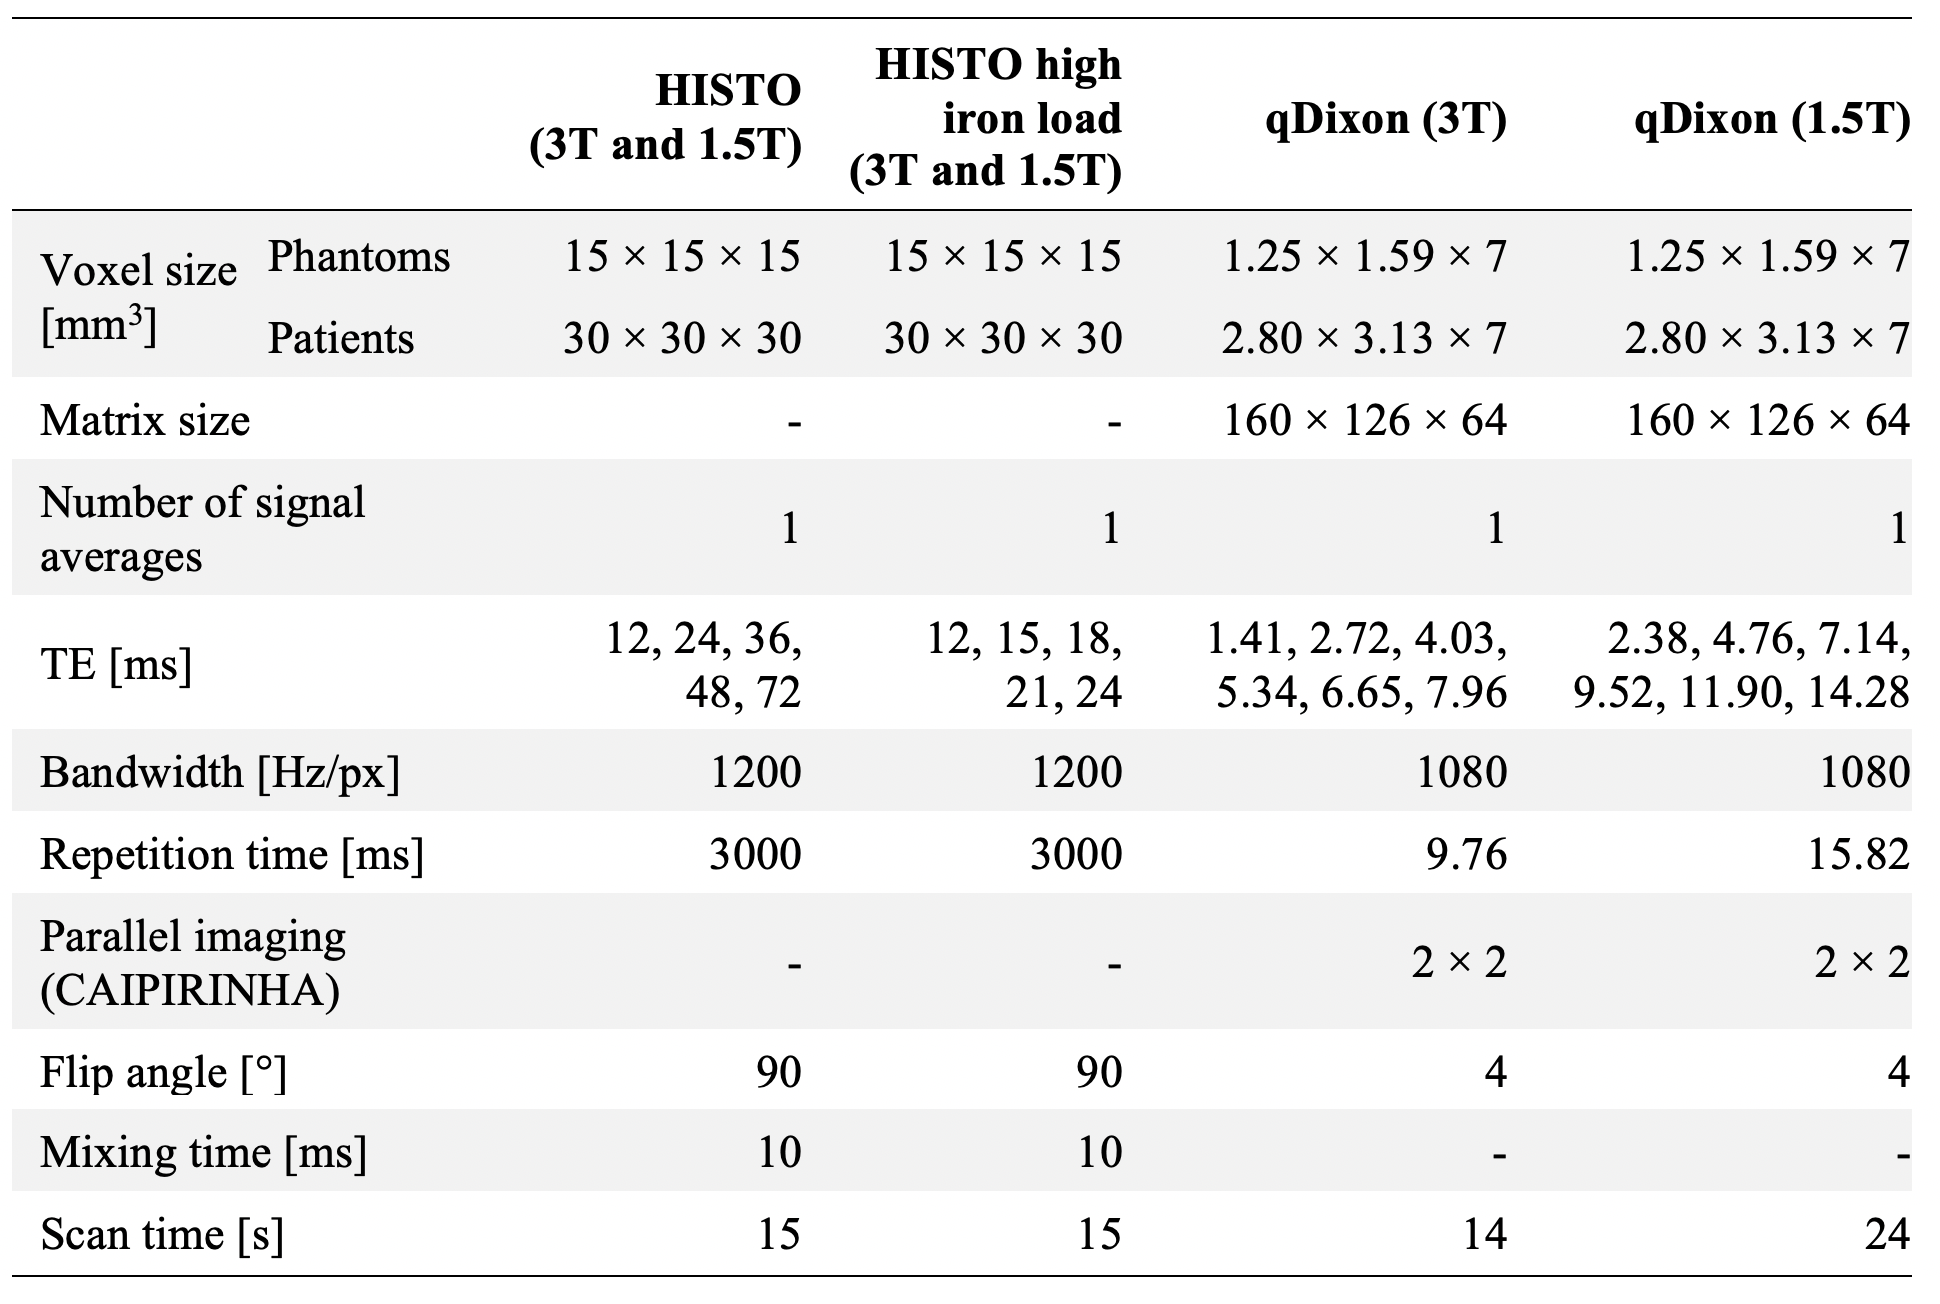
A liquid safflower oil emulsion (Microlipid, Nestle Inc.) with a 52.30% fat mass fraction was used. The emulsion was diluted with distilled deionized water to produce four fat mass fractions (Ftrue) (3.15, 12.67, 25.60, and 38.81%). Seven 50-ml vials of each Ftrue were prepared and doped with manganese chloride (MnCl2, Sigma-Aldrich Inc.) with a concentration ranging from 0 to 5 mM to modulate the R2*. The vials were placed in a larger container filled with water doped with gadolinium-based contrast agent (0.10 mM) and sodium chloride (85 mM). Four experiments were performed, each featuring seven vials with a single Ftrue and variable R2*.Measurements were performed at 1.5T (Siemens Aera) and 3T (Siemens Skyra), using a 20-channel head coil, at room temperature, using three fat quantification techniques: qDixon, HISTO, and HISTO with reduced echo times (HISTO_high_iron_load). Sequence parameters are summarized in Table 1. Proton density fat fraction (PDFF) and R2* maps from qDixon, and PDFF from HISTO, were obtained from post-processing software on the MRI systems. Circular regions of interest with an area of 2.5 cm2 were drawn using RadiAnt in each vial to measure the mean and standard deviation of the PDFF and R2* from qDixon. R2* variations as a function of [MnCl2] were evaluated for all Ftrue. PDFF accuracy was compared to Ftrue as a function R2*.
A retrospective review of patient datasets acquired for clinically indicated abdominal exams was performed under approval of our Research Ethics Board. 110 patients and 129 patients were identified, examined at 1.5T and 3T respectively using the same MRI systems as the phantom experiments. All datasets included the HISTO and qDixon sequences, each acquired during a single breath-hold (sequence parameters in Table 1). Datasets with fat-water swaps in qDixon maps were excluded, leaving 98 patients at 1.5T and 122 at 3T. HISTO PDFF was compared to qDixon whole liver mean PDFF, obtained from the post-processing tools on the MRI systems.
RESULTS AND DISCUSSION
At large Ftrue and [MnCl2], R2* estimated with qDixon deviated from the expected linear variation as a function of [MnCl2] at both field strengths (Figure 1). 6 vials out of 28 were excluded from further analysis based on visual assessment due to the unreliable qDixon results.HISTO PDFF overestimated Ftrue at both field strengths as R2* increased (Figure 2). PDFF from HISTO_high_iron_load was slightly more accurate as a function of R2*. PDFF was accurate at both field strengths for R2* up to 100 s-1 with HISTO and up to 170 s-1 with HISTO_high_iron_load, beyond which the error was greater than 10%. qDixon was more robust to R2* variations, with less than 10% PDFF error over the entire R2* range. Normal liver R2* values between 24 and 74 s-1 have been reported at 1.5T8–10, and a threshold between 67 and 88 s-1 indicates mild iron overload at 1.5T10. Severe iron overload can produce R2* larger than 900 s-1 at 1.5T9,11. In this work, HISTO results at 1.5T contradict a previous report6 of a maximum PDFF error of 3.4% for an R2 up to 140 s-1 (R2* not reported). One recent study reported a threshold of 117 s-1 for the presence of mild iron overload at 3T12.
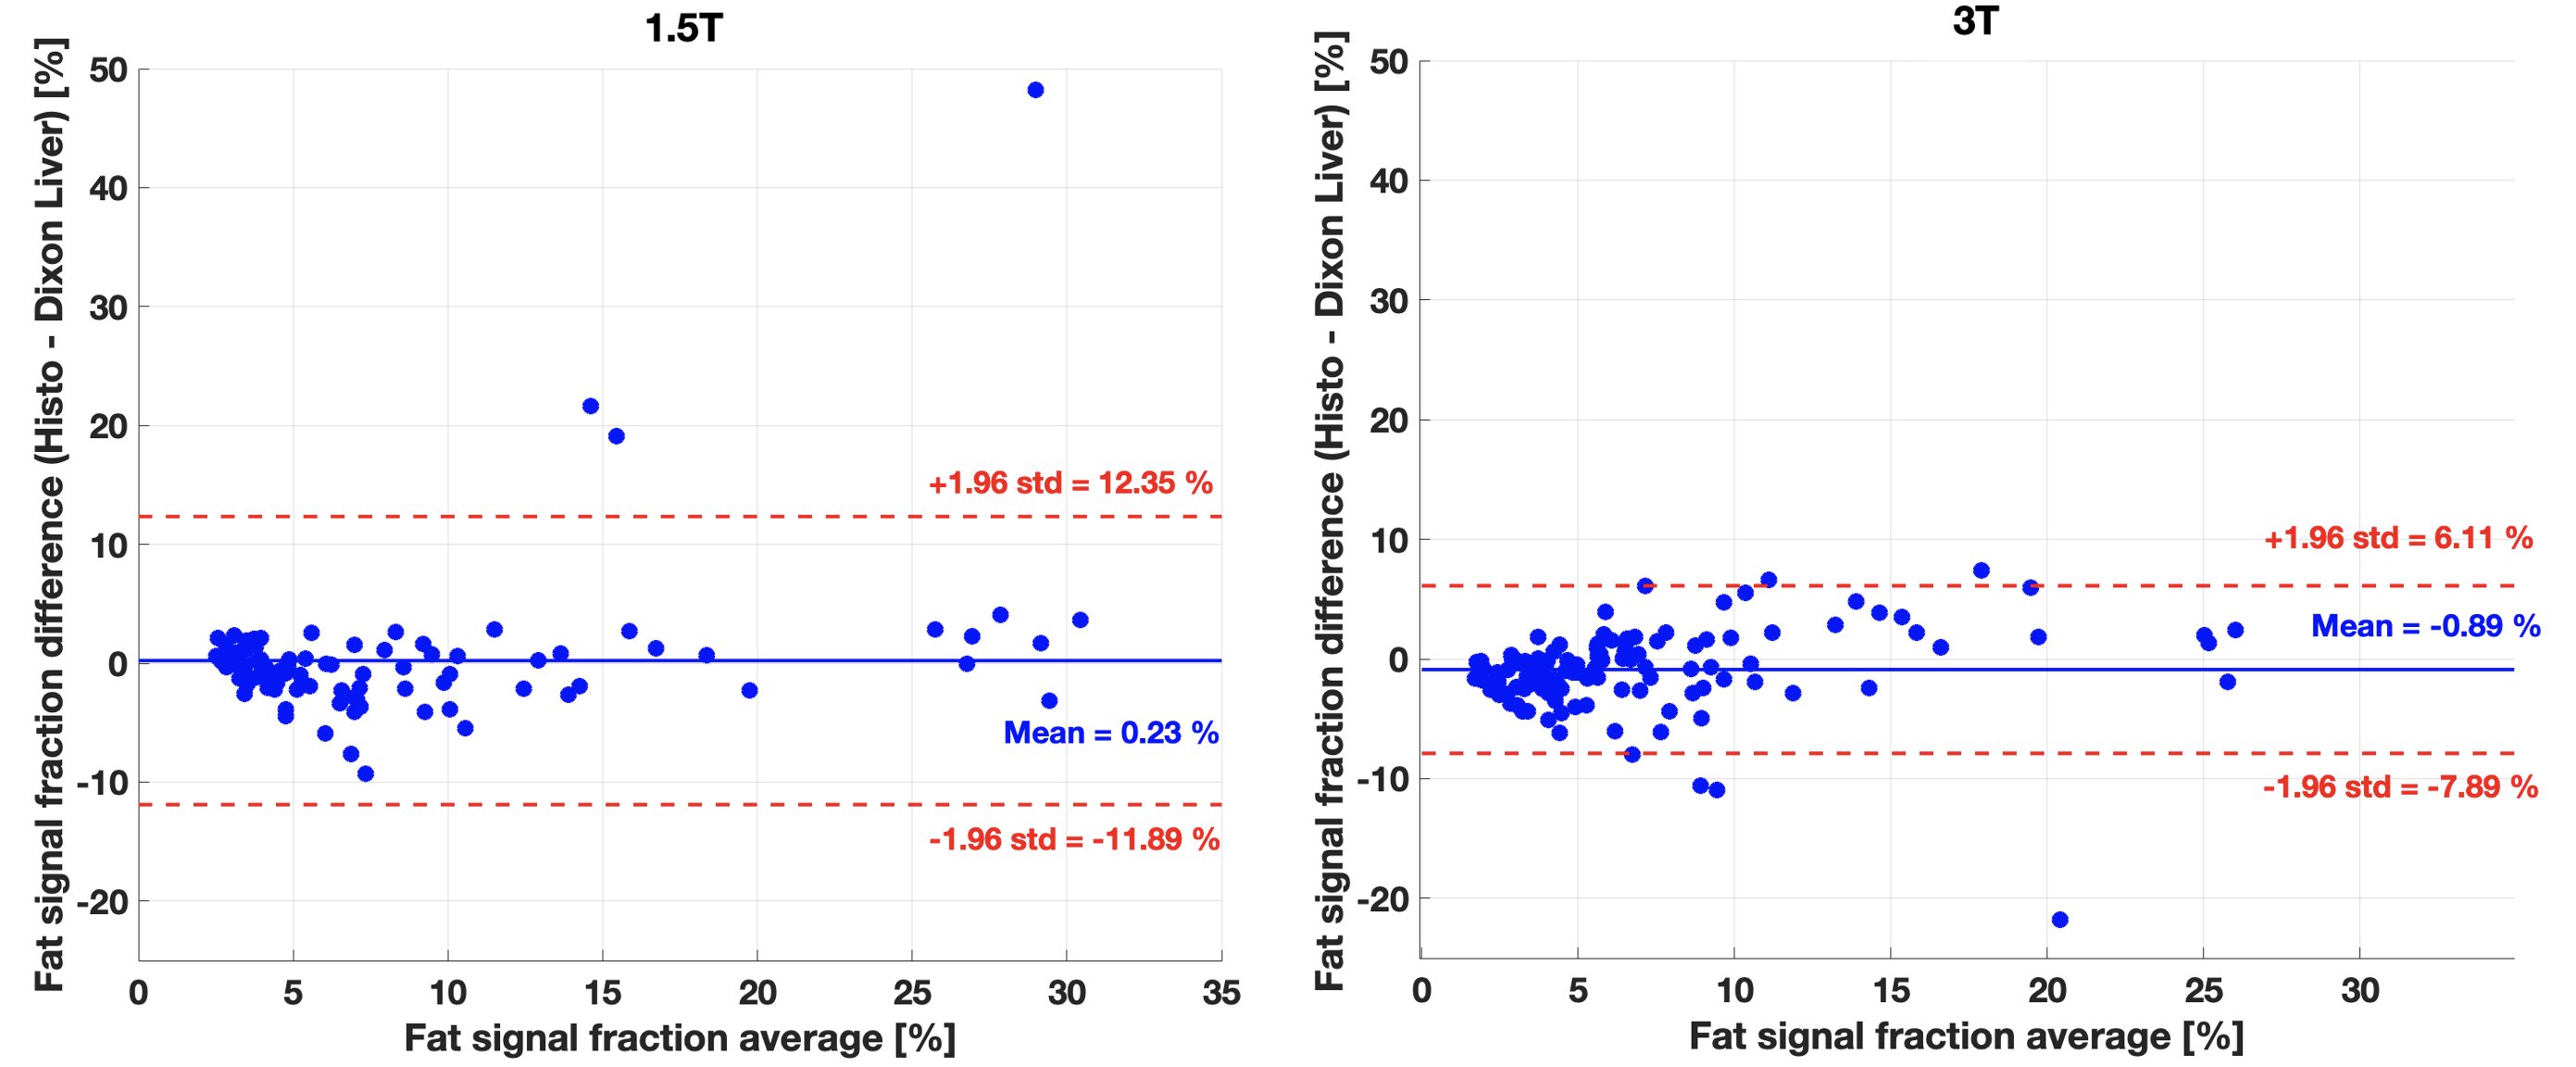
In patients, HISTO PDFF was comparable to qDixon at both field strengths (Figure 3), consistent with a previous study3. The bias between the two techniques at both field strengths was smaller than 1%, significant based on a paired t-test at 3T (p=0.007), but not significant at 1.5T (p=0.71). qDixon PDFF ranged from 1.5 to 31.0% (median=6.0%) in patients at 1.5T, and from 1.9 to 37.9% (median=5.8%) at 3T. The R2* range in patients was from 20 to 155 s-1 (median=35 s-1) at 1.5T, and 33 to 160 s-1 (median=54 s-1) at 3T. Most R2* measurements in patients were smaller than 100 s-1 (99% at 1.5T and 94% at 3T), most likely explaining the small PDFF bias observed between the two techniques in patients.
CONCLUSION
qDixon should be preferred over HISTO for assessment of liver PDFF because of its robustness to R2* variations. Phantom measurements suggest that HISTO should only be used in patients with little or no liver iron overload, and that the HISTO_high_iron_load sequence should be preferred over HISTO, especially at 3T. Further validation in patients with moderate to high iron overload is needed to confirm these results.Acknowledgements
References
1. Starekova J, Reeder SB. Liver fat quantification: where do we stand? Abdom Radiol. 2020:1-14. doi:10.1007/s00261-020-02783-1
2. Kukuk GM, Hittatiya K, Sprinkart AM, et al. Comparison between modified Dixon MRI techniques, MR spectroscopic relaxometry, and different histologic quantification methods in the assessment of hepatic steatosis. Eur Radiol. 2015;25(10):2869-2879. doi:10.1007/s00330-015-3703-6
3. Jang JK, Lee SS, Kim B, et al. Agreement and Reproducibility of Proton Density Fat Fraction Measurements Using Commercial MR Sequences Across Different Platforms: A Multivendor, Multi-Institutional Phantom Experiment. Invest Radiol. 2019;54(8):517-523. doi:10.1097/RLI.0000000000000561
4. Li Z, Zeng H, Han C, et al. Effectiveness of high-speed T2-corrected multiecho MR spectroscopic method for quantifying thigh muscle fat content in boys with duchenne muscular dystrophy. Am J Roentgenol. 2019;212(6):1354-1360. doi:10.2214/AJR.18.20354
5. Sharma P, Altbach M, Galons JP, Kalb B, Martin DR. Measurement of liver fat fraction and iron with MRI and MR spectroscopy techniques. Diagnostic Interv Radiol. 2014;20(1):17-26. doi:10.5152/dir.2013.13124
6. Sharma P, Martin DR, Pineda N, et al. Quantitative analysis of T2-correction in single-voxel magnetic resonance spectroscopy of hepatic lipid fraction. J Magn Reson Imaging. 2009;29(3):629-635. doi:10.1002/jmri.21682
7. Pineda N, Sharma P, Xu Q, Hu X, Vos M, Martin DR. Measurement of hepatic lipid: High-speed T2-corrected multiecho acquisition at 1H MR spectroscopy - A rapid and accurate technique. Radiology. 2009;252(2):568-576. doi:10.1148/radiol.2523082084
8. Obrzut M, Atamaniuk V, Glaser KJ, et al. Value of liver iron concentration in healthy volunteers assessed by MRI.Sci Rep. 2020;10(1):1-8. doi:10.1038/s41598-020-74968-z
9. Wood JC, Enriquez C, Ghugre N, et al. MRI R2 and R2* mapping accurately estimates hepatic iron concentration in transfusion-dependent thalassemia and sickle cell disease patients. Blood. 2005;106(4):1460-1465. doi:10.1182/blood-2004-10-3982
10. Henninger B, Alustiza J, Garbowski M, Gandon Y. Practical guide to quantification of hepatic iron with MRI. Eur Radiol. 2020;30(1):383-393. doi:10.1007/s00330-019-06380-9
11. Yokoo T, Yuan Q, Sénégas J, Wiethoff AJ, Pedrosa I. Quantitative R2∗ MRI of the liver with rician noise models for evaluation of hepatic iron overload: Simulation, phantom, and early clinical experience. J Magn Reson Imaging. 2015;42(6):1544-1559. doi:10.1002/jmri.24948
12. D’Assignies G, Paisant A, Bardou-Jacquet E, et al. Non-invasive measurement of liver iron concentration using 3-Tesla magnetic resonance imaging validation against biopsy. Eur Radiol. 2018;28(5):2022-2030. http://dx.doi.org/10.1016/j.saa.2011.09.061.
Figures