2396
PDFF predicts NASH in obese patients without known liver disease1Department of Radiology, University of Wisconsin - Madison, Madison, WI, United States, 2Department of Radiology and Nuclear Medicine, Universität zu Lübeck, Lübeck, Germany, 3Department of Radiology, University of California San Diego, San Diego, CA, United States, 4Computational and Applied Statistics Laboratory, San Diego Supercomputer Center, University of California San Diego, La Jolla, CA, United States, 5Department of Pathology and Laboratory Medicine, University of Wisconsin - Madison, Madison, WI, United States, 6Department of Medical Physics, University of Wisconsin - Madison, Madison, WI, United States, 7Department of Medicine, University of Wisconsin - Madison, Madison, WI, United States, 8Department of Biomedical Engineering, University of Wisconsin - Madison, Madison, WI, United States, 9Department of Emergency Medicine, University of Wisconsin - Madison, Madison, WI, United States
Synopsis
Proton density fat fraction (PDFF) is not recognized as a discriminator between nonalcoholic fatty liver (NAFL) and nonalcoholic steatohepatitis (NASH). However, considering the two-hit theory on the pathogenesis of NASH, we hypothesize that in high-risk individuals without known liver disease, MRI-PDFF may predict the presence of NASH. There is a paucity of data to support this hypothesis. Therefore, we examined the predictive value of MRI-PDFF in 29 obese adults without suspected liver disease. We observed excellent diagnostic performance of MRI-PDFF for detecting NASH (AUC=1). If confirmed during this ongoing study, this would constitute a paradigm change in diagnosis of NASH.
Introduction
Nonalcoholic fatty liver disease (NAFLD), a common cause of chronic liver disease, affects approximately 25-30% of the global population1-5. Obese individuals account for a significant proportion of NAFLD-cases1,6. In 10-20%, non-alcoholic fatty liver (NAFL) progresses into nonalcoholic steatohepatitis (NASH)7, as part of the larger spectrum of NAFLD.A widely recognized two-hit theory of the pathogenesis of NASH postulates that hepatic steatosis is the first “hit”, with a lack of anti-lipotoxic protective mechanisms as the second hit7-9. Given that the presence of fat is a necessary condition to develop NASH from isolated steatosis, or NAFL, we hypothesize that the severity of steatosis likely plays a critical role in the pathogenesis of NASH. Currently, liver biopsy remains the gold standard for diagnosing NASH but is limited by cost, complications, variability, and sampling errors10-17. As a result, there is an urgent need for an accurate noninvasive diagnostic modality10.
The quantitative MRI biomarker proton density fat fraction (MRI-PDFF) is recognized as an accurate and reproducible marker for tracking longitudinal changes in liver fat in early-stage NASH clinical trials18-20. To date, the severity of steatosis has not been shown to identify those patients with an established diagnosis of NASH18,21,22. However, all studies establishing the unsuitability18,21,22 or inferiority23 of MRI-PDFF for identifying NASH patients have been conducted in cohorts of individuals with known NASH. Therefore, the purpose of this work was to assess the value of MRI-PDFF, along with imaging biomarkers such as R2* and T1 relaxation times for the detection of NASH in a cohort of obese subjects without previously known liver disease.
Methods
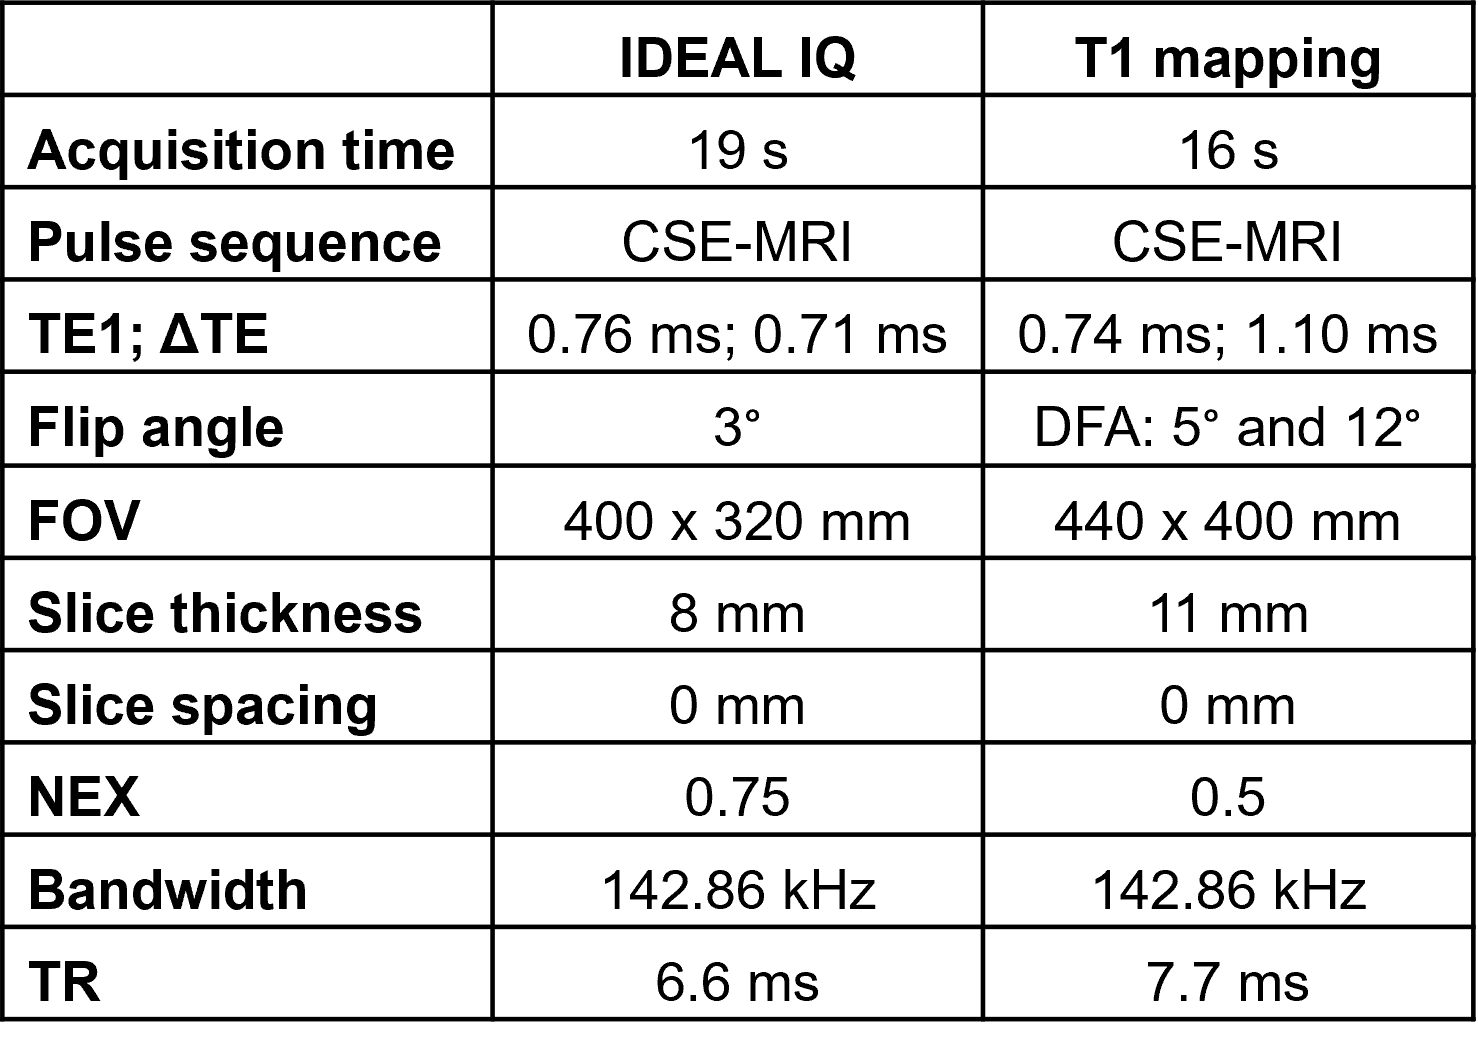
This analysis is part of an ongoing multicenter study in obese patients at risk for NAFLD who are undergoing weight loss surgery (WLS). IRB-approval and informed consent were obtained. We included study participants who underwent imaging within one week prior to WLS and underwent intraoperative wedge biopsy of the liver with completed histologic analysis.Imaging involved chemical-shift encoded MRI (CSE-MRI) to quantify PDFF and R2* (both, IDEAL IQ, GE, IL, USA) as well as a B1-corrected dual flip angle T1 mapping method24 at 3.0T (GE Signa Premier, IL, USA), Table 1.
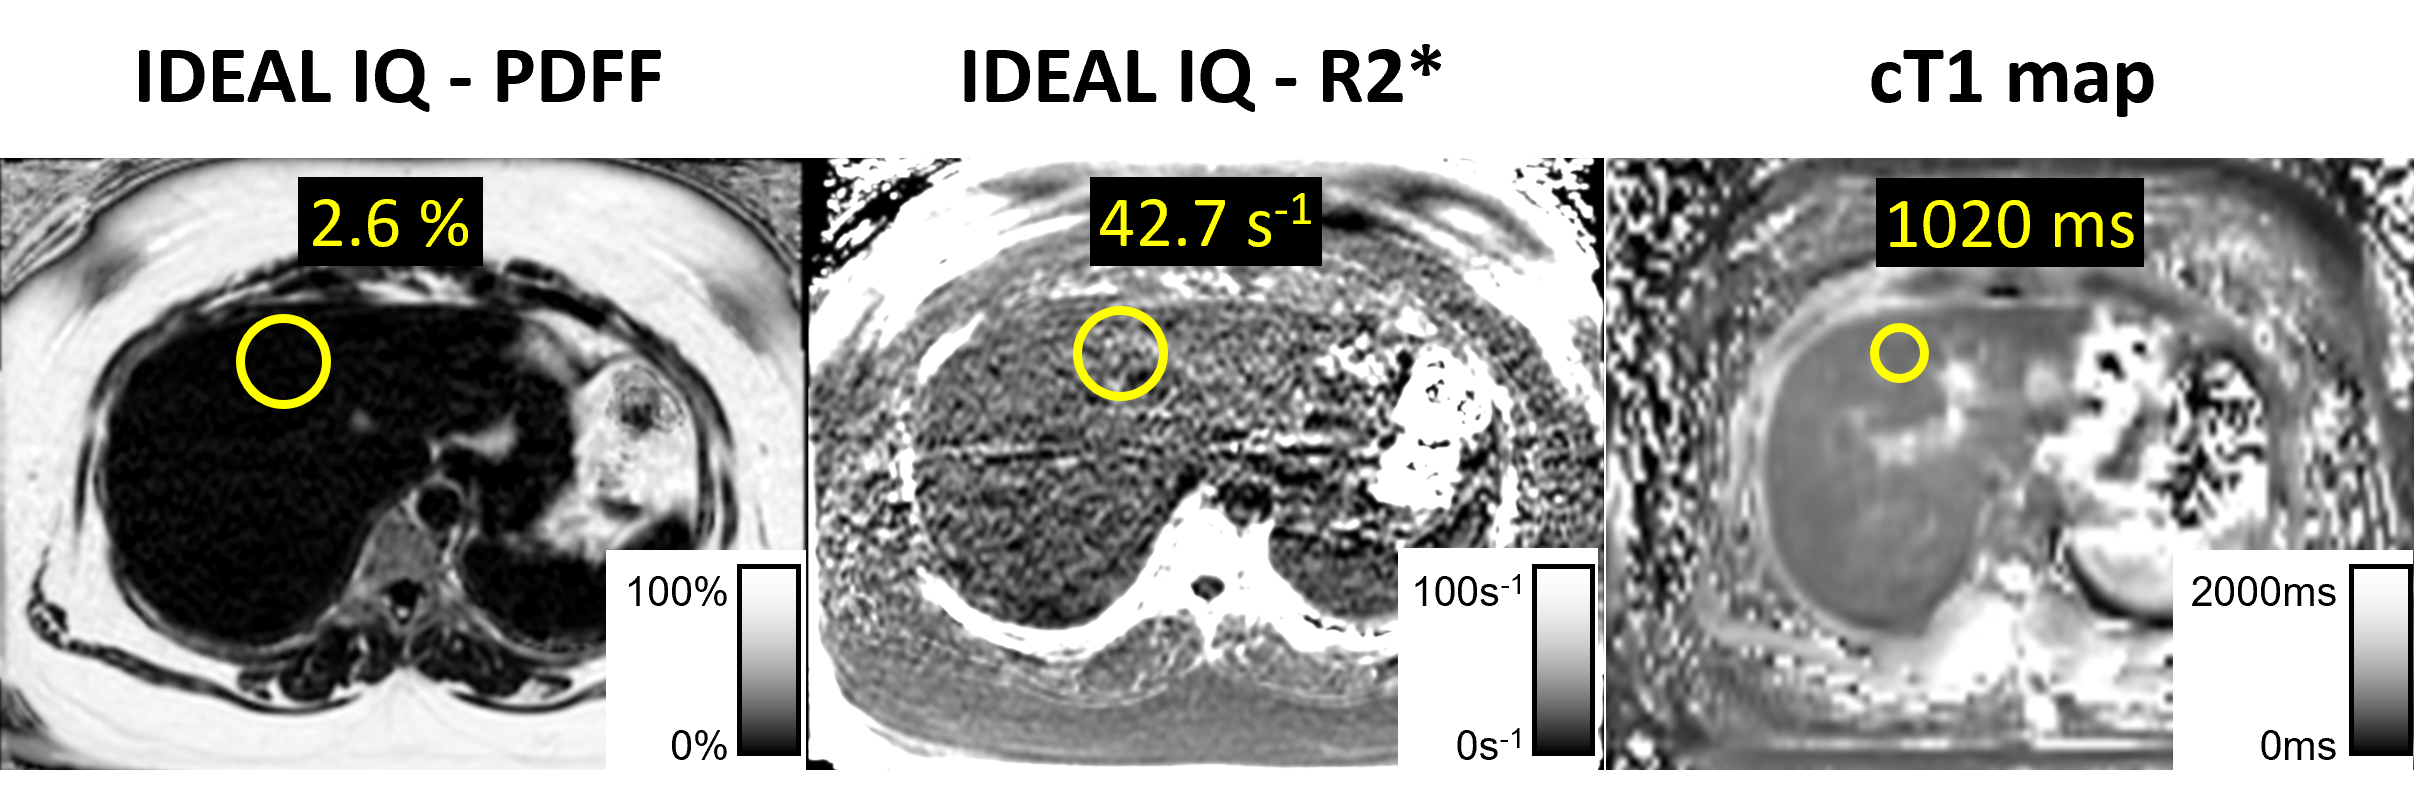
MRI data were analyzed using open-source software (Horos®, version 3.3.5). We placed largest possible ROIs in all nine Couinaud segments25 to measure MRI-PDFF, R2*, and T1 times, respectively (Figure 1). Liver biopsy samples were classified as "normal", “NAFL” or "NASH”, using the NASH CRN scoring system26.
We statistically examined MRI-PDFF, R2*, and T1 as classifiers for NASH, and non-NASH (i.e., normal or NAFL), respectively. For each biomarker, we generated a receiver-operating characteristic (ROC)-curve to determine the best threshold for discriminating NASH and non-NASH. Performance parameters were calculated.
Results
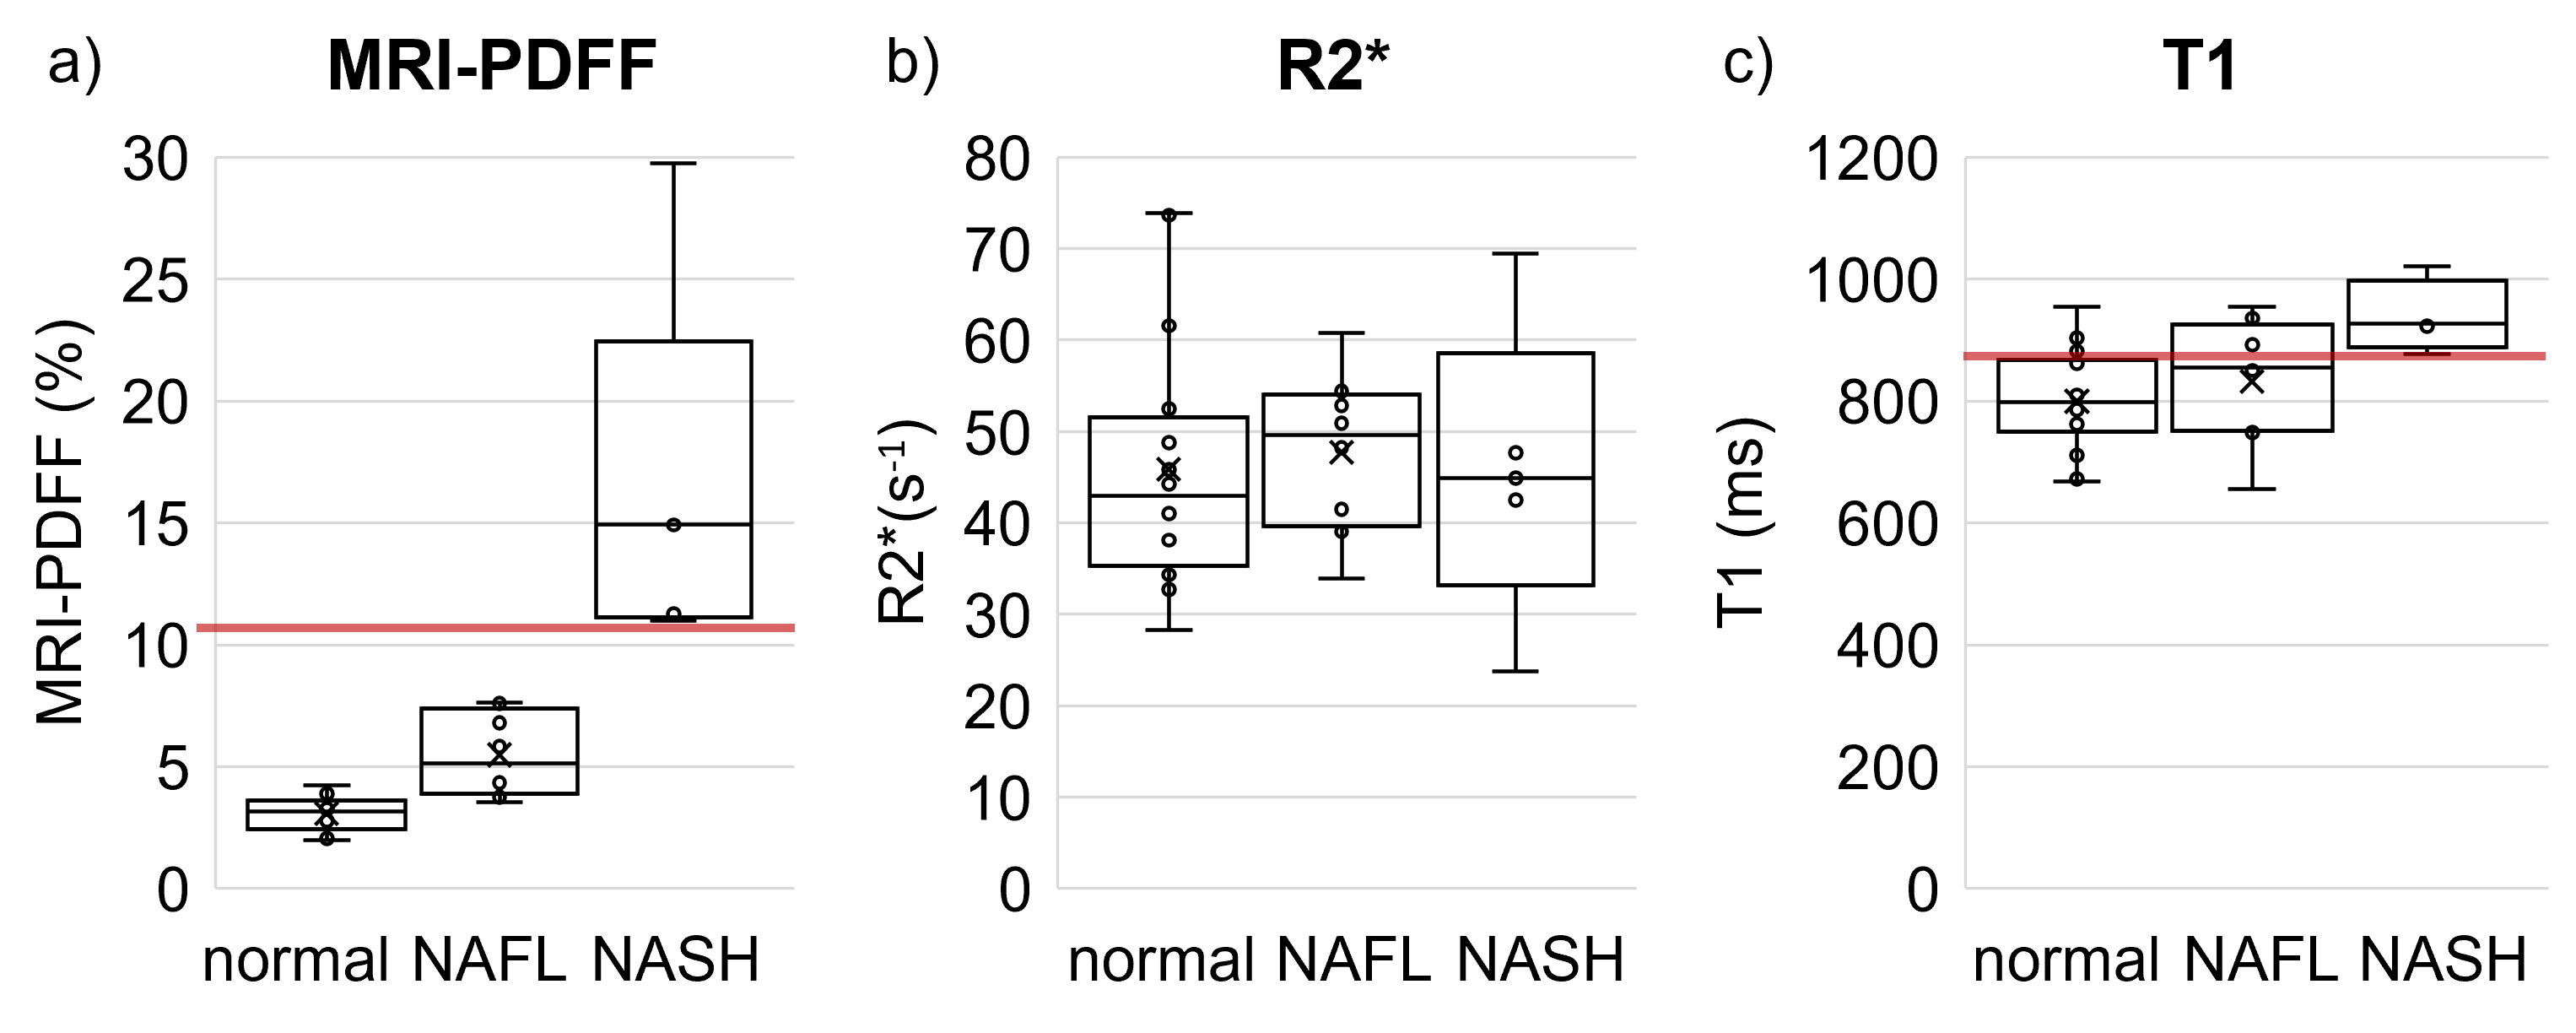
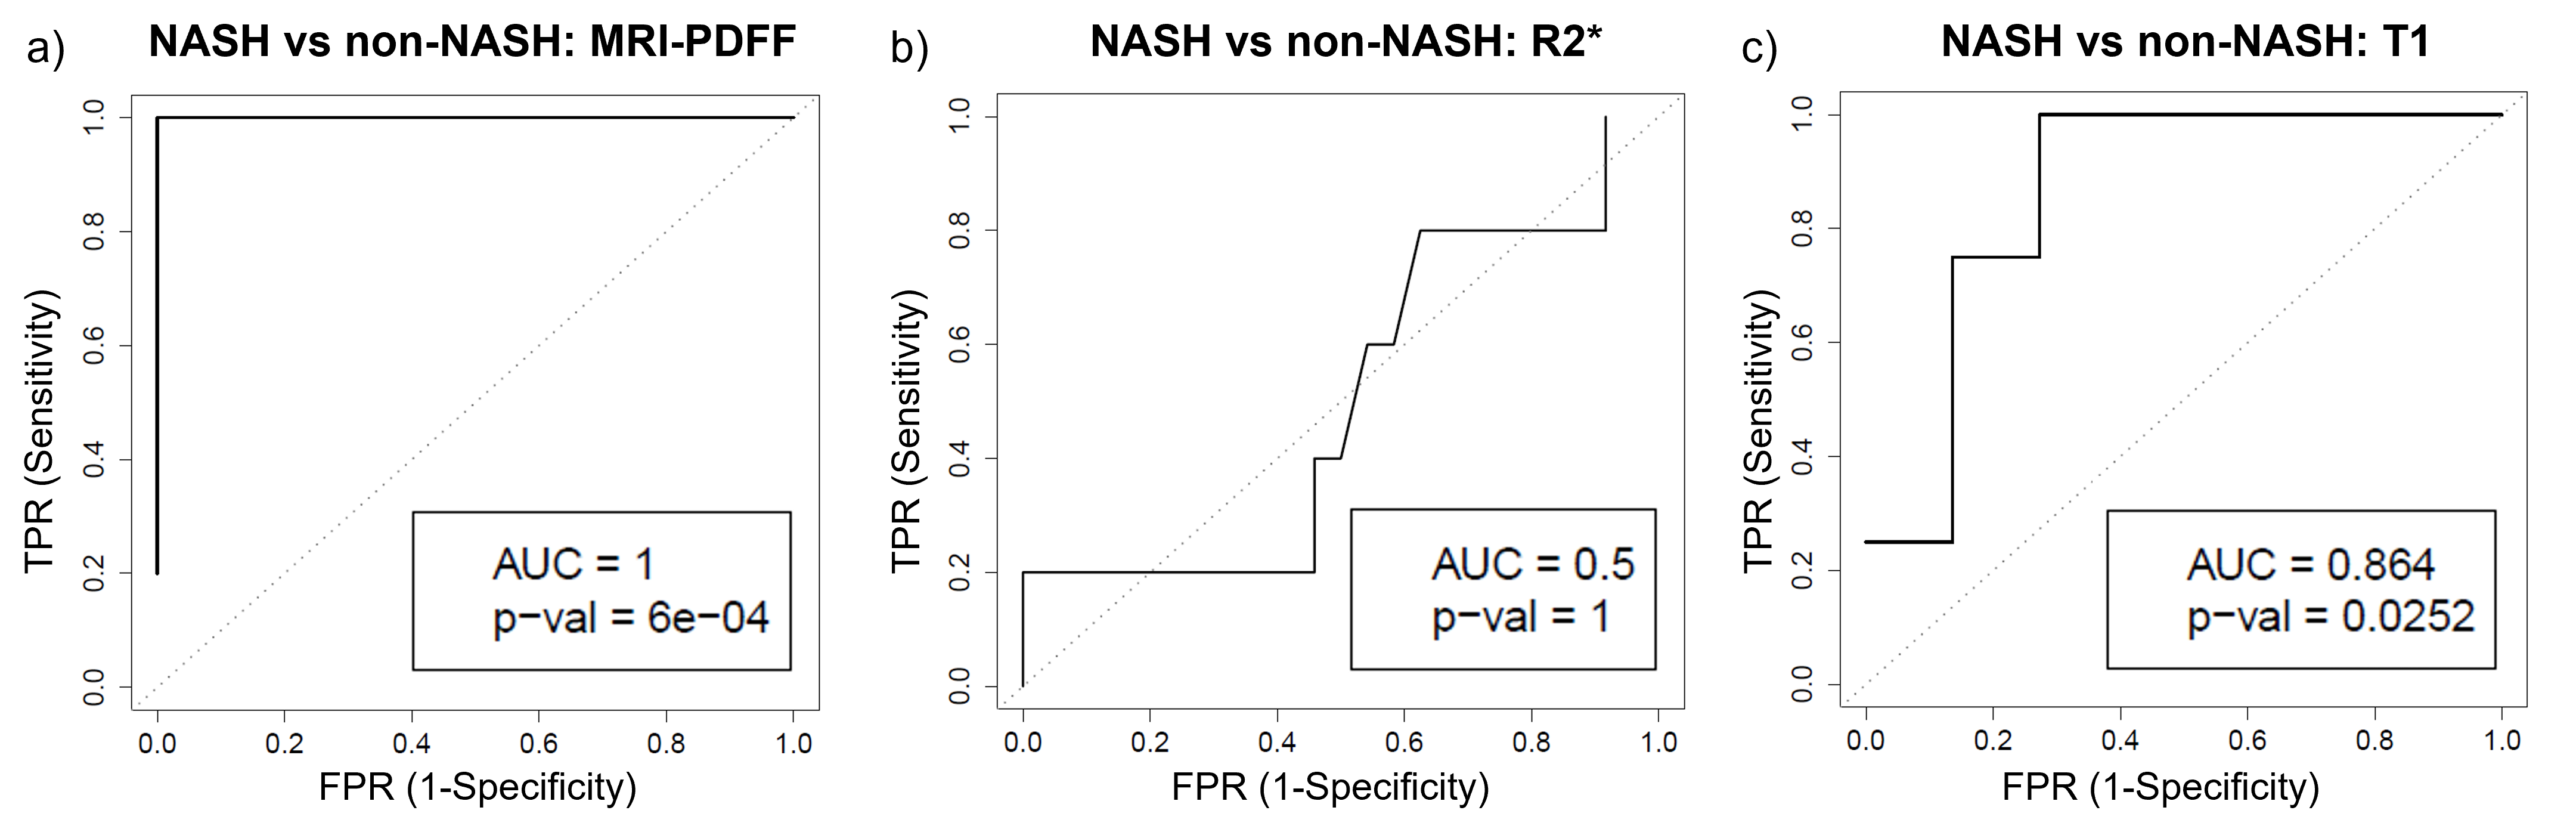
29 consecutive patients (26 female), were included in this analysis (mean age 46.3 years, range: 29-65 years; mean weight 124.5 kg, range: 90.2-168.7 kg; mean BMI: 44.7, range: 36.3-56.7). N=16 had no liver disease, N=8 had NAFL and N=5 had NASH.Compared to non-NASH, the NASH group presented with significantly higher MRI-PDFF (p=0.011) and T1 values (p=0.007, Figure 2). MRI-PDFF achieved perfect separation between NASH and non-NASH (area under the curve (AUC)=1; p<0.001; Figure 3a). The MRI-PDFF threshold which perfectly separated NASH from non-NASH was 11%. PDFF≥11% diagnosed NASH with a sensitivity and specificity of each 100% (95%CI: 48-100%; 95%CI: 86-100%, respectively). R2* did not discriminate between NASH and non-NASH (AUC=0.5; p=1; Figure 3b). The ROC curve for T1 featured an AUC of 0.86 (p<0.05; Figure 3c). T1≥877ms identified NASH with a sensitivity of 100% (95%CI: 40-100%) and specificity of 73% (95%CI:50-89%).
Discussion
In this hypothesis-generating work, we observed excellent diagnostic performance of MRI-PDFF for the detection of NASH in a cohort of obese patients without previously known liver disease. PDFF≥11% separated subjects with NASH from those without NASH perfectly.These data are in stark contrast to the current state of knowledge regarding the value of biomarkers of hepatic steatosis to predict the presence of NASH18,21,22. Although MRI-PDFF is recognized as a noninvasive, quantitative, accurate, and reproducible imaging biomarker for assessing treatment response in early-phase NASH clinical trials18,19 it is generally not considered able to identify patients with NASH18,21.
Possible causes for this apparent disagreement may be related to the fact that previous studies examined older cohorts of patients with a longer history of liver disease and/or an established diagnosis of NASH. In contrast, we recruited younger, asymptomatic patients at risk for NASH, but without known liver disease. Considering the two-hit theory of the pathogenesis of NASH, the severity of liver fat deposition may be relevant early in the disease process. In older patients with long-standing disease, the severity of liver fat may be less predictive of the presence of NASH.
The major limitation of this work is the limited number of subjects which prevents statistical significance of our results to date. However, we aim to enroll 100 subjects in this ongoing multi-center study which will increase the statistical power of this study.
Conclusion
Preliminary results showed excellent diagnostic performance of MRI-PDFF for detecting NASH in a cohort of obese patients without suspected liver disease. If confirmed, these results would constitute a paradigm change in early detection of NASH.Acknowledgements
This work was supported by the NIH (R01 DK088925). The authors also acknowledge GE Healthcare who provides research support to the University of Wisconsin-Madison, as well as clinical research support from Pfizer Inc.. Dr. Oechtering receives funding from the German Research Foundation (OE 746/1-1). Finally, Dr. Reeder is a Romnes Faculty Fellow, and has received an award provided by the University of Wisconsin-Madison Office of the Vice Chancellor for Research and Graduate Education with funding from the Wisconsin Alumni Research Foundation.References
1. Younossi ZM, Koenig AB, Abdelatif D, Fazel Y, Henry L, Wymer M. Global epidemiology of nonalcoholic fatty liver disease-Meta-analytic assessment of prevalence, incidence, and outcomes. Hepatology (Baltimore, Md) 2016;64:73-84.
2. Ahmed A, Wong RJ, Harrison SA. Nonalcoholic Fatty Liver Disease Review: Diagnosis, Treatment, and Outcomes. Clin Gastroenterol Hepatol 2015;13:2062-70.
3. Byrne CD, Targher G. NAFLD: a multisystem disease. J Hepatol 2015;62:S47-64.
4. Torres DM, Williams CD, Harrison SA. Features, diagnosis, and treatment of nonalcoholic fatty liver disease. Clin Gastroenterol Hepatol 2012;10:837-58.
5. Rinella ME. Nonalcoholic fatty liver disease: a systematic review. JAMA 2015;313:2263-73.
6. Young S, Tariq R, Provenza J, et al. Prevalence and Profile of Nonalcoholic Fatty Liver Disease in Lean Adults: Systematic Review and Meta-Analysis. Hepatology communications 2020;4:953-72.
7. Tilg H, Moschen AR. Evolution of inflammation in nonalcoholic fatty liver disease: the multiple parallel hits hypothesis. Hepatology (Baltimore, Md) 2010;52:1836-46.
8. Day CP, James OF. Steatohepatitis: a tale of two "hits"? Gastroenterology 1998;114:842-5.
9. Angulo P. Nonalcoholic fatty liver disease. The New England journal of medicine 2002;346:1221-31.
10. Younossi ZM, Loomba R, Anstee QM, et al. Diagnostic modalities for nonalcoholic fatty liver disease, nonalcoholic steatohepatitis, and associated fibrosis. Hepatology (Baltimore, Md) 2018;68:349-60.
11. Younossi ZM, Gramlich T, Liu YC, et al. Nonalcoholic fatty liver disease: assessment of variability in pathologic interpretations. Mod Pathol 1998;11:560-5.
12. Tapper EB, Lok AS. Use of Liver Imaging and Biopsy in Clinical Practice. The New England journal of medicine 2017;377:756-68.
13. Poynard T, Lenaour G, Vaillant JC, et al. Liver biopsy analysis has a low level of performance for diagnosis of intermediate stages of fibrosis. Clinical gastroenterology and hepatology : the official clinical practice journal of the American Gastroenterological Association 2012;10:657-63.e7.
14. Özcan HN, Oğuz B, Haliloğlu M, Orhan D, Karçaaltıncaba M. Imaging patterns of fatty liver in pediatric patients. Diagn Interv Radiol 2015;21:355-60.
15. Jayakumar S, Middleton MS, Lawitz EJ, et al. Longitudinal correlations between MRE, MRI-PDFF, and liver histology in patients with non-alcoholic steatohepatitis: Analysis of data from a phase II trial of selonsertib. Journal of hepatology 2019;70:133-41.
16. Chalasani N, Younossi Z, Lavine JE, et al. The diagnosis and management of nonalcoholic fatty liver disease: Practice guidance from the American Association for the Study of Liver Diseases. Hepatology (Baltimore, Md) 2018;67:328-57.
17. Pai RK, Kleiner DE, Hart J, et al. Standardising the interpretation of liver biopsies in non-alcoholic fatty liver disease clinical trials. Alimentary pharmacology & therapeutics 2019;50:1100-11.
18. Caussy C, Reeder SB, Sirlin CB, Loomba R. Noninvasive, Quantitative Assessment of Liver Fat by MRI-PDFF as an Endpoint in NASH Trials. Hepatology (Baltimore, Md) 2018;68:763-72.
19. Stine JG, Munaganuru N, Barnard A, et al. Change in MRI-PDFF and Histologic Response in Patients With Nonalcoholic Steatohepatitis: A Systematic Review and Meta-Analysis. Clinical gastroenterology and hepatology : the official clinical practice journal of the American Gastroenterological Association 2021;19:2274-83.e5.
20. Kogachi S, Noureddin M. Noninvasive Evaluation for Nonalcoholic Fatty Liver Disease and Nonalcoholic Steatohepatitis. Clinical therapeutics 2021;43:455-72.
21. Piazzolla VA, Mangia A. Noninvasive Diagnosis of NAFLD and NASH. Cells 2020;9.
22. Ajmera V, Loomba R. Imaging biomarkers of NAFLD, NASH, and fibrosis. Molecular metabolism 2021;50:101167.
23. Andersson A, Kelly M, Imajo K, et al. Clinical utility of MRI biomarkers for identifying NASH patients' high risk of progression: A multi-center pooled data and meta-analysis. Clinical gastroenterology and hepatology : the official clinical practice journal of the American Gastroenterological Association 2021.
24. Wang X, Colgan TJ, Hinshaw LA, et al. T(1) -corrected quantitative chemical shift-encoded MRI. Magn Reson Med 2020;83:2051-63.
25. Campo CA, Hernando D, Schubert T, Bookwalter CA, Pay AJV, Reeder SB. Standardized Approach for ROI-Based Measurements of Proton Density Fat Fraction and R2* in the Liver. AJR Am J Roentgenol 2017;209:592-603.
26. Kleiner DE, Brunt EM, Van Natta M, et al. Design and validation of a histological scoring system for nonalcoholic fatty liver disease. Hepatology (Baltimore, Md) 2005;41:1313-21.
Figures