2393
Early microstructural aberrations in a mouse model of Alzheimer’s disease detected by Soma and Neurite Density Imaging1Champalimaud Research, Champalimaud Centre for the Unknown, Lisbon, Portugal, 2Centre for Medical Image Computing (CMIC), Dept of Computer Science, University College London, London, United Kingdom, 3Cardiff University Brain Research Imaging Centre (CUBRIC), School of Psychology, Cardiff University, Cardiff, United Kingdom, 4School of Computer Science and Informatics, Cardiff University, Cardiff, United Kingdom
Synopsis
Alzheimer’s disease induces early morphological tissue changes which precede the onset of symptoms and can be important targets for neuroimaging. In this work we employ Soma and Neurite Density Imaging (SANDI), a biophysical modelling approach for diffusion MRI, to investigate tissue microstructure alterations in the 3xTg AD mouse model and compare it with the state-of-the-art Diffusion Kurtosis Imaging (DKI).
Introduction
The complex pathology of Alzheimer’s Disease (AD) involves not only the hallmark accumulation of extracellular amyloid plaques1 and intracellular tau tangles1, but also early changes in tissue microstructure including synaptic density, neuronal loss, neuro-inflammation and white matter disruptions2,3, which can be important targets for neuroimaging.Diffusion MRI (dMRI) is sensitive to microscopic scale tissue features, and many AD clinical and pre-clinical studies harnessed dMRI with b-values in the range of 1-3 ms/μm2, for instance to characterise diffusion or kurtosis tensors4,5; however, these metrics are by design unspecific. Soma and Neurite Density Imaging (SANDI)6, which employs diffusion measurements up to very high diffusion weightings6-11 and a 3-compartment tissue model6, was recently shown to improve specificity, and, in the mouse brain, the derived metrics of apparent soma and neurite density showed a strong correlation to the Allen Brain Atlas12 and histology13.
In this work we apply SANDI to investigate tissue microstructure in the 3xTg AD mouse model and compare it with the state-of-the-art Diffusion Kurtosis Imaging (DKI).
Methods
All experiments were preapproved by the competent institutional and national authorities and were carried out in accordance with European Directive 2010/63.Animals: Male 3xTg AD mice (B6;129-Tg(APPSwe,tauP301L)1Lfa) and normal controls (NC) (B6129SF2/J) were imaged at 3 months (NNC,3m=14, NTG,3m=16) and subsequently at 6 months (NNC,6m=12, NTG,6m=11). dMRI data was acquired on a 9.4T Bruker Biospec scanner equipped with a 86 mm volume transmit coil and a 4-element array reception cryocoil. Mice were induced with 5% isofluorane and maintained at 2%, while monitoring breathing rate and temperature.
Acquisitions: SANDI datasets were acquired using PGSE-EPI with TE=36.8ms, TR=4s, 4 averages, slice thickness=0.4mm, 35 slices, in plane resolution=0.12x0.12mm, matrix=118x100, Partial Fourier =1.35. Diffusion parameters: 8 b-values (Δ/δ = 20/5.5ms): 1000,2500,4000,5500,7000,8500 and 10000 ms/mm2 with 34 directions each and 16 b=0 images.
Pre-processing: denoising14, ghost correction15, coil combination16, computation of real data17 and intra-scan rigid registration (Fig.1a).
SANDI analysis: A 3-compartment model6 (spheres, sticks and Gaussian diffusion, Fig.1b) was fit voxelwise to normalized and directionally averaged data using a Random Forest regression implemented in Matlab®, trained on simulated data6.
DKI analysis: Diffusion and kurtosis tensors were fit to normalized data with b<=2500 ms/mm2 using a linear least squares approach implemented in Matlab®.
ROI analysis: Gray matter (GM) and white matter (WM) ROIs (cortex, hippocampus, basal forebrain, corpus callosum, fimbria, fornix)5 have been manually delineated (Fig.3a). Mean parameter values were calculated for each ROI.
Statistical analysis: Group differences were assessed using two-sample t-tests; changes over time were assessed groupwise using paired t-tests. p-values were adjusted for multiple comparisons using false discovery rate.
Results
Data quality and contrast is similar for different groups, as shown by maps of powder averaged diffusion data, SANDI and DKI parameters (Fig.1c and Fig.2). Average b=0 SNR is ~35 in GM and ~15 in WM.Figure 3b presents signal decay curves of the directionally averaged signal for NC and AD mice in different ROIs, at 3 and 6 months. In the cortex, basal forebrain, and fornix we see an overlap of the curves, however in the hippocampus, corpus callosum and fimbria, we see differences especially at very high diffusion weightings.
Figure 4 shows SANDI parameter values (fsphere, fstick and Rsphere) in different ROIs, for NC and AD mice, at 3 and 6 months, respectively. At 3 months, we see lower fstick values for the AD mice in HIP, cc and fi, as well as lower fsphere values in HIP and higher in cc. At 6 months we see similar trends, although the differences are significant only in cc (fstick and fsphere) and HIP (Rsphere). We also observe significant changes between 3 and 6 months: in CTX, cc, fi and fx there is an increase in fstick for all groups, while a decrease in fsphere is observed for controls in CTX and cc, and for AD mice in BF, fi and fx.
Figure 5 shows the ROI analysis for three DKI parameters (mean diffusivity (MD), fractional anisotropy (FA) and mean kurtosis (MK)). In this case, AD mice had significantly lower FA in fi, and there was an increase in FA in cc and fi from 3 to 6 months in both groups.
Discussion
Our results show that SANDI is sensitive to differences in tissue microstructure between AD and NC mice and reveals differences in more ROIs compared to DKI.Although a previous DKI study showed differences in HIP at 2 months, a much larger number of animals (30-50) was employed. Nevertheless, in cc and fi, fstick and FA showed similar trends, even if fstick is derived from the powder averaged data and FA is based on directional anisotropy. These patterns are consistent with previously described morphological changes in these areas, for example of oligodendrocytes and myelin structure19.
Limitations: Besides the model limitations (e.g. no exchange between compartments for SANDI, lack of specificity for DKI, etc), in this study the MRI metrics were not (yet) correlated with histological information to validate the sources of contrast, which will be the objective of future work.
Conclusion
SANDI methodology provides sensitivity to early changes in tissue microstructure in a mouse model of AD, a step forward towards better neuroimaging tools for early diagnosis.Acknowledgements
AI and RC are supported by ”la Caixa” Foundation (ID 100010434) and European Union’s Horizon 2020 research and innovation programme under the Marie Skłodowska-Curie grant agreement No. 847648, fellowship code CF/BQ/PI20/11760029. MP is supported by UKRI Future Leaders Fellowship (MR/T020296/1). The authors acknowledge the vivarium of the Champalimaud Centre for the Unknown, a facility of CONGENTO which is a research infrastructure co-financed by Lisboa Regional Operational Programme (Lisboa 2020), under the PORTUGAL 2020 Partnership Agreement through the European Regional Development Fund (ERDF) and Fundação para a Ciência e Tecnologia (Portugal), project LISBOA-01-0145-FEDER-022170.References
1. Lam B et al. Clinical, imaging, and pathological heterogeneity of the Alzheimer's disease syndrome. Alzheimers Res Ther. 2013;5(1):1
2. Da Mesquita S et al. Insights on the pathophysiology of Alzheimer's disease: the crosstalk between amyloid pathology, neuroinflammation and the peripheral immune system. Neurosci Biobehav Rev. 2016;68:547-562.
3. Bartzokis G, et al. Heterogeneous age-related breakdown of white matter structural integrity: implications for cortical "disconnection" in aging and Alzheimer's disease. Neurobiol Aging. 2004;25(7):843-851.
4. Kamagata K, et al. Diffusion Magnetic Resonance Imaging-Based Biomarkers for Neurodegenerative Diseases. Int J Mol Sci. 2021; 22(10): 5216.
5. Falangola M, et al, Diffusion MRI detects early brain microstructure abnormalities in 2-month-old 3×Tg-AD mice. NMR Biomed 2020; 33(9): e4346
6. Palombo et al, SANDI: A compartment-based model for non-invasive apparent soma and neurite imaging by diffusion MRI, NeuroImage (2020) 215: 116835
7. Cohen and Assaf, High b-value q-space analyzed diffusion-weighted MRS and MRI in neuronal tissues – a technical review. NMR Biomed 2002; 15(7-8): 516-542
8. Jespersen et al, Neurite density from magnetic resonance diffusion measurements at ultrahigh field: comparison with light microscopy and electron microscopy, Neuroimage (2010) 49(1):205-16
9. Alexander et al, Imaging brain microstructure with diffusion MRI: practicality and applications, NMRBiomed (2018) 32(4): e3841
10. Novikov et al, Quantifying brain microstructure with diffusion MRI: Theory and parameter estimation, NMRBiomed (2018) 32(4): e3998
11. Veraart et al, Noninvasive quantification of axon radii using diffusion MRI, eLife (2020) 9:e49855
12. Ianus et al, Soma and Neurite Density MRI (SANDI) of the in-vivo mouse brain (2021), https://www.biorxiv.org/content/10.1101/2021.08.11.455923v1.full.pdf
13. Palombo et al, Histological validation of the brain cell body imaging with diffusion MRI at ultrahigh field, ISMRM 2019
14. Veraart, J., et al., Denoising of diffusion MRI using random matrix theory. Neuroimage, 2016. 142: p. 394-406.
15. Buonocore, M.H. and L. Gao, Ghost artifact reduction for echo planar imaging using image phase correction. Magn Reson Med, 1997. 38(1): p. 89-100.
16. Walsh, D.O., A.F. Gmitro, and M.W. Marcellin, Adaptive reconstruction of phased array MR imagery. Magn Reson Med, 2000. 43(5): p. 682-90.
17. Griswold, M., et al. The Use of an Adaptive Reconstruction for Array Coil Sensitivity Mapping and Intensity Normalization. in Annual Meeting of the ISMRM. 2002.
18. Motta, A., et al., Dense connectomic reconstruction in layer 4 of the somatosensory cortex. Science, 2019. 366(6469): p. eaay3134.
19. Desai MK, Mastrangelo MA, Ryan DA, Sudol KL, Narrow WC, Bowers WJ. Early oligodendrocyte/myelin pathology in Alzheimer's disease mice constitutes a novel therapeutic target. Am J Pathol. 2010;177(3):1422-1435
Figures
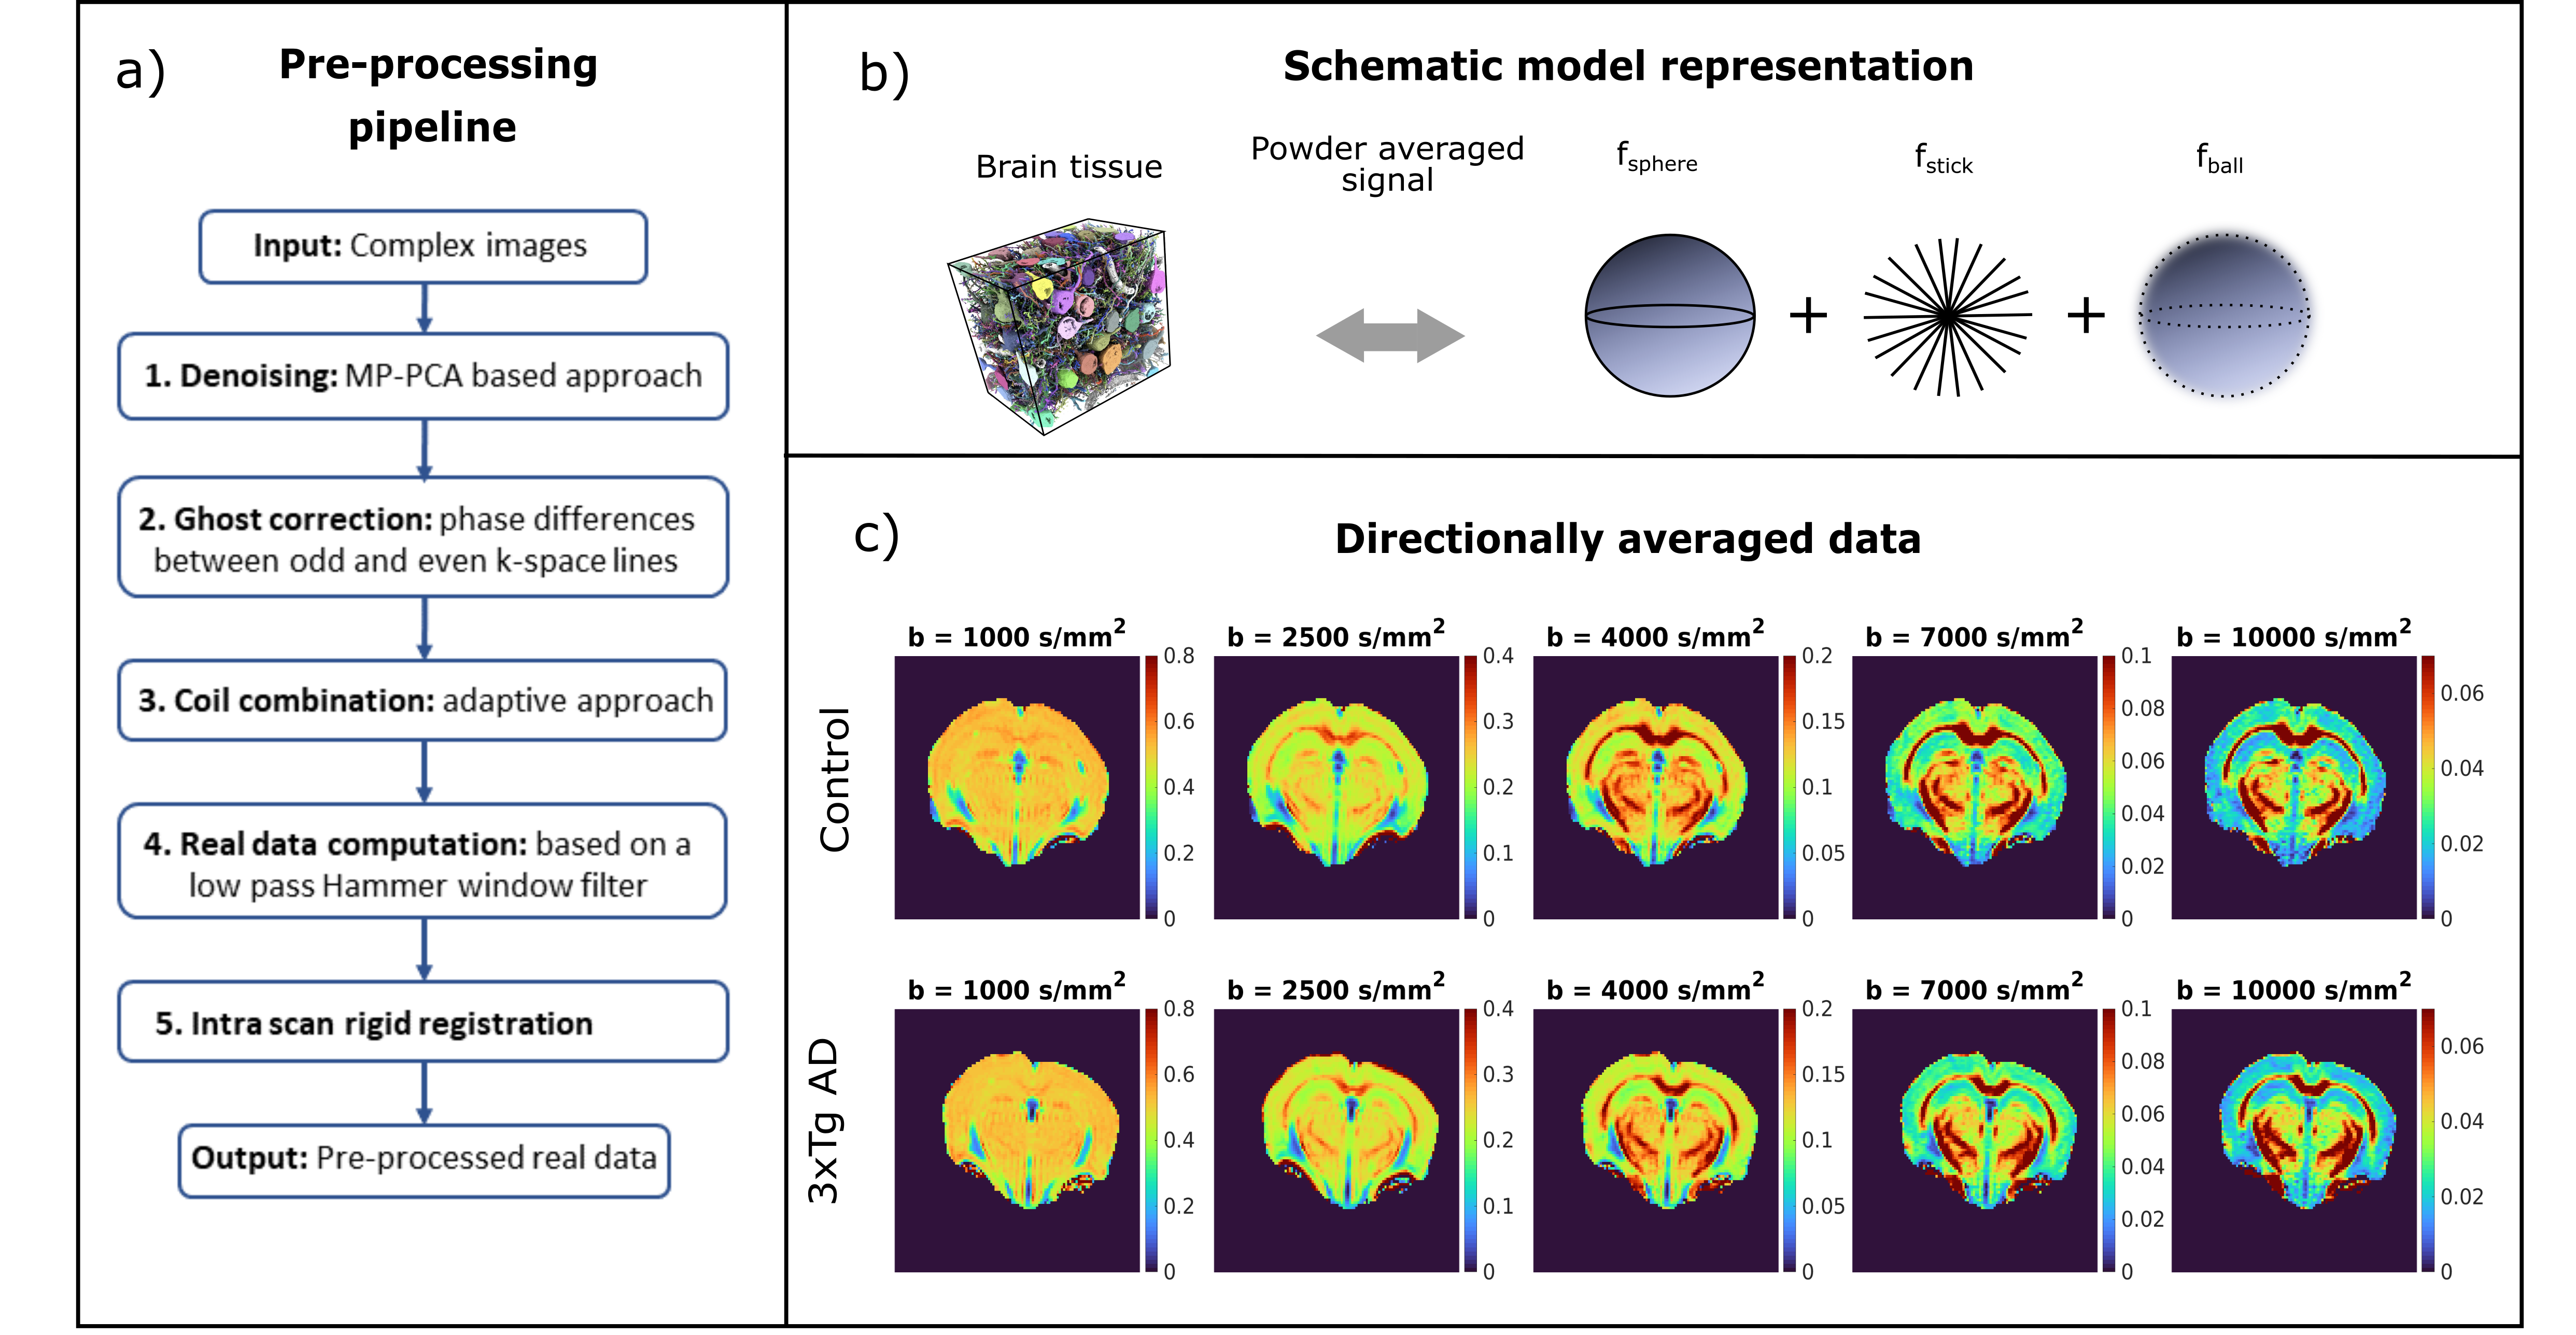
Figure 1 a) Schematic description of the pre-processing pipeline. b) Example of mouse brain microscopic tissue structure18 (left) and schematic representation of the SANDI model (right). The powder averaged diffusion signal is a combination of diffusion restricted in spheres, sticks and isotropic Gaussian diffusion with signal fractions fsphere + fstick + fball = 1. c) Maps of directionally averaged and normalized data for different diffusion weightings from b = 1000 s/mm2 (left) to 10000 s/mm2(right) for an example mouse from the NC (top) and 3xTg (bottom) groups at 6 months of age.
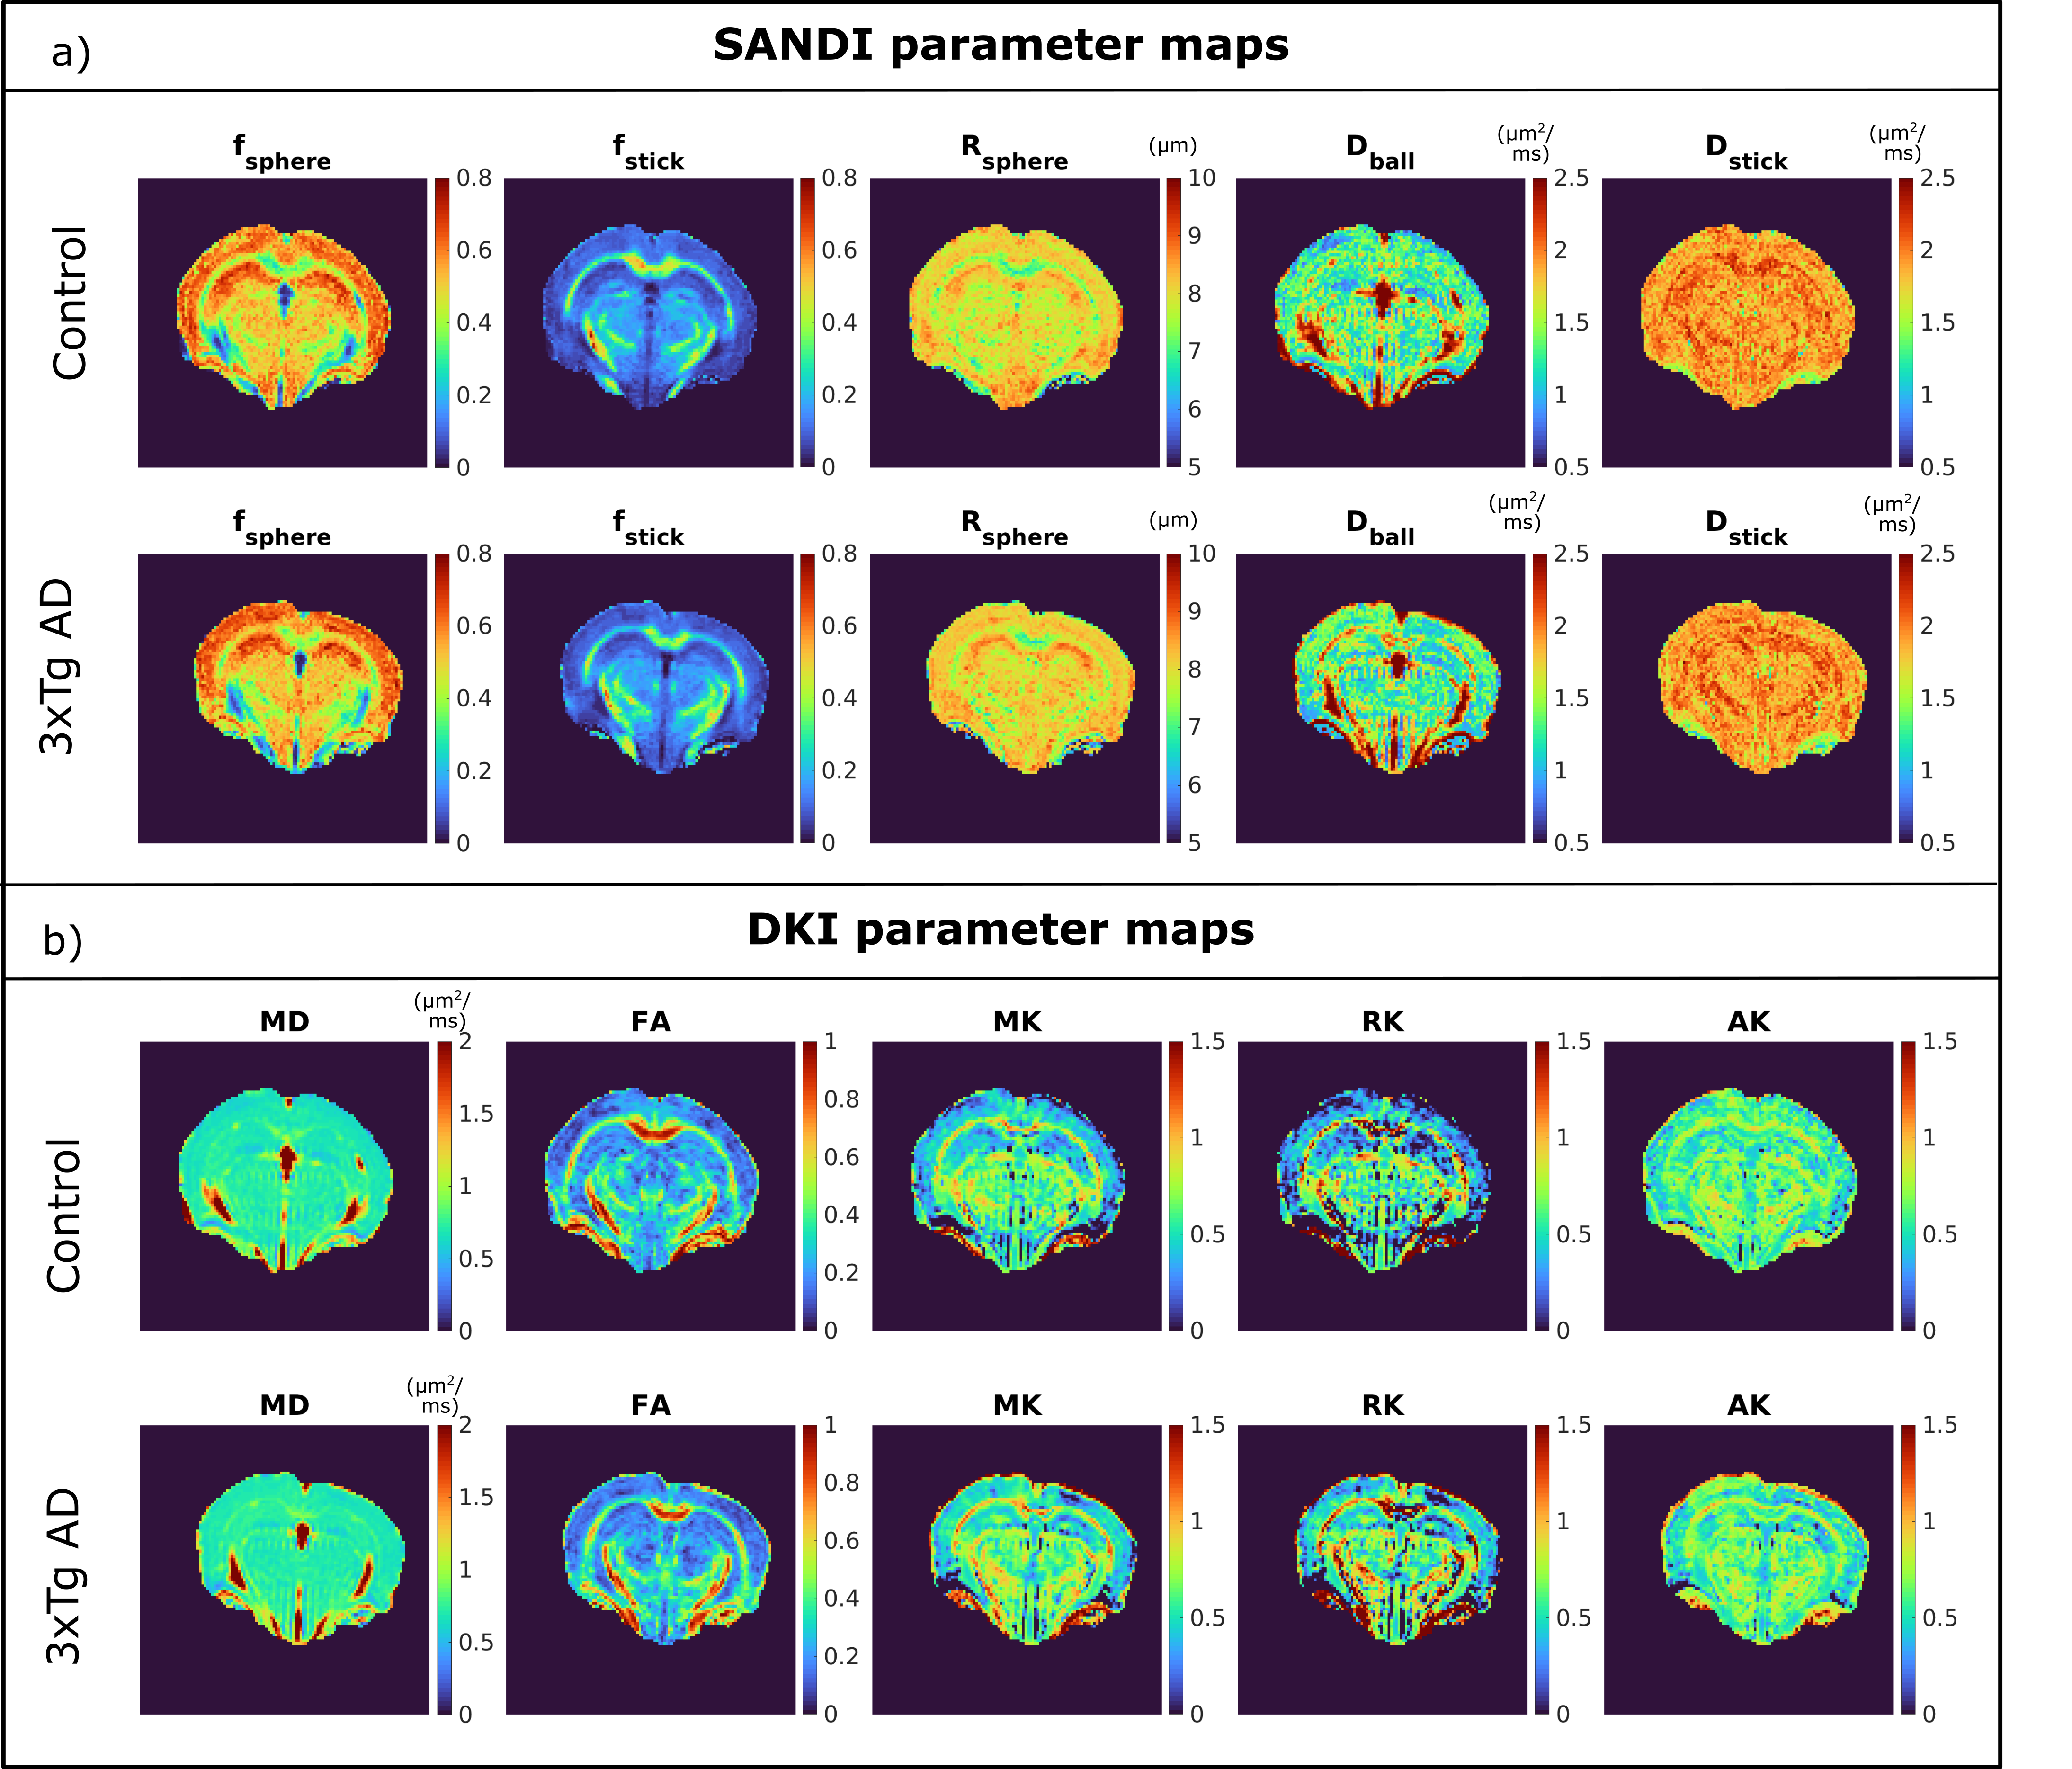
Figure 2 a) SANDI parameter maps for an example mouse from the NC (top) and 3xTg (bottom) groups at 6 months of age; b) DKI parameter maps for the same animals as in a).
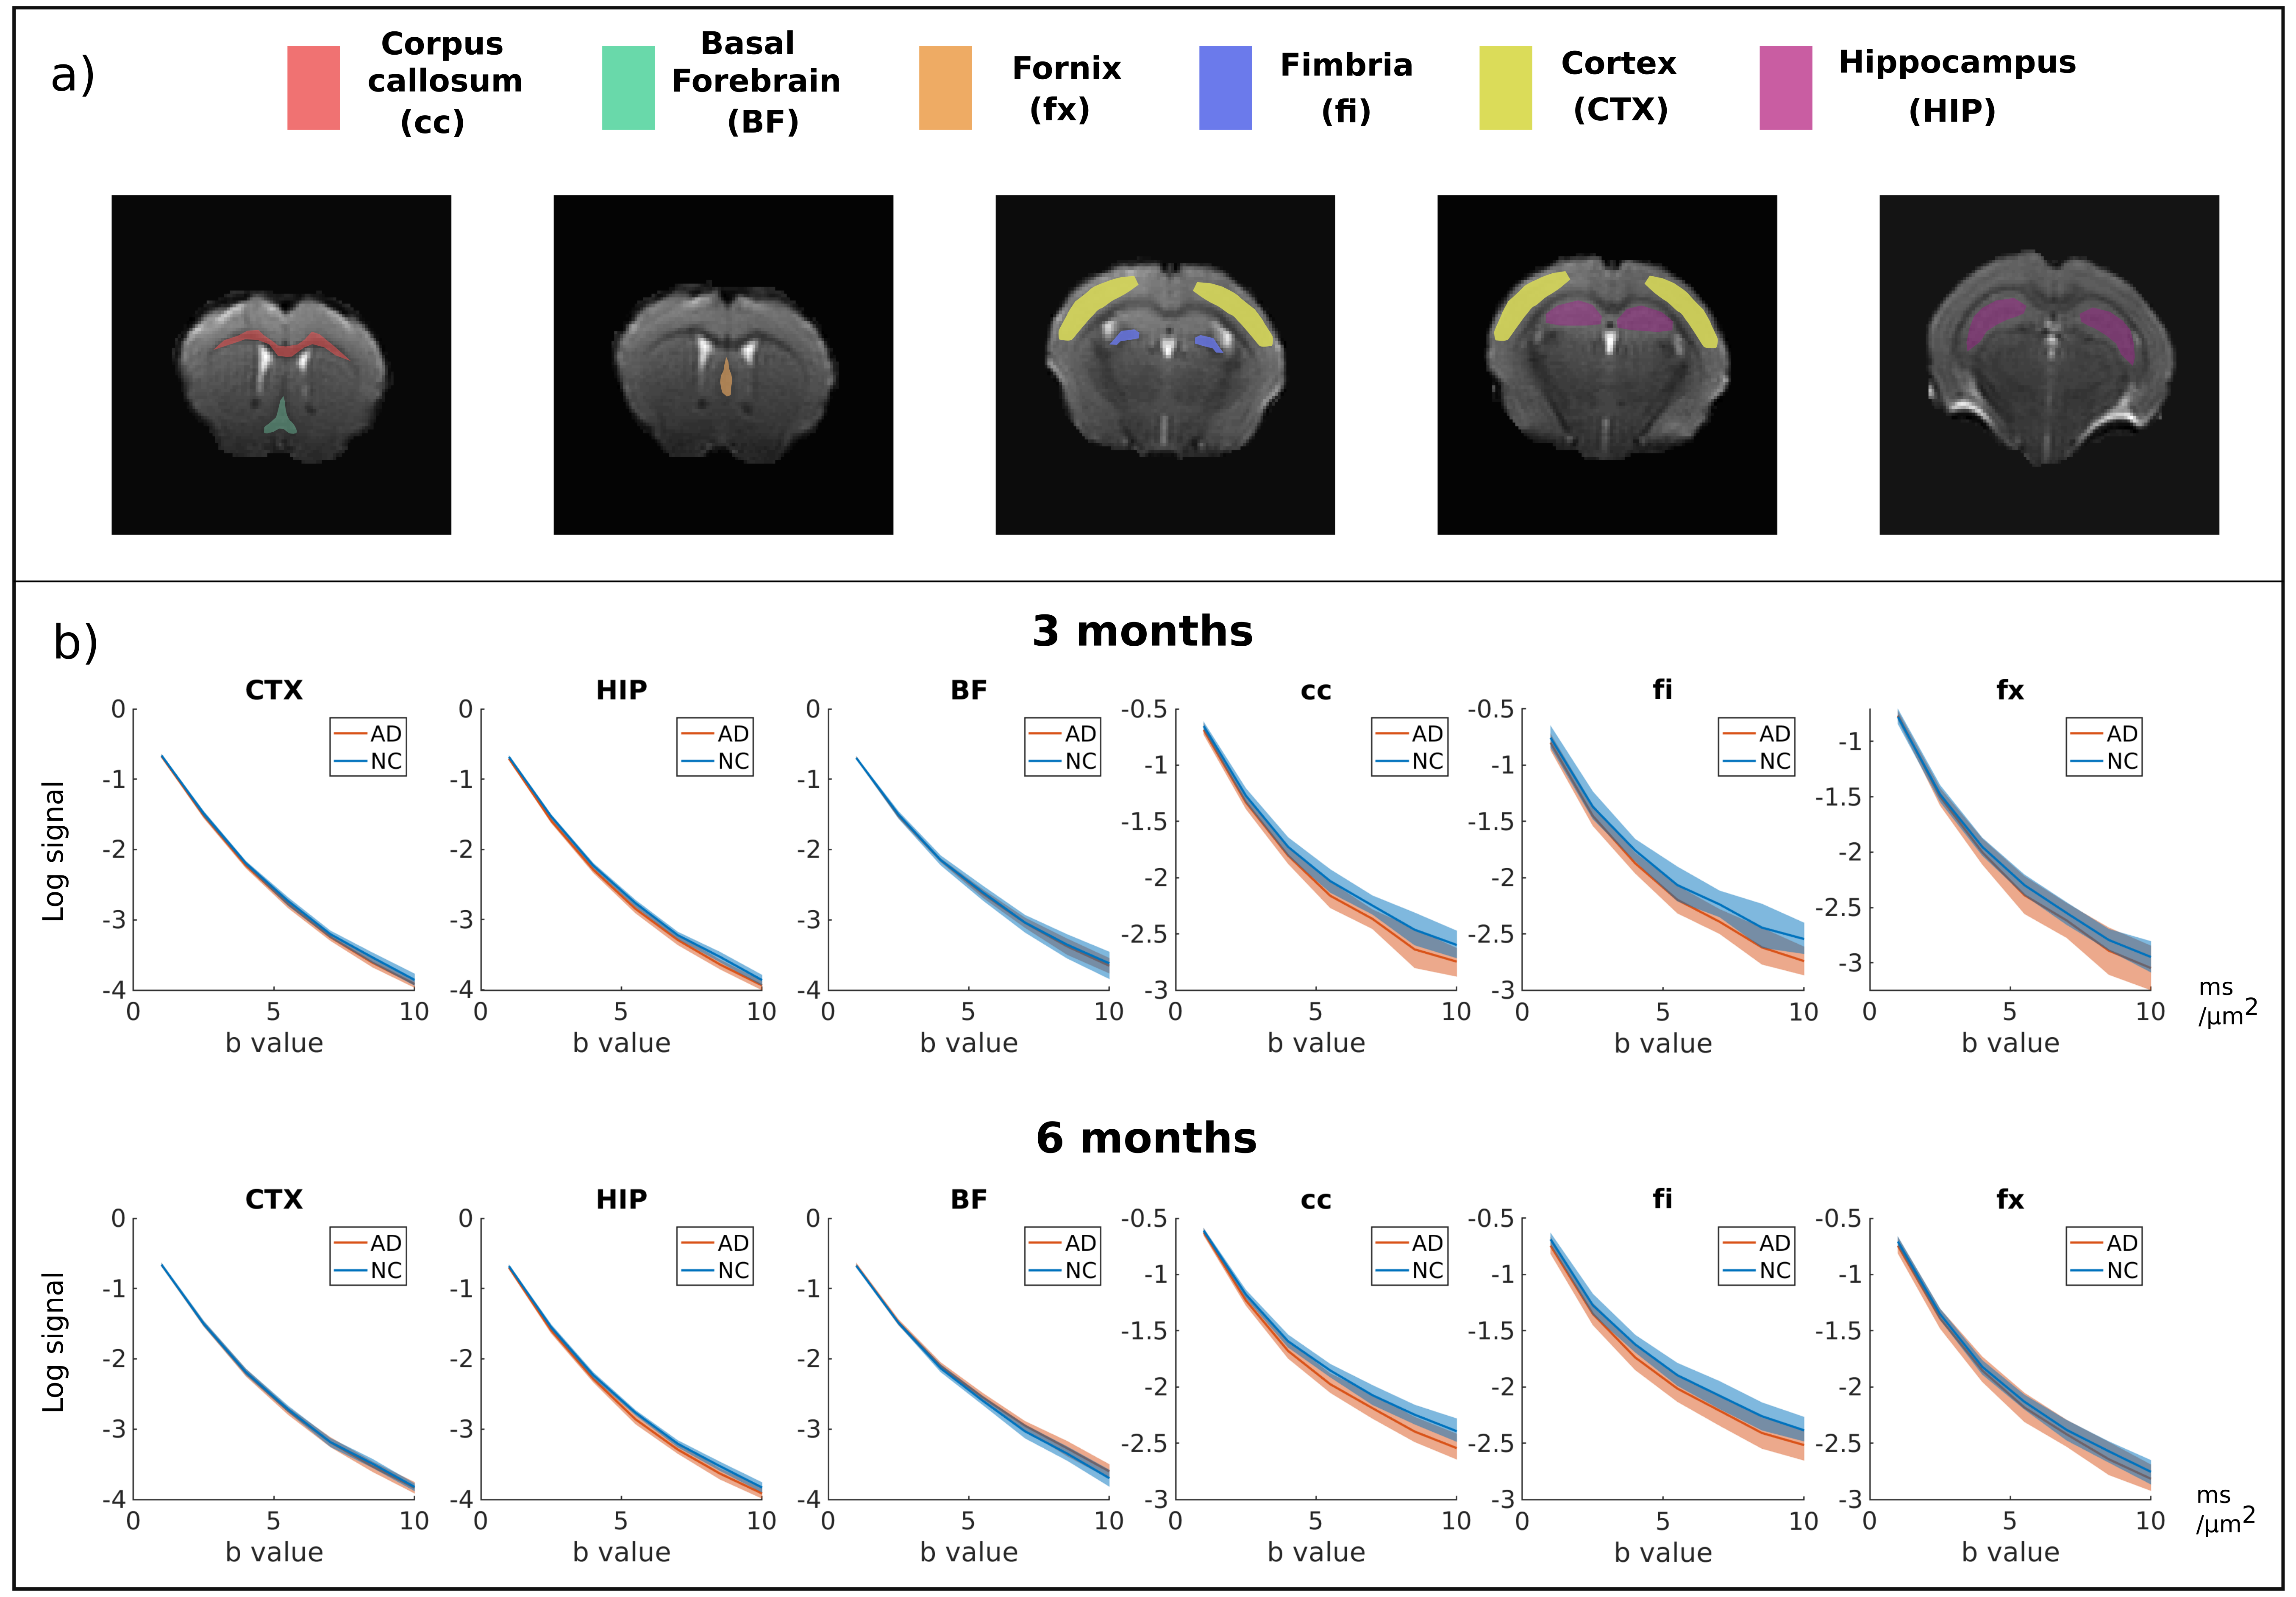
Figure 3 a) Maps showing the manual delineation of the ROIs; b) Plots of directionally averaged normalized signal as a function of b-value averaged over voxels in each ROI (GM: CTX – cortex, HIP – hippocampus, BF – basal forebrain, WM: cc – corpus callosum, fi – fimbria, fx - fornix) for control (blue) and 3xTg (orange) mice. The decay curves are shown on logarithmic scale. The shaded area represents the standard deviation over animals for each data point.
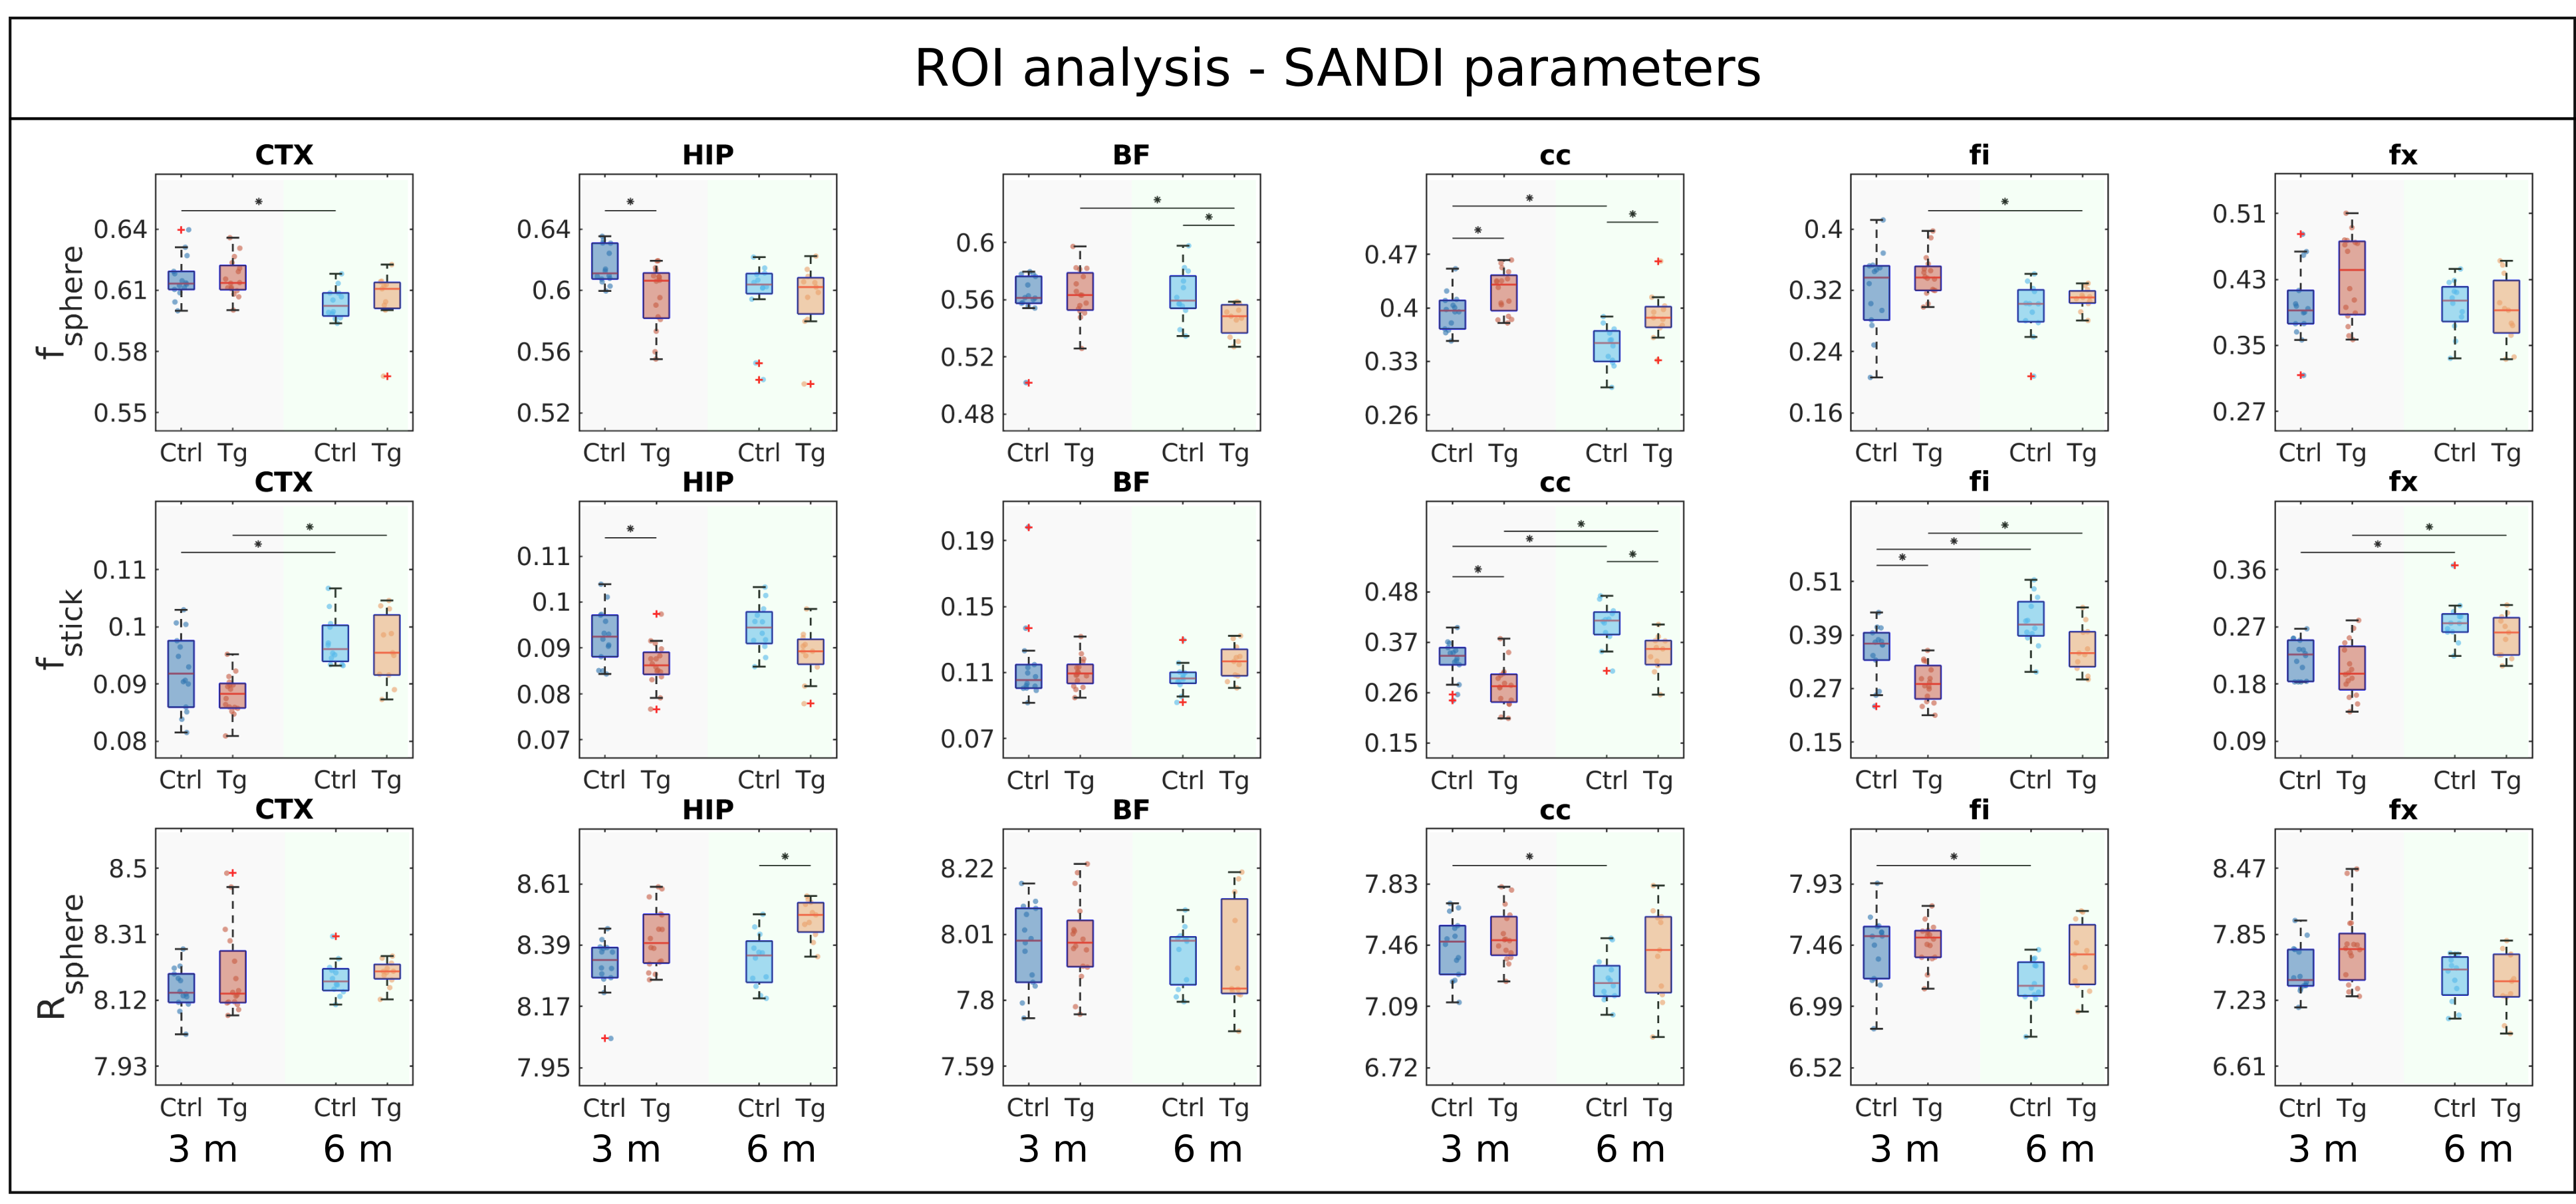
Figure 4 ROI analysis of SANDI parameters showing box-plots of fsphere (top), fstick (middle) and Rsphere (bottom) in different ROIs (left-right). Each plot shows parameters for NC (blue) and 3xTg (red) animals, for data acquired at 3 months (left group) and 6 months (right group). Significant differences are marked with * for p<0.05. Group differences were assessed with two-sample t-tests for each time point and paired t-tests for time changes. All p-values have been adjusted for multiple comparisons of diffusion metrics, ROIs, groups and time points using false discovery rate.
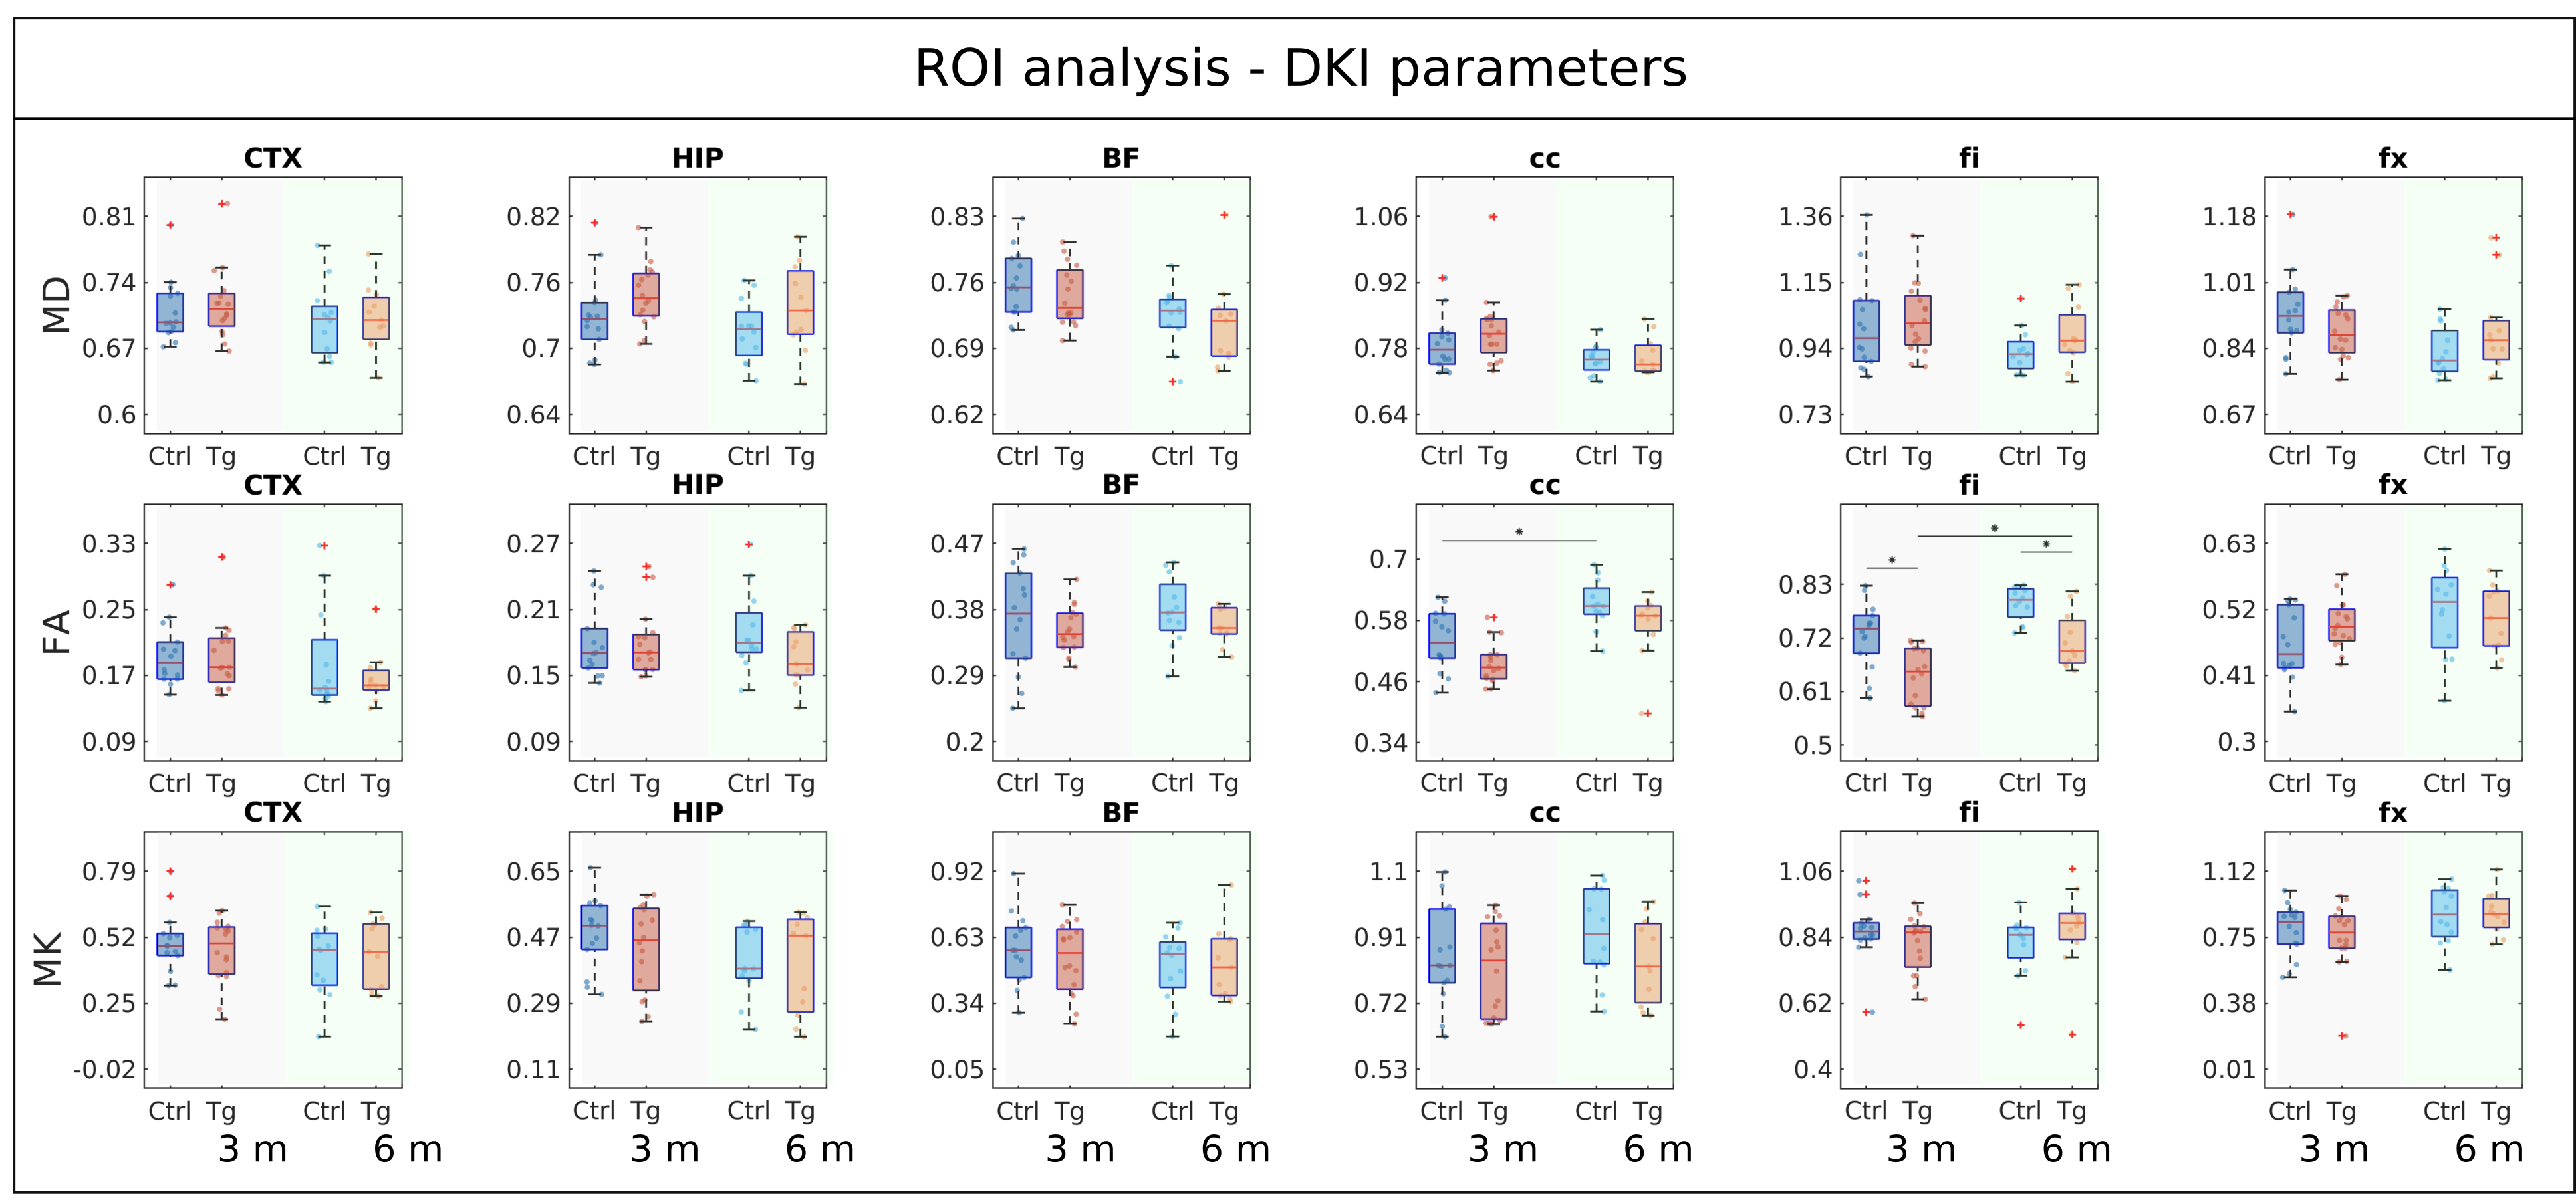
Figure 5 ROI analysis of DKI parameters showing box-plots of MD (top), FA (middle) and MK (bottom) in different ROIs (left-right). Each plot shows parameters for NC (blue) and 3xTg (red) animals, for data acquired at 3 months (left group) and 6 months (right group). Significant differences are marked with * for p < 0.05. Group differences were assessed with a two-sample t-test for each time point and with a paired t-test for changes over time. All p-values have been adjusted for multiple comparison of different diffusion metrics, ROIs, groups and time points using false discovery rate.