2390
DCE-MRI of blood brain barrier leakage in subjective memory and mild cognitive impairment: The Cognitive Ageing, Nutrition & Neurogenesis Trial
1Norwich Medical School, University of East Anglia, Norwich, United Kingdom, 2School of Environmental Sciences, University of East Anglia, Norwich, United Kingdom, 3Centre for Clinical Brain Sciences, University of Edinburgh, Edinburgh, United Kingdom, 4C.J. Gorter Centre for High Field MRI, Department of Radiology, Leiden University Medical Centre, Leiden, Netherlands
Synopsis
As part of the CANN trial, we compared blood brain barrier (BBB) integrity in subjective memory impairment (SMI) and mild cognitive impairment (MCI), two early indicators of Alzheimer’s disease. Also, the impact of a combined flavanol and omega-3 fatty acid-based nutritional intervention on BBB leakage was explored for the SMI cohort. Dynamic-contrast-enhanced MRI was performed to obtain fractional plasma volume (vp) and volume transfer constant (KTrans) parameters. The results suggest that BBB leakage is similar in the SMI cohort and the nutritional intervention tends to be associated with improved BBB parameters.
Introduction
Age-associated blood brain barrier (BBB) leakage is related to the pathophysiology of cerebral small vessel diseases (cSVD)1-4. Quantitative measurement of microvascular integrity can therefore assess the severity, progression, and effectiveness of therapeutic interventions that aim to mitigate BBB dysfunction. Indeed, several studies suggest neurophysiological and neurocognitive benefits of individual dietary interventions (e.g. fish-derived fatty acids, plant bioactives) in lowering relative cSVD risks6. To our knowledge, no studies to date have compared subtle BBB leakage in mild cognitive impairment (MCI) to the self-diagnosed pre-MCI cognitive state, subjective memory impairment (SMI)5. In this study, as part of the Cognitive Ageing, Nutrition and Neurogenesis (CANN) randomised controlled trial6, we explore the hypothesis that BBB leakage measures are similar in SMI and MCI, and can thus provide an early indication of damage. Further, we also investigate the influence of a combined, rather than individual, dietary intervention on BBB leakage for SMI patients, via an omega-3 fatty acid flavonoid (OM3FLAV) supplement.Methods
A total of 17 SMI and 7 MCI subjects underwent dynamic-contrast-enhanced (DCE) MRI. Nine SMI subjects consumed the OM3FLAV as cocoa flavanol-containing chocolate drops and fatty-acid containing fish oil capsules orally, each day, for a year, whereas eight SMI and seven MCI control participants consumed flavanol-poor chocolate drops and omega-3-free oil capsules.MRI scanning was performed at 12 months using a 3T scanner (Discovery 750w; GE Healthcare, Milwaukee, WI, USA) with a 12-channel head coil for reception. The protocol included 3D T1-weighted inversion-recovery (IR) prepared-fast spoiled gradient recalled echo (FSPGR) with TR/TE=7.2/2.6ms, slice thickness=1mm, matrix=256×256, and FoV=230×230mm. This was followed by a DESPOT1-HIFI experiment consisting of SPGR acquisitions with flip angles (FAs) of 5, 10, and 15°, and an IR-SPGR acquisition with an FA of 5° (TR/TE/TI = 5.6/1.6/450 ms, FoV=240×240mm, slice thickness=4 mm, matrix=144×144). Finally, a matching 10.5-minute multi-phase SPGR sequence (FA=15°, matrix=144×96, temporal resolution=31s) was run after injection of Gadovist® at a dose of 0.1mmol/kg body weight and a rate of 1ml/s.
Motion correction of DCE-MRI data was performed using MCFLIRT in FSL (FMRIB Software Library, v6.0, Oxford Centre for Functional MRI of the Brain, UK)7. T1-weighted structural images and motion-corrected DCE-MRI data were aligned to the 15°-SPGR image using rigid-body registration (FSL-FLIRT7,8). Finally, T1-weighted structural data were used to segment the brain into white matter (WM) and grey matter (GM) masks via the FAST tool in FSL9.
Further analysis was performed in Python (version 3.9.110). Median region of interest (ROI) signal intensities were converted to dynamic concentration estimates by numerically solving the equation that relates concentration to signal enhancement11. ‘Native’ T1 values, without contrast, were calculated from DESPOT-HIFI data, which incorporated B1-correction.
Pharmacokinetic modelling was performed by fitting the Patlak model12 to the dynamic concentration estimates to obtain two vascular measures: fractional plasma volume (vp) and volume transfer constant (KTrans)2. The vascular input function necessary for this fitting was measured manually from a voxel placed in the superior sagittal sinus.
Results
Table 1 shows the participant demographics. Figure 1 shows example T1-weighted and DCE-MRI data for a 56-year-old SMI subject, and Figure 2 demonstrates Patlak fits to median WM and GM signals for that same subject. Figure 3 shows boxplots of DCE-MRI parameters for each group: SMI control, SMI active, and MCI control.Table 2 summarises the DCE-MRI parameters, as obtained after 12 months of intervention. For WM and GM there was no significant difference in vp and KTrans between the groups. For WM, comparing SMI control to SMI active, the latter tended to have higher vp and lower KTrans, but these differences were not statistically significant (p=0.17 and 0.35, respectively). DCE-MRI metrics were similar for SMI and MCI controls (p>0.05).
Discussion
In this preliminary analysis, we used conventional DCE-MRI pre-processing and analysis to investigate BBB permeability in approximately age- and body mass index (BMI)-matched SMI and MCI cohorts. We observed that BBB permeability in SMI control particpants tends to be similar to that of MCI controls, and the SMI active group tended to have lower KTrans and higher vp than the control group. However, although some trends were observed in vp and KTrans, none reached statistical significance. One of the reasons for this could be the relatively short duration of our DCE acquisition (10.5 minutes), compared to the recommended duration of 15-20 minutes3,13. This may limit our ability to distinguish very low KTrans values from zero. Nevertheless, there is scope for further analysis and refinements, such as implementing deep learning-based segmentation (e.g. FastSurfer14) to study local differences in DCE-MRI parameters, particularly in the hippocampus, as well as data fitting under the no exchange limit4, and expansion of the cohort to better characterise the subtle differences hinted at here.Conclusion
In this study we reported permeability metrics for SMI subjects and, for the first time, compared them to those of an MCI cohort. Additionally, we explored the potential impact of a nutritional intervention on SMI participants. Results show that SMI participants tend to have similar BBB permeability to MCI participants, and the intervention tended to improve permeability in SMI. Further analysis and finer segmentations will indicate the potential of permeability measures as early indicators of MCI.Acknowledgements
No acknowledgement found.References
1. Heye AK, Culling RD, Valdés Hernández Mdel C, Thrippleton MJ, Wardlaw JM. Assessment of blood-brain barrier disruption using dynamic contrast-enhanced MRI. A systematic review. Neuroimage Clin. 2014;6:262-274.
2. Heye AK, Thrippleton MJ, Armitage PA, et al. Tracer kinetic modelling for DCE-MRI quantification of subtle blood-brain barrier permeability. NeuroImage. 2016;125:446-455.
3. Thrippleton MJ, Backes WH, Sourbron S, et al. Quantifying blood-brain barrier leakage in small vessel disease: Review and consensus recommendations. Alzheimers Dement. 2019;15(6):840-858.
4. Manning C, Stringer M, Dickie B, et al. Sources of systematic error in DCE-MRI estimation of low-level blood-brain barrier leakage. Magnetic resonance in medicine. 2021.
5. Jessen F, Wiese B, Bachmann C, et al. Prediction of dementia by subjective memory impairment: effects of severity and temporal association with cognitive impairment. Arch Gen Psychiatry. 2010;67(4):414-422.
6. Irvine MA, Scholey A, King R, et al. The Cognitive Ageing, Nutrition and Neurogenesis (CANN) trial: Design and progress. Alzheimer's & Dementia: Translational Research & Clinical Interventions. 2018;4(1):591-601.
7. Jenkinson M, Bannister P, Brady M, Smith S. Improved optimization for the robust and accurate linear registration and motion correction of brain images. NeuroImage. 2002;17(2):825-841.
8. Jenkinson M, Smith S. A global optimisation method for robust affine registration of brain images. Med Image Anal. 2001;5(2):143-156.
9. Zhang Y, Brady M, Smith S. Segmentation of brain MR images through a hidden Markov random field model and the expectation-maximization algorithm. IEEE Transactions on Medical Imaging. 2001;20(1):45-57.
10. Rossum GV, Drake FL. Python 3 Reference Manual. CreateSpace; 2009.
11. Armitage PA, Farrall AJ, Carpenter TK, Doubal FN, Wardlaw JM. Use of dynamic contrast-enhanced MRI to measure subtle blood–brain barrier abnormalities. Magnetic Resonance Imaging. 2011;29(3):305-314.
12. Patlak CS, Blasberg RG, Fenstermacher JD. Graphical evaluation of blood-to-brain transfer constants from multiple-time uptake data. Journal of cerebral blood flow and metabolism : official journal of the International Society of Cerebral Blood Flow and Metabolism. 1983;3(1):1-7.
13. Barnes SR, Ng TS, Montagne A, Law M, Zlokovic BV, Jacobs RE. Optimal acquisition and modeling parameters for accurate assessment of low Ktrans blood-brain barrier permeability using dynamic contrast-enhanced MRI. Magnetic resonance in medicine. 2016;75(5):1967-1977.
14. Henschel L, Conjeti S, Estrada S, Diers K, Fischl B, Reuter M. FastSurfer - A fast and accurate deep learning based neuroimaging pipeline. NeuroImage. 2020;219:117012.
Figures

Table 1: Participant demographics for each of the three studied cohorts. Abbreviations: SMI, subjective memory impairment; MCI, mild cognitive impairment; BMI, body mass index; SD, standard deviation. Group abbreviations: SMI-control, SMI with omega-3- and flavanol-poor intervention; SMI-active, SMI with nutritional (OM3FLAV) intervention; MCI-control, MCI with omega-3- and flavanol-poor intervention.
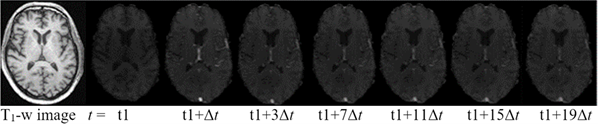
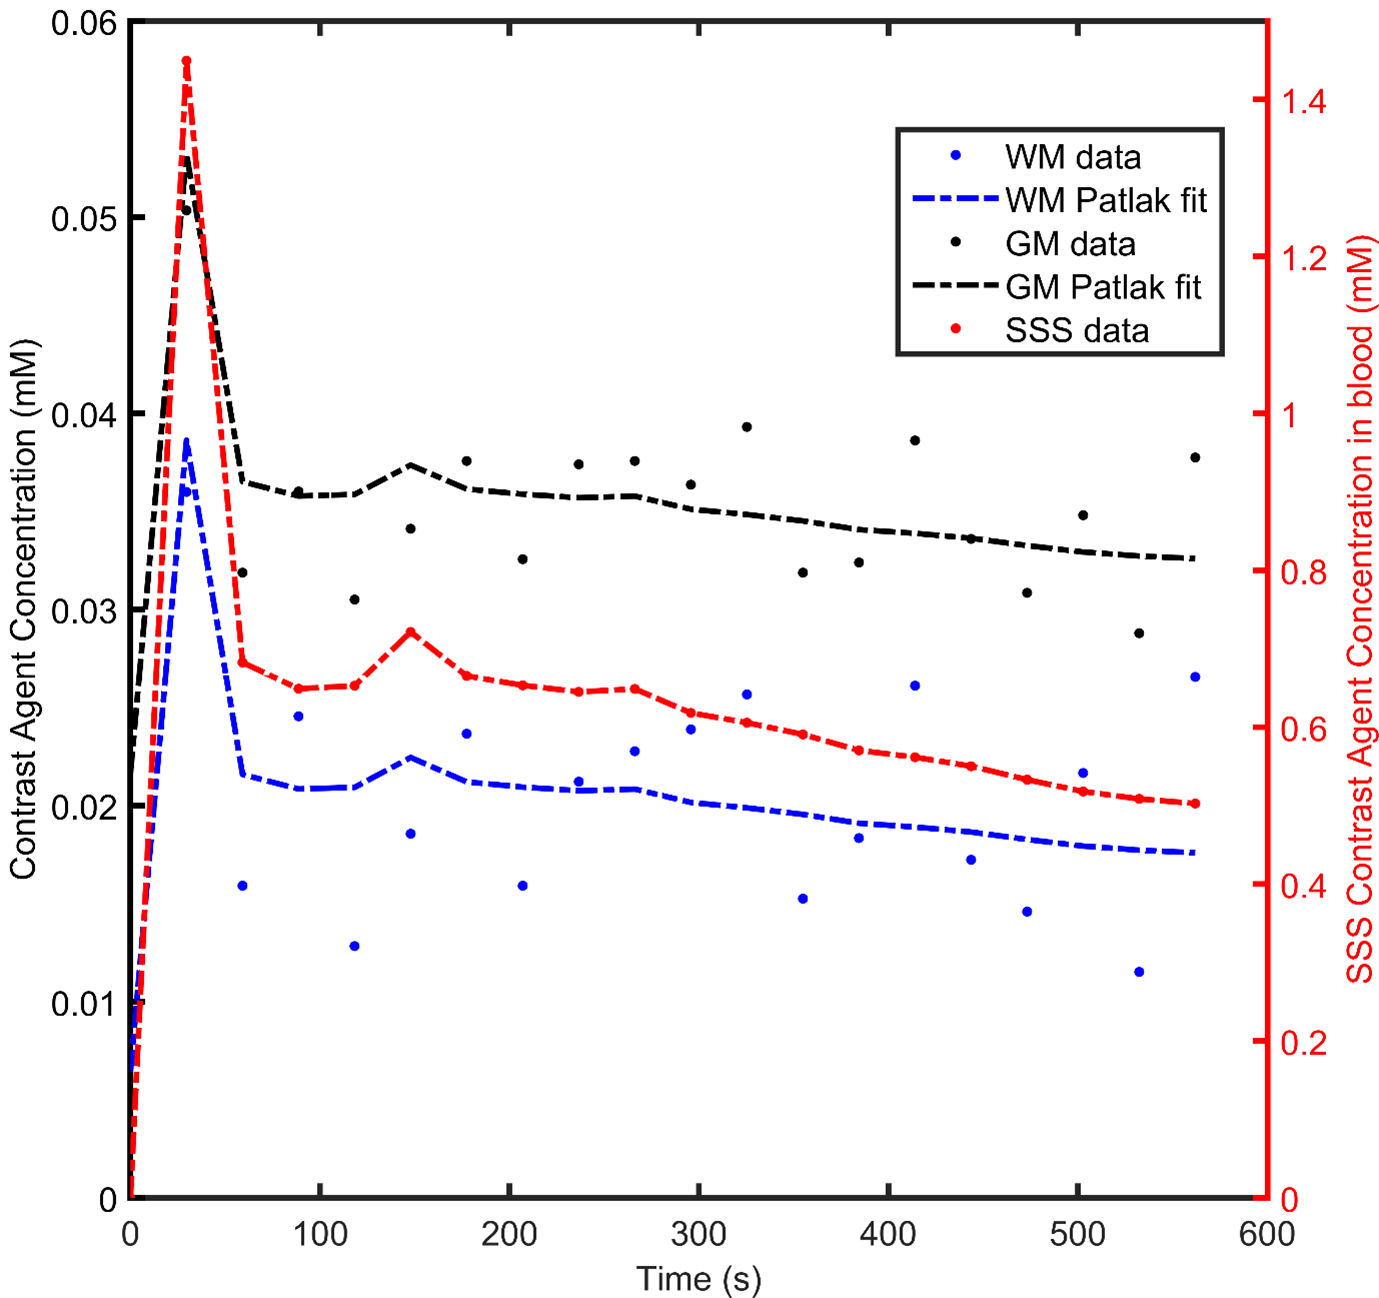
Figure 2: Scatter-plots showing typical Patlak model fits (solid lines) to the median concentration time curves of white matter (WM) and grey matter (GM). Vascular input function obtained from the superior sagittal sinus (SSS) is also shown on a different scale.
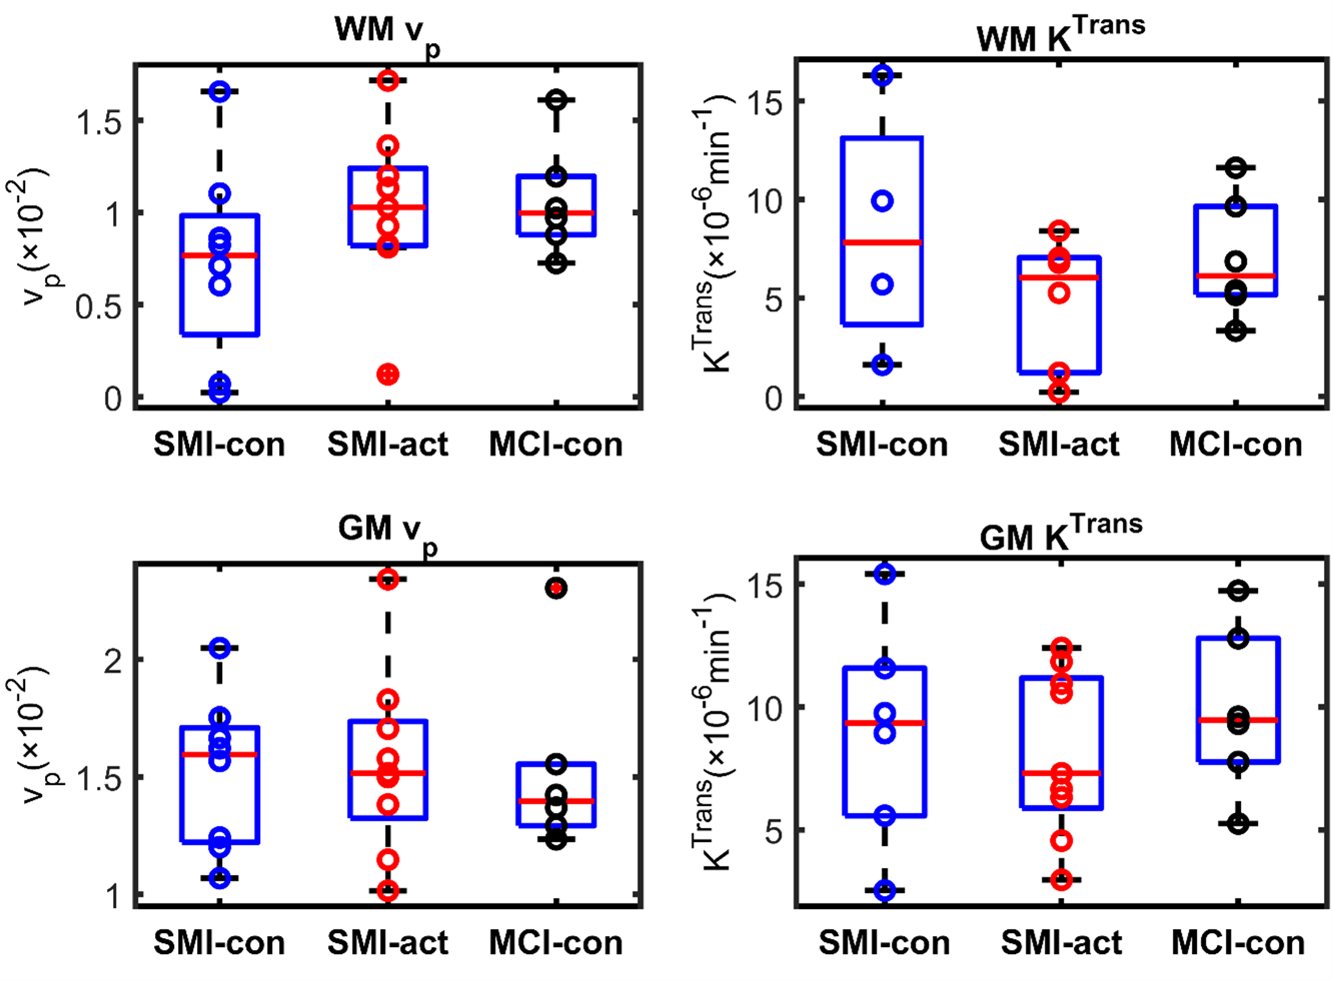
Figure 3: Boxplots of fractional plasma volume (vp) and volume transfer constant (KTrans) in white matter (WM) and grey matter (GM) for different groups, as obtained after 12 months of intervention. No significant difference was obtained between the three groups. Group abbreviations: SMI-control, subjective memory impairment (SMI) with omega-3- and flavanol-poor intervention; SMI-active, SMI with nutritional (OM3FLAV) intervention; MCI-control, mild cognitive impairment with omega-3- and flavanol-poor intervention.

Table 2: Mean (Standard Deviation) of fractional plasma volume (vp) and volume transfer constant (KTrans) for WM, GM, and whole brain masks, as obtained after 12 months of intervention. Abbreviations: SMI, subjective memory impairment; MCI, mild cognitive impairment; WM, white matter; GM, grey matter. Group abbreviations: SMI-control, SMI with omega-3- and flavanol-poor intervention; SMI-active, SMI with nutritional (OM3FLAV) intervention; MCI-control, MCI with omega-3- and flavanol-poor intervention.