2388
Assessment of resting-state networks in Alzheimer’s disease using combined spin- and gradient-echo fMRI1Barrow Neurological Institute, Phoenix, AZ, United States, 2Arizona State University, Tempe, AZ, United States
Synopsis
Functional connectivity, measured with BOLD-fMRI, has been previously used to study changes in aging and Alzheimer’s disease. A combined spin- and gradient-echo (SAGE) acquisition may be able to more sensitively distinguish between disease-related changes in functional connectivity. Therefore, this study aims to implement SAGE in resting-state fMRI to assess differences between macro- and microvasculature-sensitive data, between SAGE maps and single-echo methods, and between healthy aging and cognitively impaired cohorts’ functional networks.
Introduction
Decreases in functional connectivity begin to occur in normal aging and are hastened in Alzheimer’s disease (AD). In particular, the default mode network (DMN), consisting of brain regions that increase in activity in the absence of a task, is impacted severely1. The DMN is of interest in AD due to its proposed functional role in memory consolidation2 and its anatomical overlap with amyloid burden3. The salience network (SN), also impacted by AD4, identifies the most relevant stimuli present, working with the DMN and executive control network to execute cognitive processes5. Although functional connectivity has frequently been assessed in AD, the blood oxygen level-dependent (BOLD) functional MRI (fMRI) method that is used is dominated by macrovasculature, whereas microvascular data may be more reflective of AD pathology6. To improve the sensitivity of resting-state fMRI methods in the context of AD, we implemented a multi-contrast, multi-echo SAGE acquisition to assess functional networks, with complementary sensitivity to macro- and micro-vasculature, in a cohort of healthy aging and cognitively impaired adults. Specifically, we expect to see differences between 1) resting-state networks identified with macrovascular sensitivity compared to those with microvasculature sensitivity, as well as 2) networks identified with SAGE compared to single echo methods. Additionally, we aim to assess group differences between healthy aging and cognitively impaired populations and anticipate that SAGE-fMRI will more sensitively distinguish between groups than single-echo GE and SE fMRI.Methods
Dynamic SAGE EPI data were acquired at 3T (Ingenia, Philips) with a dedicated 32-channel head coil in two cohorts: 1) non-cognitively impaired cohort (HC, n=10, 70.8±6.6 years old, 7 females) and 2) cognitively impaired cohort, including both MCI and AD (CI, n=8, 74.0±6.2 years old, 4 females). BOLD-fMRI data were acquired with the SAGE acquisition, (2 GE, 2 asymmetric SE (ASE), and 1 SE, TE1-5=7.8/27/57/75/94 ms). Additional acquisition parameters were as follows: repetition time (TR) = 2.1 s, acquisition matrix: 80×78, reconstruction matrix: 96×96, voxel size = 3×3 mm, slice thickness = 4 mm, in-plane field-of-view (FOV) = 24 cm, 225 volumes, multiband factor = 2, SENSE = 2.4, partial Fourier = 0.73, acquisition time = 7.88 min.Each of the five SAGE-fMRI echoes underwent standard pre-processing with FSL7 and AFNI8, including the following: removal of first four volumes for scanner to reach steady state, despiking, temporal alignment, motion correction, distortion correction, and brain extraction. SAGE-based9 T2* and T2 were calculated10–12 and used for subsequent fMRI analysis. Independent component analysis (ICA) was run via MELODIC (FSL)7,13 for the macrovascular- (T2*)and microvasculature-weighted (T2) SAGE maps10,11, as well as for the second (i.e., GE) and fifth (i.e., SE) echoes for comparison. Spatial smoothing was implemented (FWHM=5mm), as well as temporal filtering (highpass). Each subject’s fMRI data was co-registered first to its structural image and then to standard space (MNI-152); resampling resolution was 4 mm. ICA output was set to generate 30 components, which were labeled as signal or noise manually based on established resting-state fMRI networks14,15; those identified as signal were included in subsequent analysis. Cohen’s D effect size was calculated to assess group differences within components, where a threshold was set at medium size effect (D≥0.50).
Results
Resting-state networks were identified for each contrast (SAGE-based T2*, TE2, T2, and TE5), as shown in Table 1. Of note, visual (occipital pole and medial), executive control, and sensorimotor networks were identified across all contrasts, while remaining networks were identified in a subset of contrasts.For DMN (Figure 1), SAGE T2*-weighted maps showed largely lateralized group differences, where the left and right posterior cingulate and left precuneous showed medium and large effect sizes (HC>CI) and the right posterior cingulate exhibited a large effect size (HC<CI); TE2 largely showed medium and large effect sizes (CI>HC) bilaterally within the precuneous, posterior cingulate, and medial prefrontal cortex. ICA did not result in a DMN component for microvasculature-sensitive contrasts (T2, TE5).
For the SN (Figure 2), group differences for microvascular-weighted SAGE T2 showed a medium effect size (HC>CI) in the right insula and anterior cingulate. SAGE T2* group differences reveal a medium effect size (HC>CI) in the left and right insula. A smaller effect size was seen in the left and right insula for TE2, where HC<CI. ICA did not result in a SN component for TE5.
Discussion
Preliminary results show that SAGE provides unique information between macrovascular- and microvascular-weighted maps. Additionally, the inclusion of multiple echoes should yield more information compared to single-echo fMRI methods. As applied to cognitively impaired cohorts, SAGE maps showed medium and large effects, where HC>CI in general in both the DMN and SN. Given the different group results (HC<CI) largely seen in single-echo TE2 maps, as well as some noise within components, SAGE may be able to more robustly identify functional networks and more sensitively distinguish between healthy aging and cognitively impaired populations.Conclusion
SAGE provides distinct microvasculature-sensitive information compared to existing single- and multi-echo fMRI methods, as well as more robust resting-state data. Future work include testing whether SAGE is sensitive to changes in functional networks between healthy aging and early cognitive decline.Acknowledgements
We acknowledge Philips as well as the funding sources for this work, the Arizona Alzheimer's Consortium and the Barrow Neurological Foundation.References
1. Dennis EL, Thompson PM. Functional brain connectivity using fMRI in aging and Alzheimer’s disease. Neuropsychol Rev. 2014;24(1):49-62.
2. Fox MD, Raichle ME. Spontaneous fluctuations in brain activity observed with functional magnetic resonance imaging. Nat Rev Neurosci. 2007;8(9):700-711.
3. Mormino EC, Smiljic A, Hayenga AO, et al. Relationships between β-amyloid and functional connectivity in different components of the default mode network in aging. Cereb Cortex. 2011;21(10):2399-2407.
4. He X, Qin W, Liu Y, et al. Abnormal salience network in normal aging and in amnestic mild cognitive impairment and Alzheimer’s disease. Hum Brain Mapp. 2014;35(7):3446.
5. Fox MD, Snyder AZ, Vincent JL, et al. The human brain is intrinsically organized into dynamic, anticorrelated functional networks. Proc Natl Acad Sci U S A. 2005;102(27):9673-9678.
6. Nortley R, Korte N, Izquierdo P, et al. Amyloid β oligomers constrict human capillaries in Alzheimer’s disease via signaling to pericytes. Science. 2019;365(6450).
7. Jenkinson M, Beckmann CF, Behrens TE, Woolrich MW, Smith SM. FSL 1. Neuroimage. 2012;62(2).
8. Cox RW. AFNI: Software for analysis and visualization of functional magnetic resonance neuroimages. Comput Biomed Res. 1996;29(3).
9. Stokes AM, Skinner JT, Quarles CC. Assessment of a combined spin- and gradient-echo (SAGE) DSC-MRI method for preclinical neuroimaging. Magn Reson Imaging. 2014;32(10):1181-1190.
10. Bergamino M, Steffes L, Gonzales A, Karis J, Baxter L, Stokes A. Optimization of vascular and functional sensitivity using multi-contrast, multi-echo SAGE-EPI for fMRI. Proc 28th Annu Meet ISMRM Sydney, Aust. 2020:5428.
11. Keeling EG, Bergamino M, Burke AD, et al. Implementation of multi-contrast, multi-echo SAGE-fMRI in aging and Alzheimer’s disease. Proc 29th Annu Meet ISMRM. 2021:305.
12. Sisco NJ, Keeling EG, Dortch RD, Stokes AM. Rapid Parameter Estimation for Combined Spin and Gradient Echo (SAGE) Imaging. Proc 30th Annu Meet ISMRM. 2022.
13. Beckmann CF, Smith SM. Probabilistic independent component analysis for functional magnetic resonance imaging. IEEE Trans Med Imaging. 2004;23(2):137-152.
14. Smith SM, Fox PT, Miller KL, et al. Correspondence of the brain’s functional architecture during activation and rest. Proc Natl Acad Sci. 2009;106(31):13040-13045.
15. Doll A, Hölzel BK, Boucard CC, Wohlschläger AM, Sorg C. Mindfulness is associated with intrinsic functional connectivity between default mode and salience networks. Front Hum Neurosci. 2015;9:461.
Figures
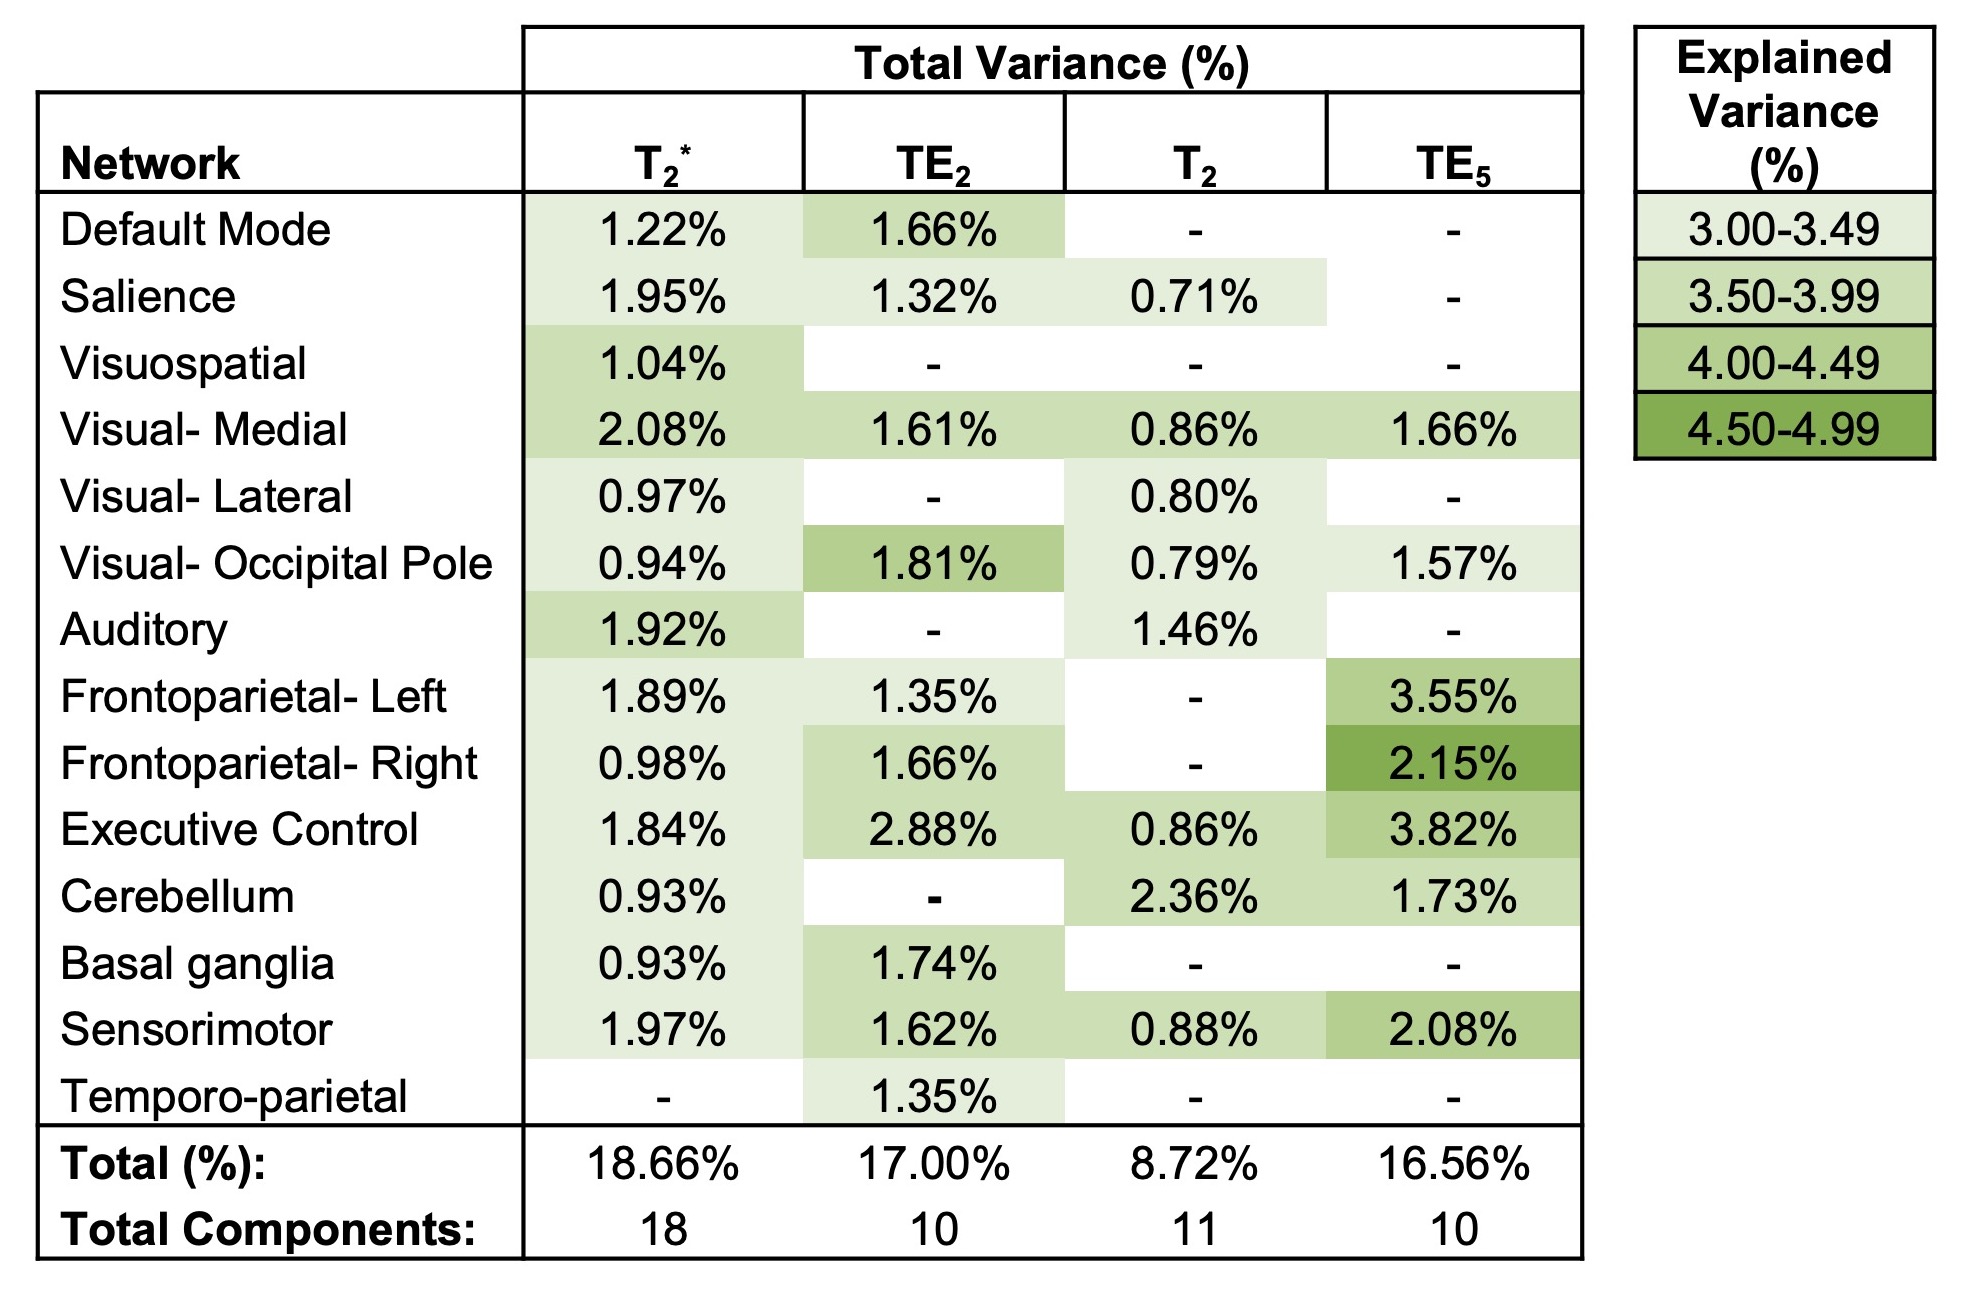
Table 1. Components identified as functional networks from ICA. The percent of total variance accounted for per component is listed for each network, and each cell is color-coded to indicate the percent of uniquely explained variance per component for a specific network (for networks that appeared in more than one component, the component with maximum explained variance was reported in this table).
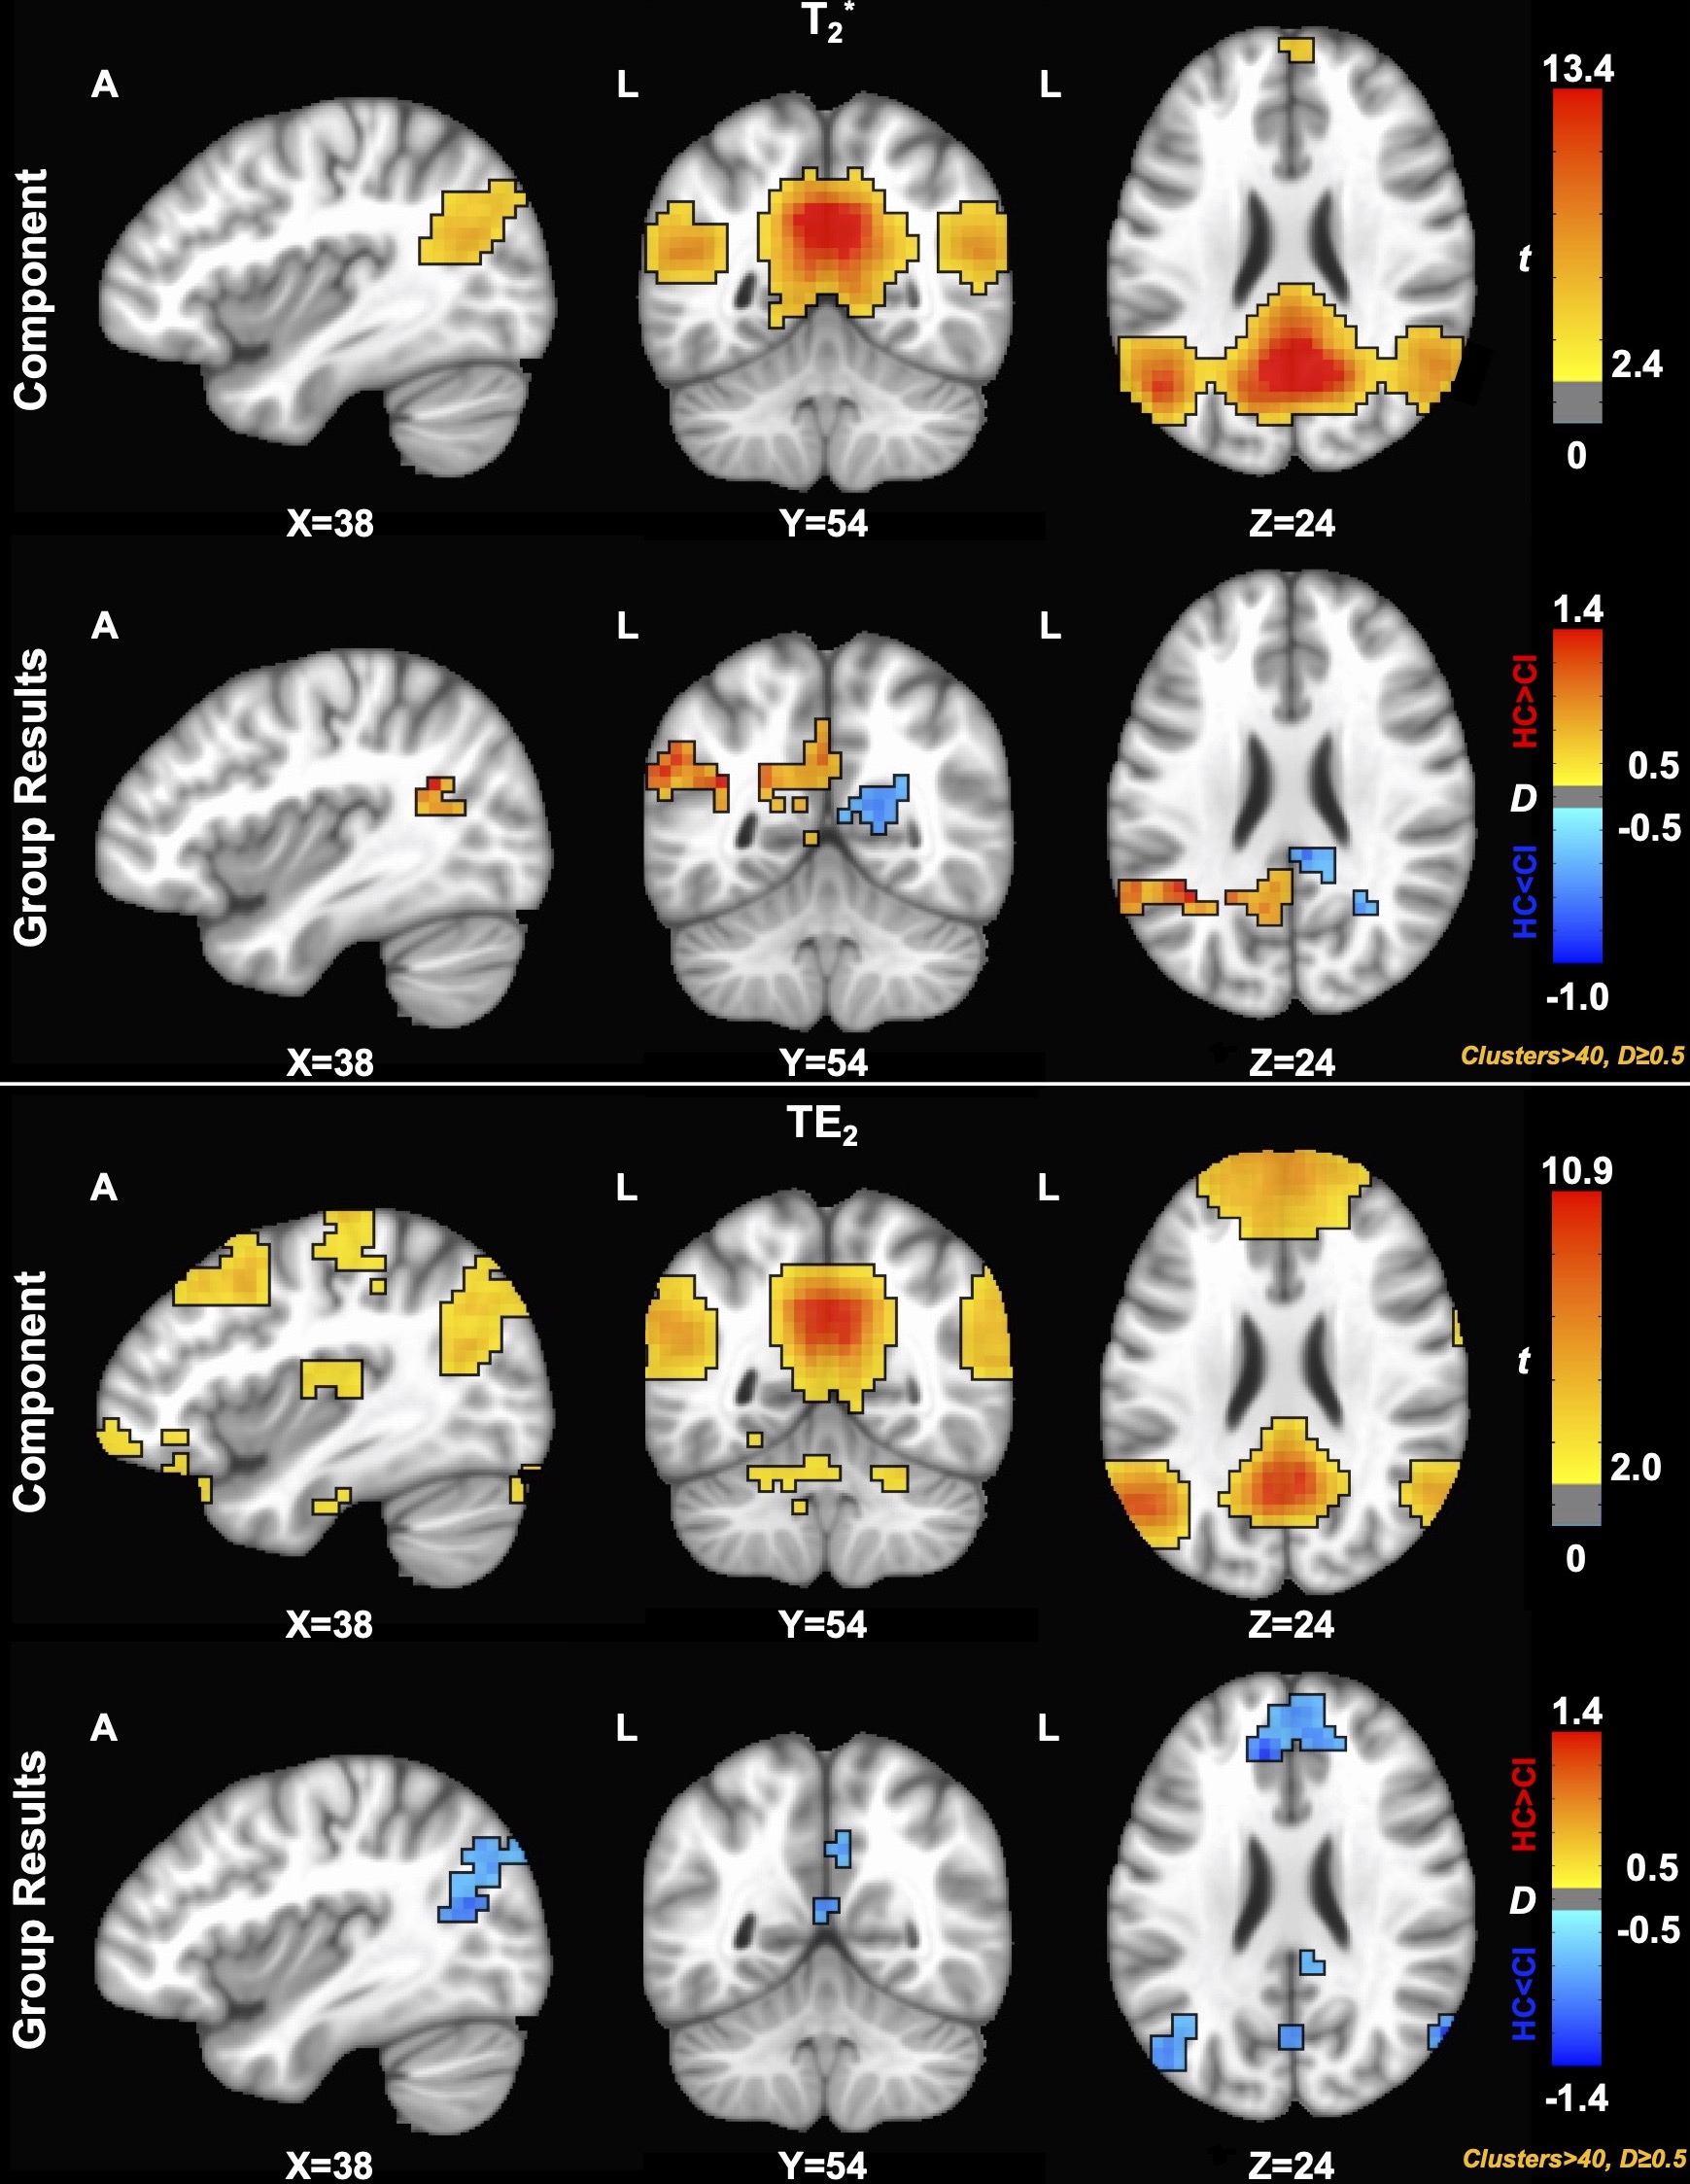
Figure 1. Component (p<0.05) and group (D≥0.50) results for the default mode network (DMN) across macrovascular contrasts. ICA did not result in a DMN component for microvasculature-sensitive contrasts (T2, TE5). SAGE T2*-weighted maps showed medium and large effect sizes (HC>CI) in the left and right posterior cingulate and left precuneous; the right posterior cingulate showed a large effect size (HC<CI); TE2 largely showed medium and large effect sizes (CI>HC) bilaterally within the precuneous, posterior cingulate, and medial prefrontal cortex.
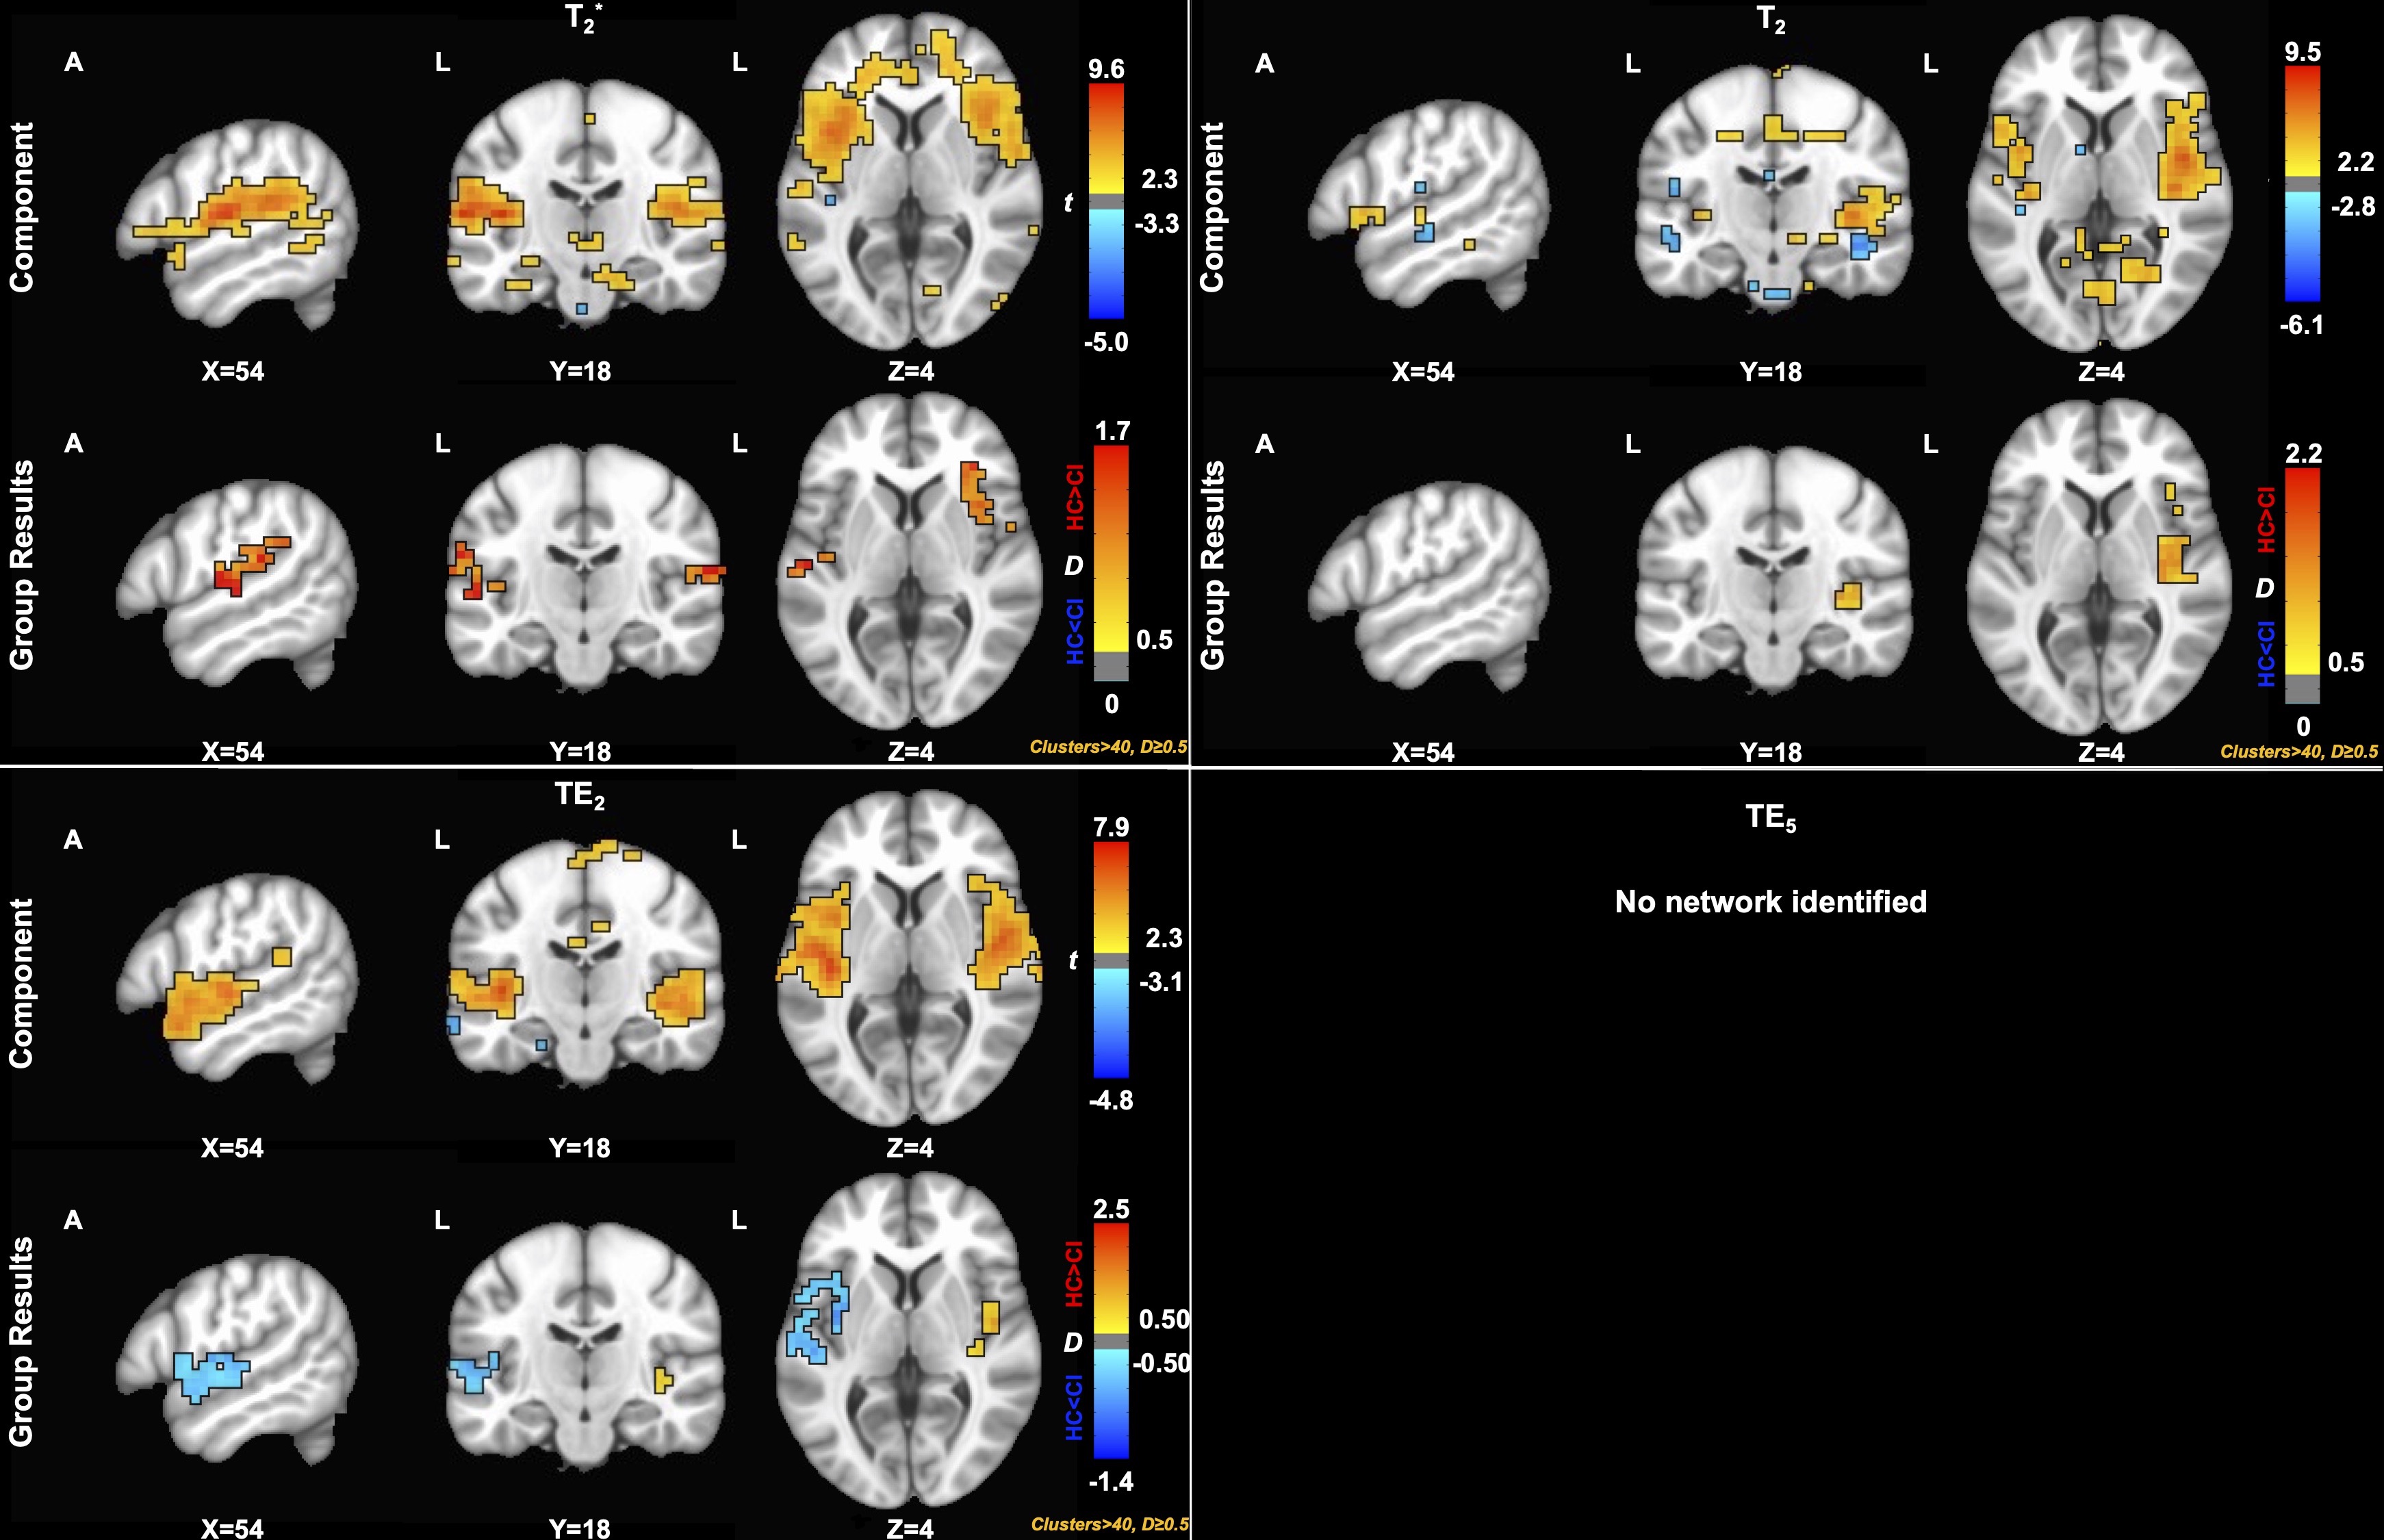
Figure 2. Component (p<0.05) and group (D≥0.50) results for the salience network (SN) across contrasts. SAGE T2 group differences showed a medium effect size (HC>CI) in the right insula and anterior cingulate. SAGE T2* group differences reveal a medium effect size (HC>CI) in the left and right insula. A smaller effect size was seen in the left and right insula for TE2 (HC<CI).