2386
Application of Graph Theory in the study of functional and structural connectivity in Mild Cognitive Impairment (MCI) disease1FiRMLAB, IRCCS Stella Maris, Pisa, Italy, 2Department of Physics, University of Pisa, Pisa, Italy, 3Institute of Neuroscience of the CNR, Pisa, Italy, 4the Train the Brain Consortium, Pisa, Italy
Synopsis
Graph theory approach was used to analyze structural and functional connectivity networks to identify candidate biomarkers of Mild Cognitive Impairment (MCI), a prodromal stage of Alzheimer’s disease (AD), for an early diagnosis and intervention. We proposed a method of brain network analysis to combine structural and functional connectivity networks information. Through graph measures (Segregation, Centrality and Global Efficiency), we evaluated the differences between MCI and healthy control (HC) subjects as well the possible effects of physical/cognitive training, in terms of structural and functional connectivity, in MCI population.
Introduction
Mild cognitive impairment (MCI) is characterized by decline in cognition and memory compared to normal aging and may be considered a transitional state between normal aging and Alzheimer Disease (AD). Many studies suggest that the analysis of functional connectivity may be particularly valuable for detecting early, preclinical signs of AD1,2. Structural connectivity studies also revealed alterations in the white matter of MCI patients compared with AD and healthy aged subjects3,4. However, how functional and structural information could be integrated is still under debate. Here we propose a method of analysis of a brain network and a way to integrate structural and functional connectivity.Methods
We included 159 subjects: 19 healthy control (HC) and 140 MCI subjects, randomly divided into two sub-groups: MCI_training (82 subjects) who underwent cognitive and motor training for 7 months and MCI_no-training (58 subjects) who followed their natural lifestyle for 7 months.The study protocol involved two identical MRI exams: one at T0 and one after 7 months (T7). The 1.5T MRI acquisition protocol included: a 3D-T1weighted structural sequence (FSPGR, TR=12.5 ms, TE=5.1ms, 1mm isotropic voxel, matrix=256×256, Flip Angle=10°); a Diffusion-Weighted sequence (DWI-EPI, 35 gradient directions, bvalue=3000s/mm2, TR=14s, TE=110ms, 3mm isotropic voxel, matrix=80×80, Flip Angle=90°); a resting-state fMRI acquisition (EPI-GRE, TR=3s, TE=50ms, 3mm isotropic voxel, matrix=64×64, Flip Angle=90°, 124 volumes).
3D-T1weighted images were segmented and parcelled by using the Desikan-Killany atlas5.
The structural and functional connectivity matrices were calculated using the brain areas of the Desikan-Killiany atlas as nodes and, respectively, the number of reconstructed structural tracts and the correlation coefficients of BOLD signal among brain areas as links6.
Measurements of segregation were carried out on HC brain structural and functional networks at T0 to identify the modules in which networks split. These modules were used as reference for the analysis of the structural and functional connectivity of MCI subjects. Measures of centrality were performed to identify the most important nodes within modules while measures of Global Efficiency (GE) were used to quantify the level of information exchanged across the modules7.
Multiple statistical tests were performed to compare the distributions of graph measurements between sub-groups of subjects (HC vs MCI subjects, MCI-training vs MCI no-training) and different time points (T0 vs T7), using a significance threshold equal to p <0.05 and age, sex and brain volume as covariates in the ANCOVA analyses.
Results
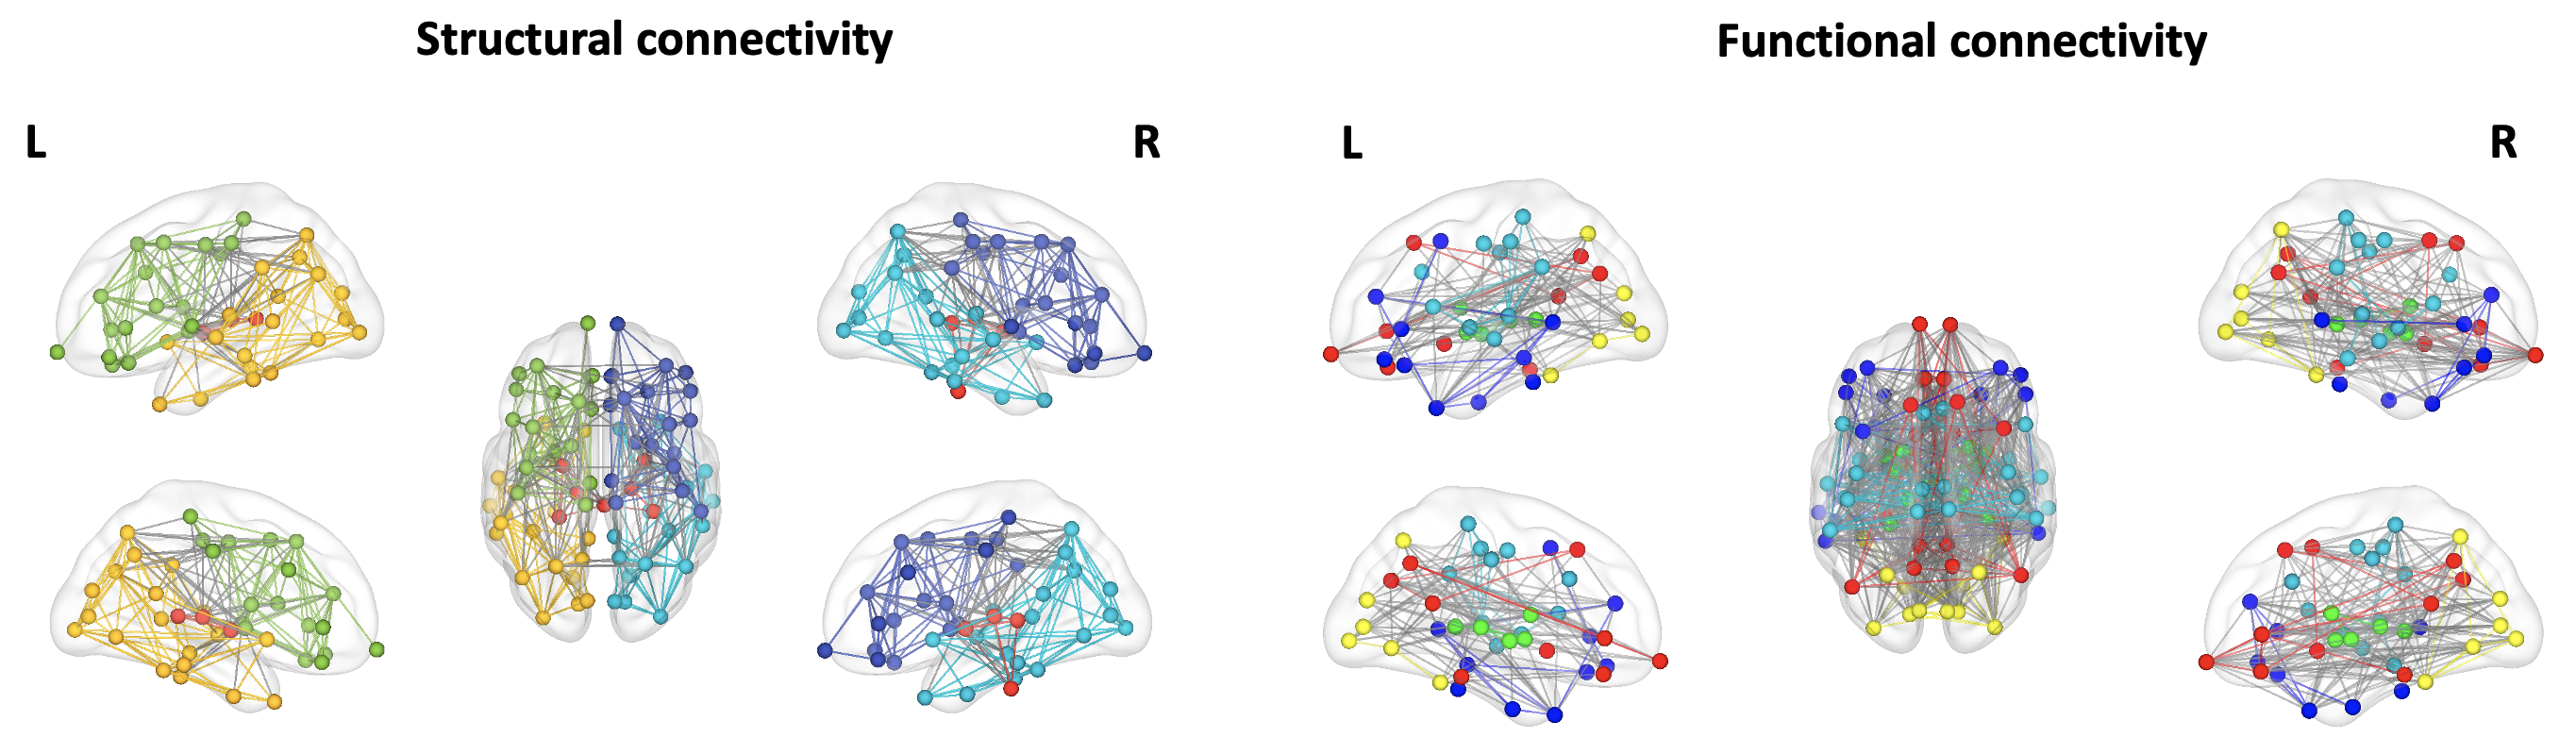
Measures of segregationThe measurements of segregation identified five modules for both structural connectivity and functional connectivity networks (Figure 1). For structural connectivity, substantial separation between cortical areas of the right and left hemispheres and subcortical areas was found. For functional connectivity, modules were denominated on the basis of the belonging functional areas, in accordance with literature8.
Measures of Centrality
Significant differences of centrality in structural connectivity were found between HC and MCI at T0 (HC > MCI) in two homologous modules: in the left medial orbito frontal gyrus and posterior cingulate and in the right caudate, lateral and medial orbito frontal gyrus areas.
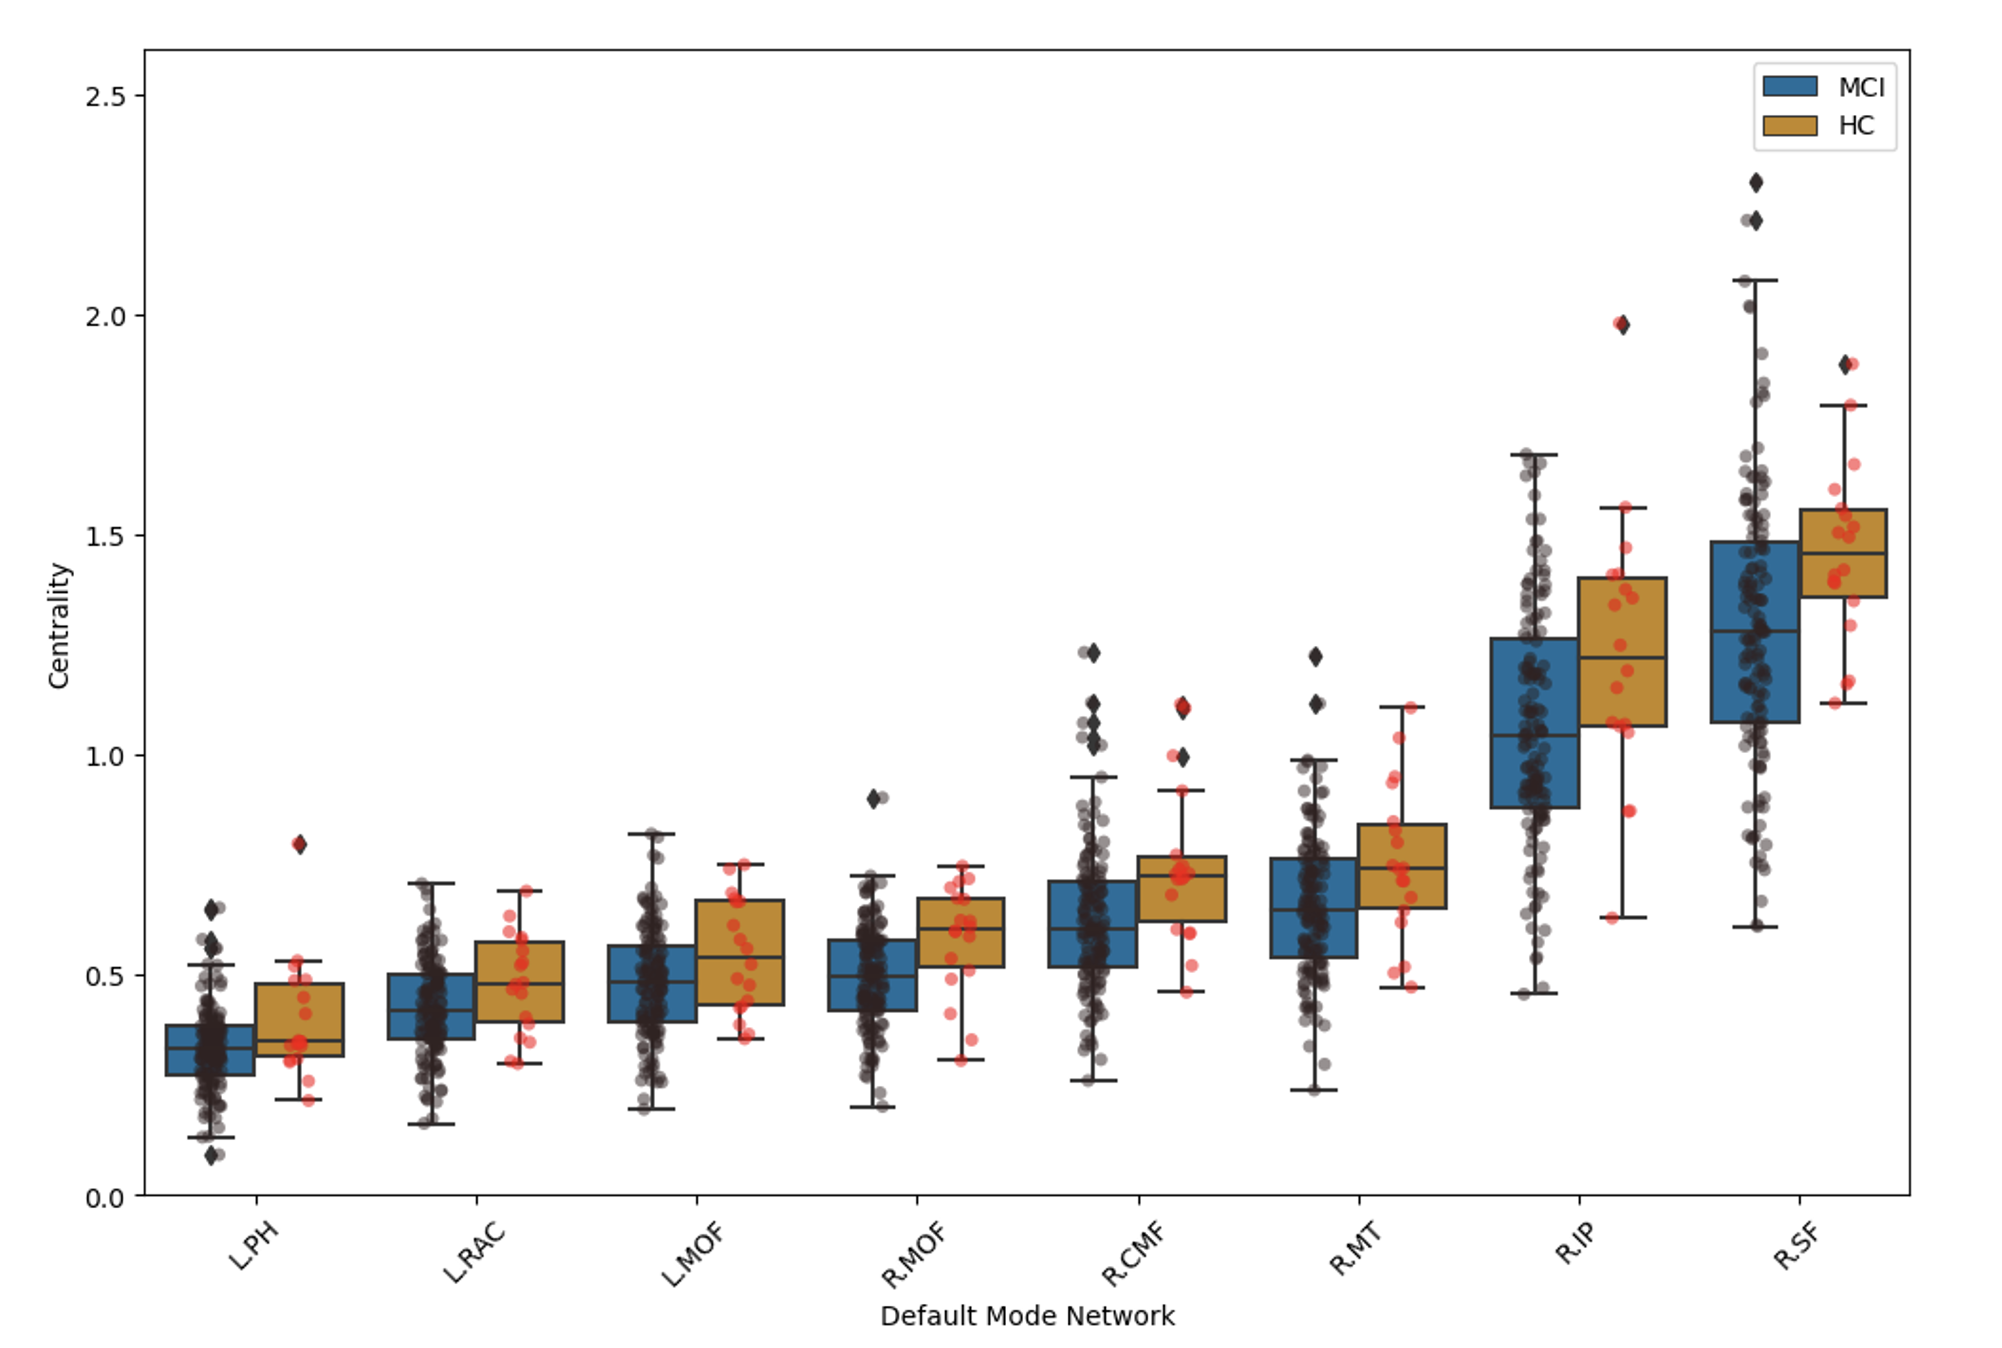
Regarding functional connectivity, the comparison between the HC and MCI groups at T0 showed significant differences for centrality within the Default Mode Network (DMN) (Figure 2) and in some areas of the sensory-motor module, with higher values in HC, indicating that these modules are sensitive to alterations related to MCI disease.
Moreover, MCI_training subjects showed significantly higher centrality values at T7 compared to T0 in the right supramarginal gyrus and in the left cuneus. Using the same contrast, in the case of MCI_no-training subjects the statistical analysis highlighted differences in the right middle caudal frontal gyrus and bilaterally for the middle temporal gyrus.
Finally, higher centrality values at T0 compared to T7 were observed for MCI_no-training in the right post-central gyrus.
Measures of Global Efficiency
For functional connectivity, statistical analysis has shown that the value of GE in the DMN is significantly higher in HC than in MCI at T0. No significant GE differences for structural connectivity at T0 and for MCI-training/MCI no-training comparison were found.
Integration between structural and functional connectivity
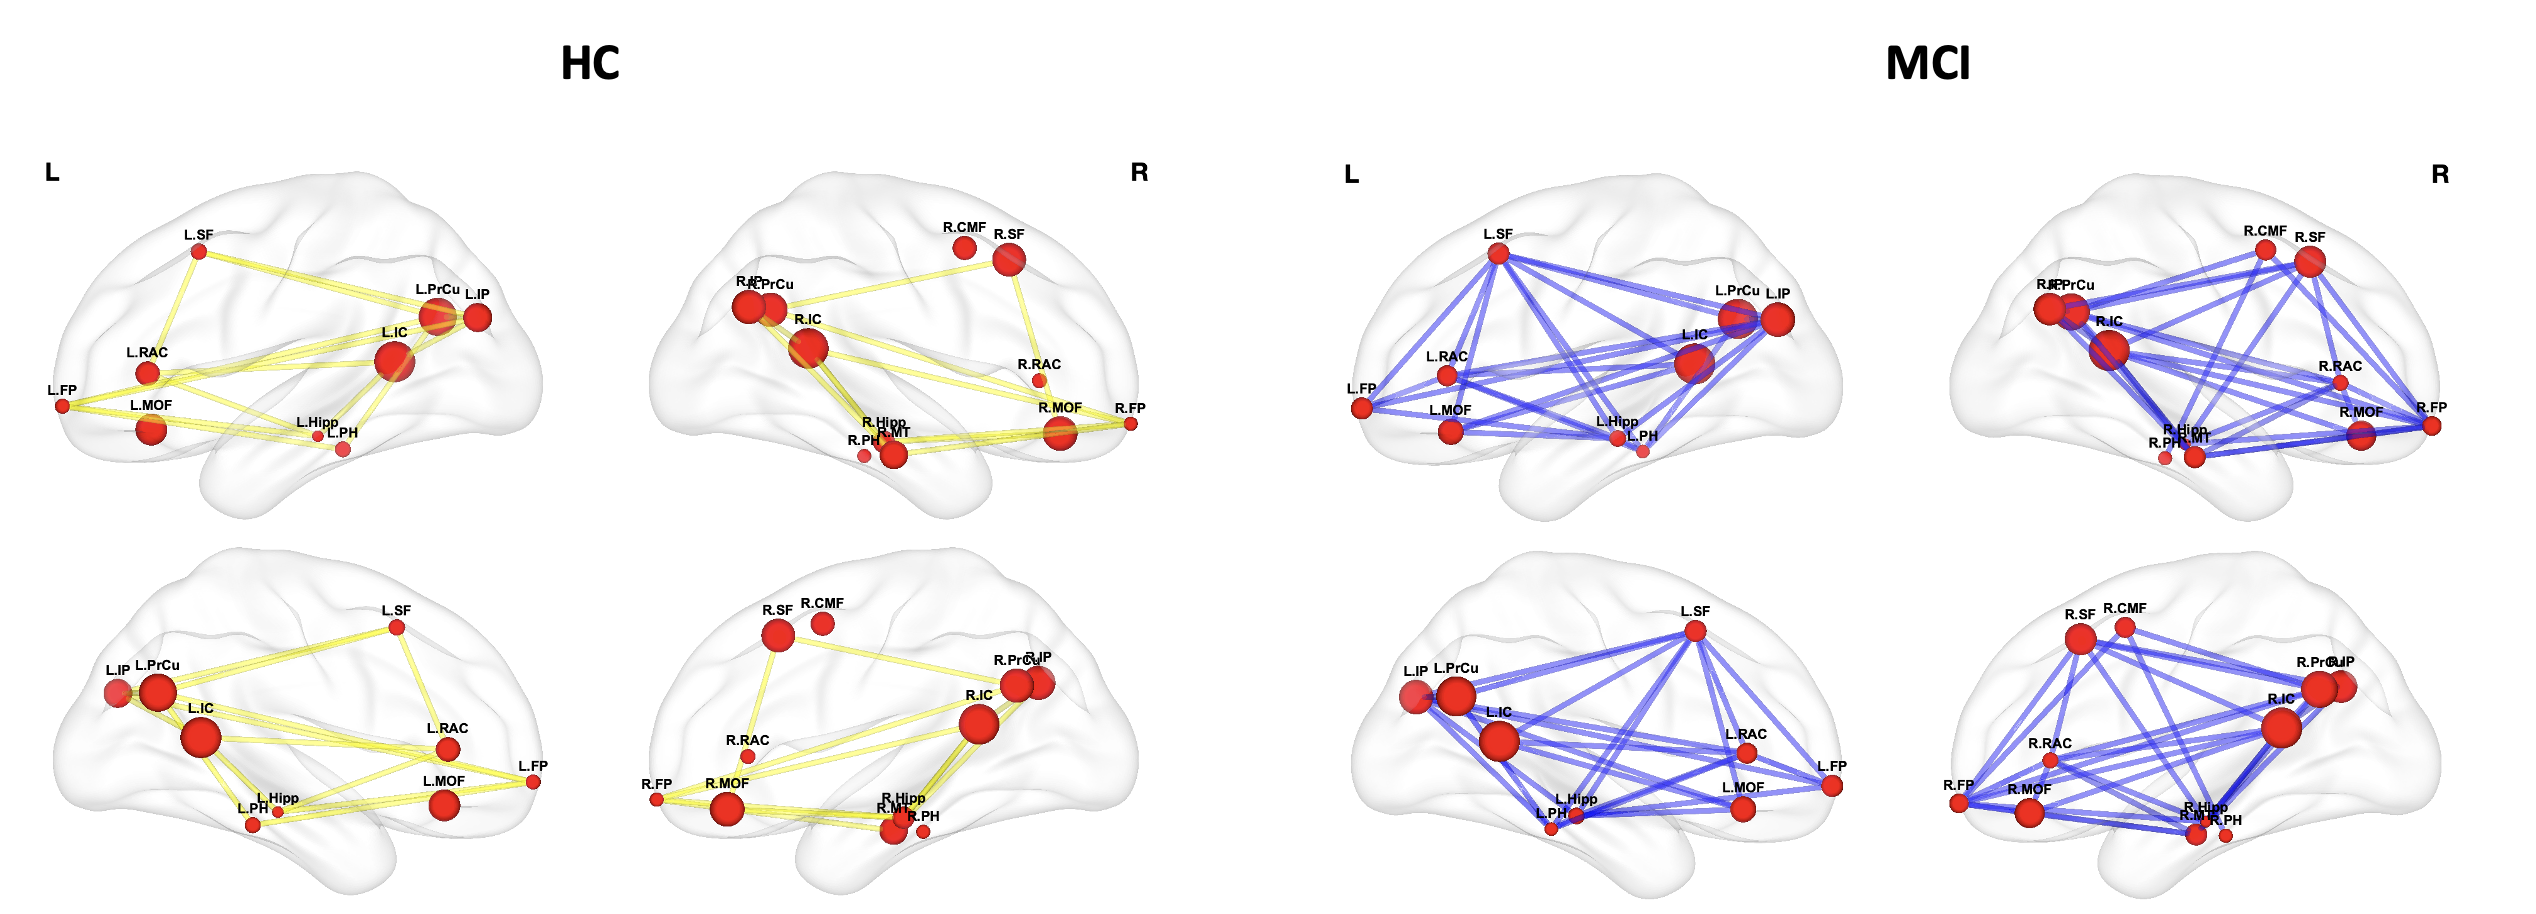
Considering the numerous significant differences within the functional connectivity network between HC and MCI at T0, we made the centrality and GE measurements on the structural connectivity data, using as modules those obtained by using functional connectivity data. Significant alterations were found within the DMN (Figure 3) and cognitive and linguistics areas for centrality values and within the DMN for GE values (HC > MCI at T0).
Discussion and Conclusion
The functional connectivity measures confirmed the presence of detectable alterations between MCI and HC subjects, particularly in the regions of the well-known functional DMN. The obtained results also suggest a positive trend in the effect of physical/cognitive training on MCI subjects. Furthermore, the integration of structural and functional connectivity detects Global Efficiency and centrality values differences within the DMN. These results show that among the functionally altered areas of the DMN there are also differences in structural connectivity between MCI and HC subjects.Acknowledgements
This work has been partially supported by the following fundings:
CARIPLO 2015-0594 "A systematic molecular study of neuroimmune dysregulation in aging"
Fondazione Pisa, 2016 “A traslational study on inflammation and aging”
References
1. Li L, Guoqiang X, Ying H. Advances in Resting State Neuroimaging of Mild Cognitive Impairment. Front. Psychiatry. 2018;9, 671.
2. Franzmeier N, et al. Resting-state global functional connectivity as a biomarker of cognitive reserve in mild cognitive impairment. Brain Imaging Behav. 2017;11(2):368-382.
3. Brueggen K, et al. Basal Forebrain and Hippocampus as Predictors of Conversion to Alzheimer's Disease in Patients with Mild Cognitive Impairment - A Multicenter DTI and Volumetry Study. J Alzheimers Dis. 2015;48(1):197-204.
4. Cho H, et al. Abnormal integrity of corticocortical tracts in mild cognitive impairment: a diffusion tensor imaging study. J Korean Med Sci. 2008;23(3):477-83.
5. Desikan RS, Killiany RJ, et al. An automated labeling system for subdividing the human cerebral cortex on MRI scans into gyral based regions of interest. Neuroimage. 2006;31(3):968-80.
6. Bullmore E, Sporns O. Complex brain networks: graph theoretical analysis of structural and functional systems. Nat Rev Neurosci. 2009 Mar;10(3):186-98.
7. Achard S, Bullmore E. Efficiency and cost of economical brain functional networks. PLoS Comput Biol. 2007;3(2):e17.
8. Alexander-Bloch AF, et al. On testing for spatial correspondence between maps of human brain structure and function. Neuroimage. 2018;178:540-551.
Figures