2385
Effective Connectivity within the Resting-State Network using Spectral Dynamic Causal Modeling1Department of Medical physics and Biomedical Engineering, Tehran university of medical sciences, TEHRAN, Iran (Islamic Republic of), 2Medical Physics Department, Iran University of Medical Sciences, TEHRAN, Iran (Islamic Republic of), 3Quantitative MR Imaging and Spectroscopy Group, Research Center for Molecular and Cellular Imaging, Tehran University of Medical Sciences, TEHRAN, Iran (Islamic Republic of), 4Quantitative MR Imaging and Spectroscopy Group, Research Center for Molecular and Cellular Imaging, Tehran University of Medical Sciences, Tehran, Iran (Islamic Republic of), 5Department of Psychiatry, Tehran university of medical sciences, TEHRAN, Iran (Islamic Republic of)
Synopsis
Alzheimer's disease (AD) is a network connection dysfunction syndrome. An approximate picture of functional integration and statistical dependence on responses between different regions of the brain can be defined by functional connectivity (FC). Explanation of the statistical dependencies and estimating how the dynamics of neurons affect each other remotely is done by effective connectivity (EC). Studying directional interactions between different regions of the brain plays a key role in our understanding of the functional integration of brain networks.
INTRODUCTION:
Alzheimer's disease (AD) is one of the most common neurodegenerative diseases in the world (1) Early diagnosis is important to maximize treatment benefits and prevention strategies. It is important to better identify specific brain abnormalities in AD, especially in the early stages, known as mild cognitive impairment (MCI) (2). Experimental and neuroimaging founding shows that AD may be associated with the accumulation of neuropathological markers, such as extracellular amyloid plaques and intracellular neurofibrillary tangles (7) that can affect the direction of the signal path (3). The activity of resting-state neural networks is detected by spontaneous low-frequency fluctuations of the BOLD signal (4). Studies show that areas of the brain that their signal fluctuations are correlated are functionally connected (5). Most studies describe the connectivity between resting-state networks based on functional connectivity (FC) (6). However, interactions between brain regions are directional and therefore not fully defined by functional (directionless) connectivity. Effective connectivity (EC) can detect the direction and intensity of information flow in different regions of the brain and provide a better understanding of patterns of interaction between different regions of the brain (7). Spectral DCM is an efficient biological model that can explain and predict BOLD signals caused by endogenous neural oscillations (8). Spectral DCM is used to model the intrinsic dynamics of a resting-state network. This DCM estimates the EC between coupled populations of neurons (9).METHODS:
Subjects: 16 MCI, 14 AD, and 14 healthy subjects were selected through neuropsychological assessment by Yaadmaan Institute for Brain, Cognition & Memory Studies (Tehran, Iran) (Table. 1).Table. 1 Clinical and demographic data
| | NORMAL | MCI | AD |
| Age | 71.5 | 72.4 | 77.8 |
| Male/Female( number) | 6/8 | 6/10 | 5/9 |
| Mean MMSE | 28.66 | 25 | 18.1 |
MRI protocol: 3D-T1-MPRAGE and rs-fMRI were performed on participants using a 3.0 T Prisma MRI scanner (Siemens Healthcare, Germany) at the National Brain Mapping Laboratory (Tehran, Iran). The rs-fMRI parameters of the sequence (Echo-Planar Imaging) were as follow: TR: 3000 ms, TE: 30 ms, flip angle: 90 degrees, voxel size: 2.8×2.8×3 mm, slice thickness: 3 mm, FOV read: 220 mm.
Image processing: MNI normalization, Tissue segmentation to gray matter, white matter, and CSF for 3D-T1-MPRAGE data and Realignment, Co-registration, Slice timing correction, Segmentation, MNI normalization, and Functional smoothing for rs-fMRI was performed using SPM software (9). Time series of white matter and CSF and confounding factors of movement extracted and removed and a band-pass filter (0.01-0. 1 Hz) applied to focus on the rs-fMRI BOLD signal. Time series of pre-defined nodes from resting-state networks extracted and cross-spectral DCM (Full model with no exogenous inputs and non-stochastic effect) were constructed and inverted for each subject. In estimated spDCM, the Jacobian matrix describes the behavior -i.e the effective connectivity- of each resting-state network. The mean and standard deviation of the Jacobian matrix of all subjects in all three groups was calculated and the results were compared.
We performed EC analysis on 32 ROI from 8 resting-state networks: Default Mode Network (DMN), Sensorimotor Network, Visual Network, Salience Network, Dorsal attention Network (DAN), Frontoparietal Network (FPN), Language Network, and Cerebellar Network.
RESULTS:
We found a significant difference in the map of directional connectivity in brain networks between the 3 groups. These differences were significantly correlated with cognitive and clinical assessment. Fig (1-5).DISCUSSION:
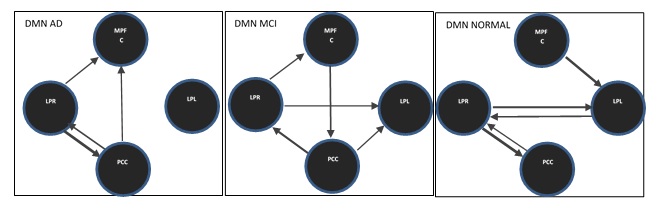
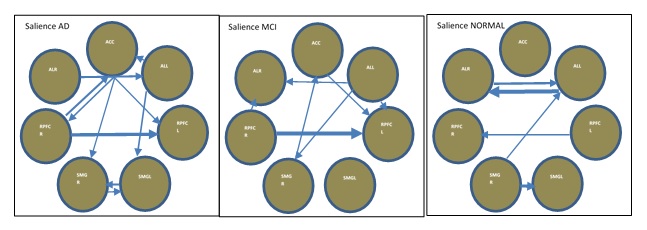
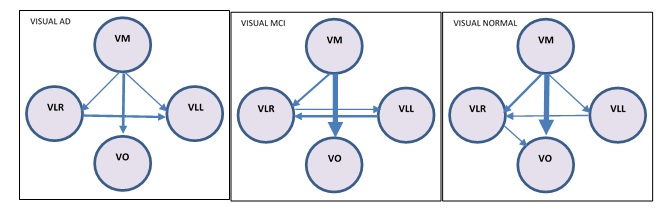
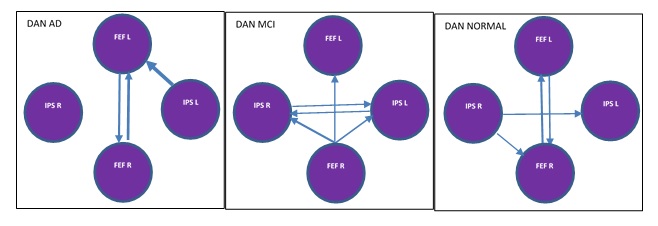
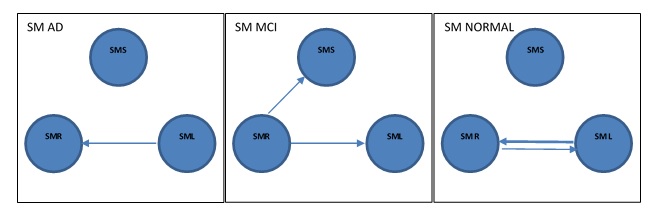
In DMN, the presence or absence of LPL to LPR EC can be an indicator of normal and AD subjects respectively. Stronger connectivity from MPFC to PCC and PCC to LPL can be an indicator of MCI subjects. In DAN, EC from IPSR to FEFR and EC from IPSR to IPSL can represent as a biomarker for the normal subject, and given that, IPSR is an important node in DAN. In DAN EC from FEFR to FEFL in all groups preserved, it seems that FEFR and FEFL have a driving role in DAN. AD patients due to disruption in DAN have problems in unexpected places and are poor in orientation and executive tasks (10). In the progression of AD, changes in functions such as olfactory, auditory, visual, and motor systems may accrue before the onset of cognitive decline due to neocortical deposition in the sensorimotor network (11) and strong connection from SML to SMR in normal subjects that do not exist in the MCI can be an indicator of health. AD patients usually show impairments in visual networks (12), In 3 groups EC from VM to VO is maintained with good strength and it seems that these connections have an important role in the integrity of the visual network. language disorders in AD patients are associated with atrophy or hypometabolism in temporal regions and the left inferior frontal gyrus (13). Our result showed the complexity of language and the salience network in AD groups.CONLUSION:
The result of our founding showed alternation in EC and strength of connection in resting network networks that can be used as a biomarker to differentiate between these three groups.Acknowledgements
This research has been supported by Tehran University of Medical Sciences & health Services grant 99-3-101-45445.
References
1. McKenna F, Koo B-B, Killiany R. Comparison of ApoE-related brain connectivity differences in early MCI and normal aging populations: an fMRI study. Brain imaging and behavior. 2016;10(4):970-83.
2. Ma X, Zhuo Z, Wei L, Ma Z, Li Z, Li H, et al. Altered temporal organization of brief spontaneous brain activities in patients with Alzheimer’s disease. Neuroscience. 2020;425:1-11.
3. Scherr M, Utz L, Tahmasian M, Pasquini L, Grothe MJ, Rauschecker JP, et al. Effective connectivity in the default mode network is distinctively disrupted in Alzheimer's disease—A simultaneous resting‐state FDG‐PET/fMRI study. Human brain mapping. 2021;42(13):4134-43.
4. Khan TK. An algorithm for preclinical diagnosis of Alzheimer's disease. Frontiers in neuroscience. 2018;12:275.
5. Friston KJ. Functional and effective connectivity: a review. Brain connectivity. 2011;1(1):13-36.
6. Zhao J, Du Y-H, Ding X-T, Wang X-H, Men G-Z. Alteration of functional connectivity in patients with Alzheimer’s disease revealed by resting-state functional magnetic resonance imaging. Neural regeneration research. 2020;15(2):285.
7. Xue J, Guo H, Gao Y, Wang X, Cui H, Chen Z, et al. Altered directed functional connectivity of the hippocampus in mild cognitive impairment and Alzheimer’s disease: a resting-state fMRI study. Frontiers in aging neuroscience. 2019;11:326.
8. Zarghami TS, Friston KJ. Dynamic effective connectivity. Neuroimage. 2020;207:116453.
9. Ashburner J, Barnes G, Chen C-C, Daunizeau J, Flandin G, Friston K, et al. SPM12 manual. Wellcome Trust Centre for Neuroimaging, London, UK. 2014;2464.
10. Zhang Z, Zheng H, Liang K, Wang H, Kong S, Hu J, et al. Functional degeneration in dorsal and ventral attention systems in amnestic mild cognitive impairment and Alzheimer’s disease: an fMRI study. Neuroscience letters. 2015;585:160-5.
11. Soman SM, Raghavan S, Rajesh P, Mohanan N, Thomas B, Kesavadas C, et al. Does resting state functional connectivity differ between mild cognitive impairment and early Alzheimer's dementia? Journal of the Neurological Sciences. 2020;418:117093.
12. Zhong C, Bai L, Dai R, Xue T, Wang H, Feng Y, et al. Modulatory effects of acupuncture on resting‐state networks: a functional MRI study combining independent component analysis and multivariate granger causality analysis. Journal of Magnetic Resonance Imaging. 2012;35(3):572-81.
13. Pistono A, Senoussi M, Guerrier L, Rafiq M, Gimeno M, Péran P, et al. Language Network Connectivity Increases in Early Alzheimer’s Disease. Journal of Alzheimer's Disease. 2021(Preprint):1-14.
Figures