2384
Altered functional connectivity in Parkinson’s disease with psychosis1Symbiosis Centre for Medical Image Analysis, Symbiosis International University, Pune, India, 2Department of Neurology, National Institute of Mental Health & Neurosciences, Bangalore, India, 3Department of Clinical Neuroscience, National Institute of Mental Health & Neurosciences, Bangalore, India, 4Department of Neuroimaging & Interventional Radiology, National Institute of Mental Health & Neurosciences, Bangalore, India
Synopsis
Visual hallucinations (VH) is a commonly occurring psychosis symptom in Parkinson’s disease (PD). However, neuropathology of VH in PD is not clearly known, thereby limiting the efficacy of therapeutic strategies. To mitigate this gap, we evaluated functional connectivity (FC) changes and network organisation, related to VH in PD. PD patients exhibited widespread reduction in interhemispheric FC and local network topology of temporal, frontal, parietal, striatal, limbic, cerebellar, occipital and sensory motor regions. Patients with psychosis displayed larger FC reductions, particularly in cerebellar regions and their connections with frontal and occipital regions. Topological changes in temporal regions seen across PD patients
Introduction
Psychosis is a debilitating and frequently occurring non-motor symptom in Parkinson’s disease (PD), commonly manifesting as visual hallucination (VH) [1,2]. However, pathophysiological mechanism of VH in PD is not clearly established. This lack of information makes effective treatment planning quite challenging [1]. Existing fMRI studies investigating VH related functional changes in PD, have mainly performed task-based analysis [3,4] or region-specific analysis [5,6,7], and thus lack a comprehensive whole brain resting state functional connectivity (rsFC) analysis. To mitigate this gap, we evaluated whole brain rsFC changes and topological network alterations associated with VH in PD.Methods
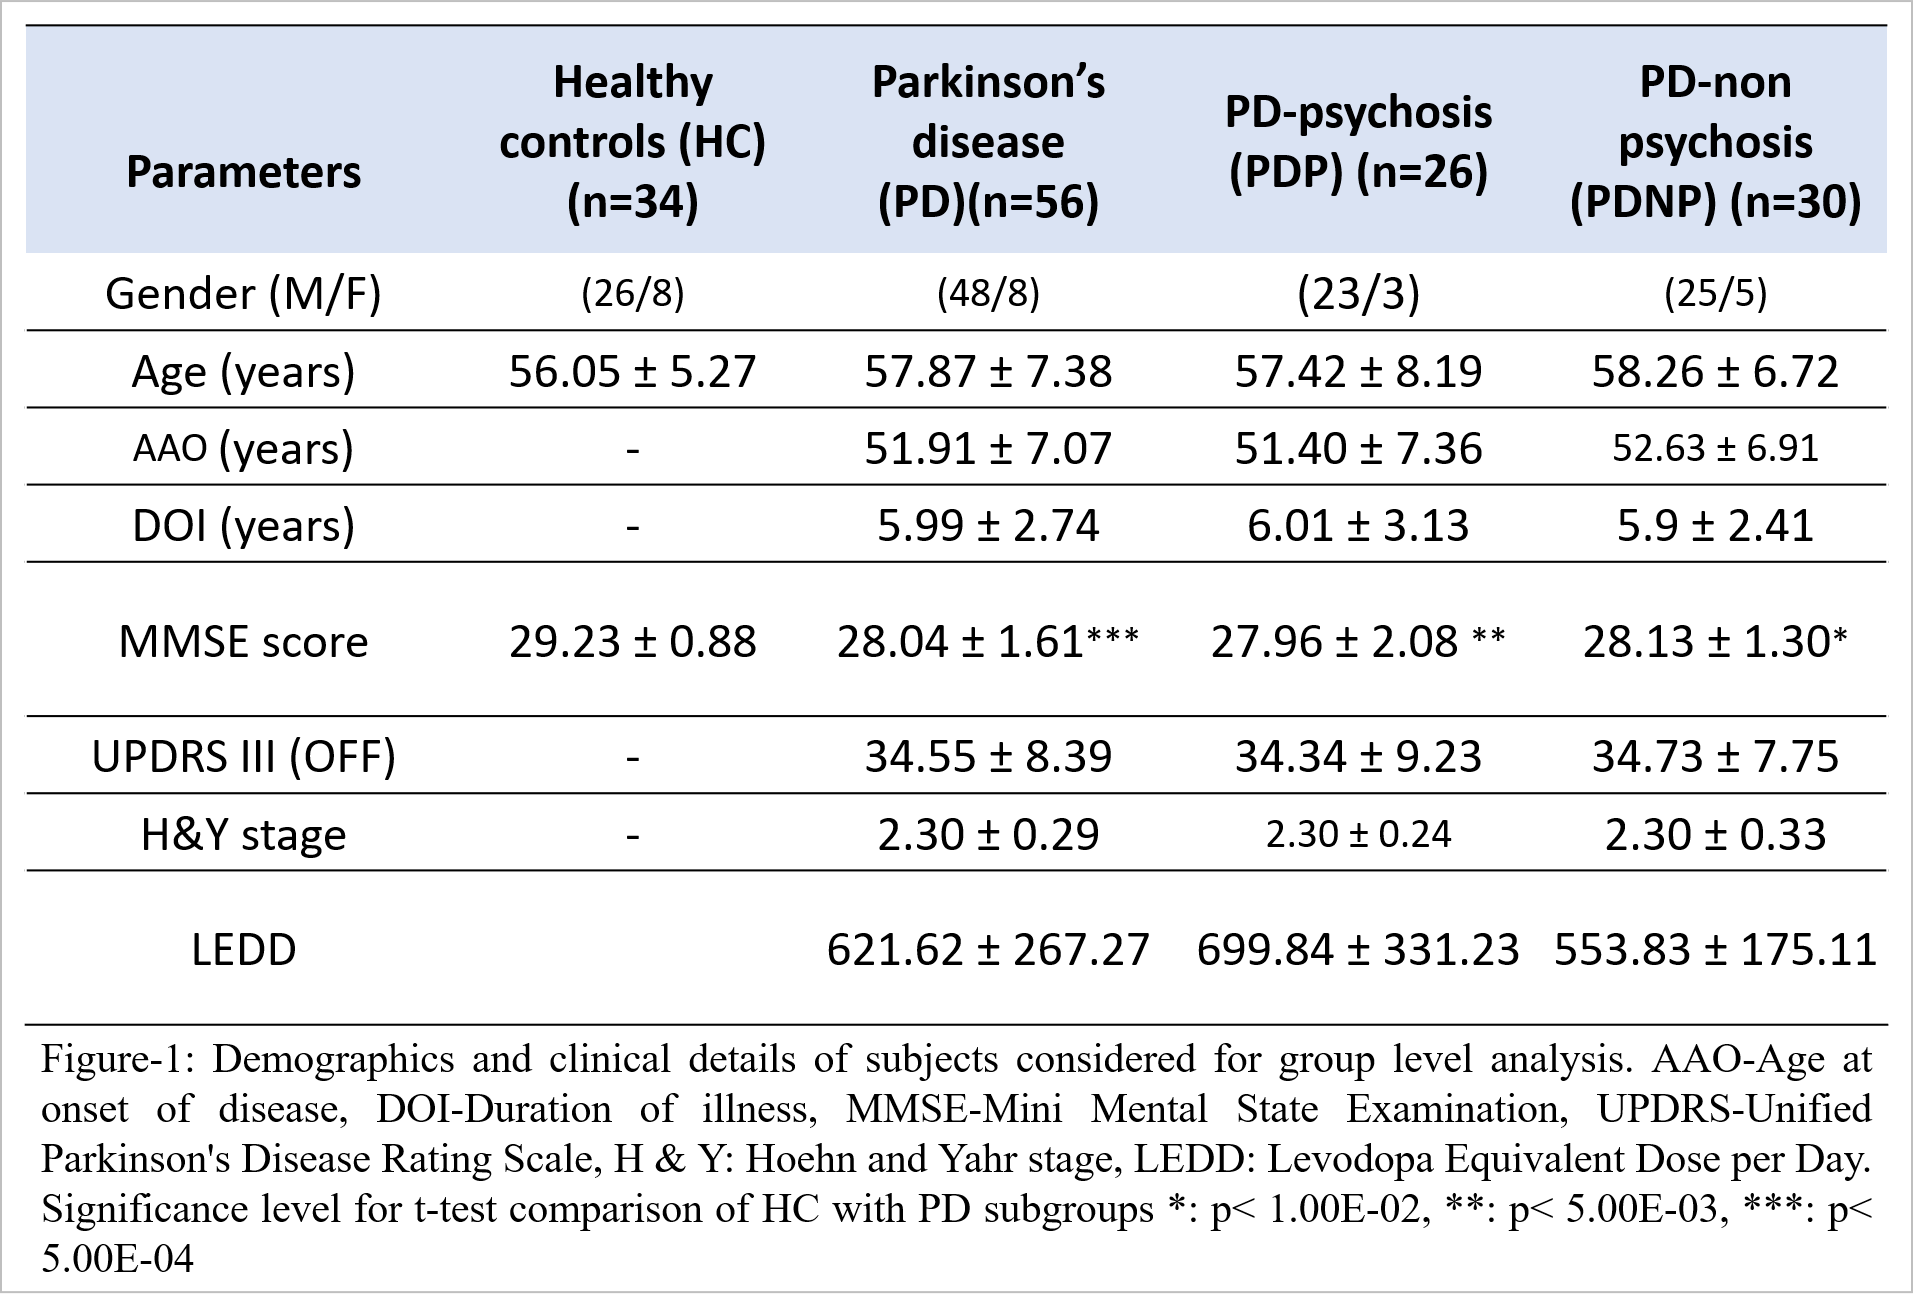
Fifty-six PD patients (PD-non-psychosis (PDNP) n=30; PD-psychosis with VH (PDP) n=26) and 34 Healthy Controls (HC) were recruited at NIMHANS hospital Bangalore. Demographics of all subjects and clinical details of patients is reported in Figure-1. Subjects were scanned on 3T Philips Achieva MRI scanner using 32-channel head coil. T1-weighted images were acquired with TR/TE=8.06ms/3.6ms, voxel-size=1x1x1mm, FOV=256x256x160mm and flip angle=8°. Resting state fMRI images were acquired using echo planar imaging (EPI) sequence with TR/TE=2000ms/35ms, voxel size=1.64x1.64x3mm and no. of volumes=140. Pre-processing of fMRI data was performed using (DPARSFA) toolbox [8] which included despiking, realignment, normalization to standard space EPI template (2mm), linear detrending, regression of nuisance covariates using WM, CSF,12 motion parameters, band pass filtering-0.01 Hz to 0.1 Hz range, smoothening with 5mm FWHM kernel. Subjects containing mean FD>0.5 and more than 30% data showing FD>0.5mm were excluded. Resting state functional connectivity (FC) was computed using AAL atlas with 116 regions of interest (ROI). FC was computed by calculating pairwise Pearson’s correlation between mean timeseries of all voxels in a ROI with mean timeseries of voxels in every other ROI of the atlas. FC was normalized using Fisher’s r to z transform. Network based statistics (NBS), a non-parametric statistical method that identifies topologically connected network components (t=3.4) was implemented by performing 10000 permutations and FWER corrected p-value threshold of 0.05, to obtain significant differences in network components of HC and PD groups. Graph theoretical analysis was performed using sparsity (S) based thresholding over the range 0.10 ≤ S ≤ 0.40 at an interval of 0.01, to compute global (global efficiency (GE), characteristic path length (CPL), assortativity and transitivity) and local networks measures (clustering coefficient (CC), betweenness centrality (BC), degree and local efficiency (LE)). An area under the curve (AUC) was calculated for each measure and two-sample t-test was applied on the AUC, using age as a covariate and FDR correction of p<0.05 for multiple comparison correction. Partial correlation was performed to assess relation between all network measures and clinical scores, with age as a covariate, at p<0.001 significance.Results
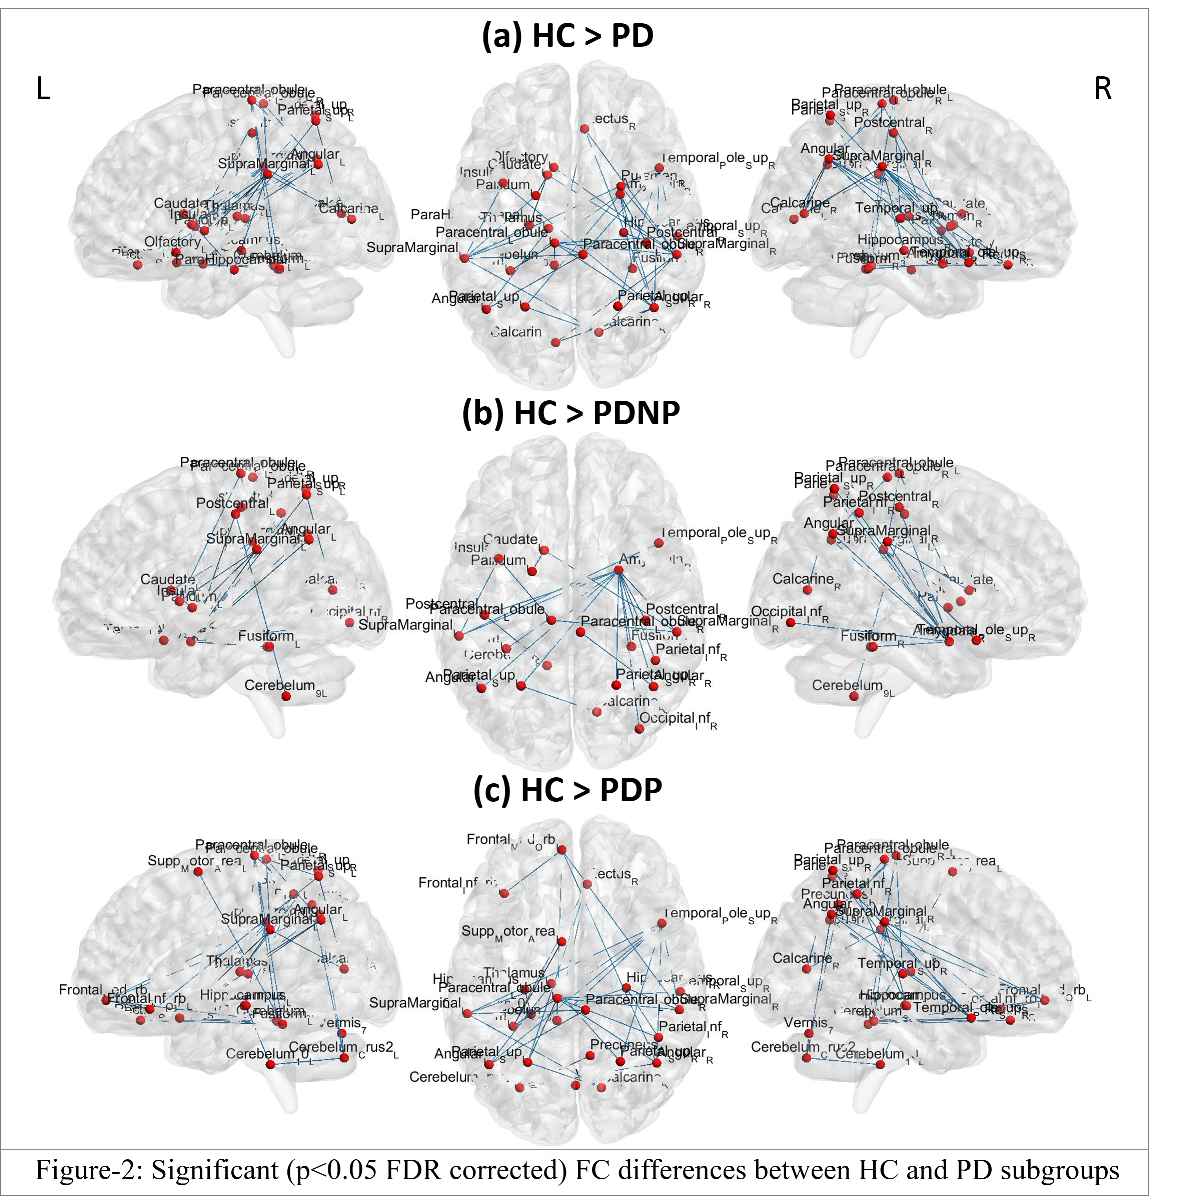
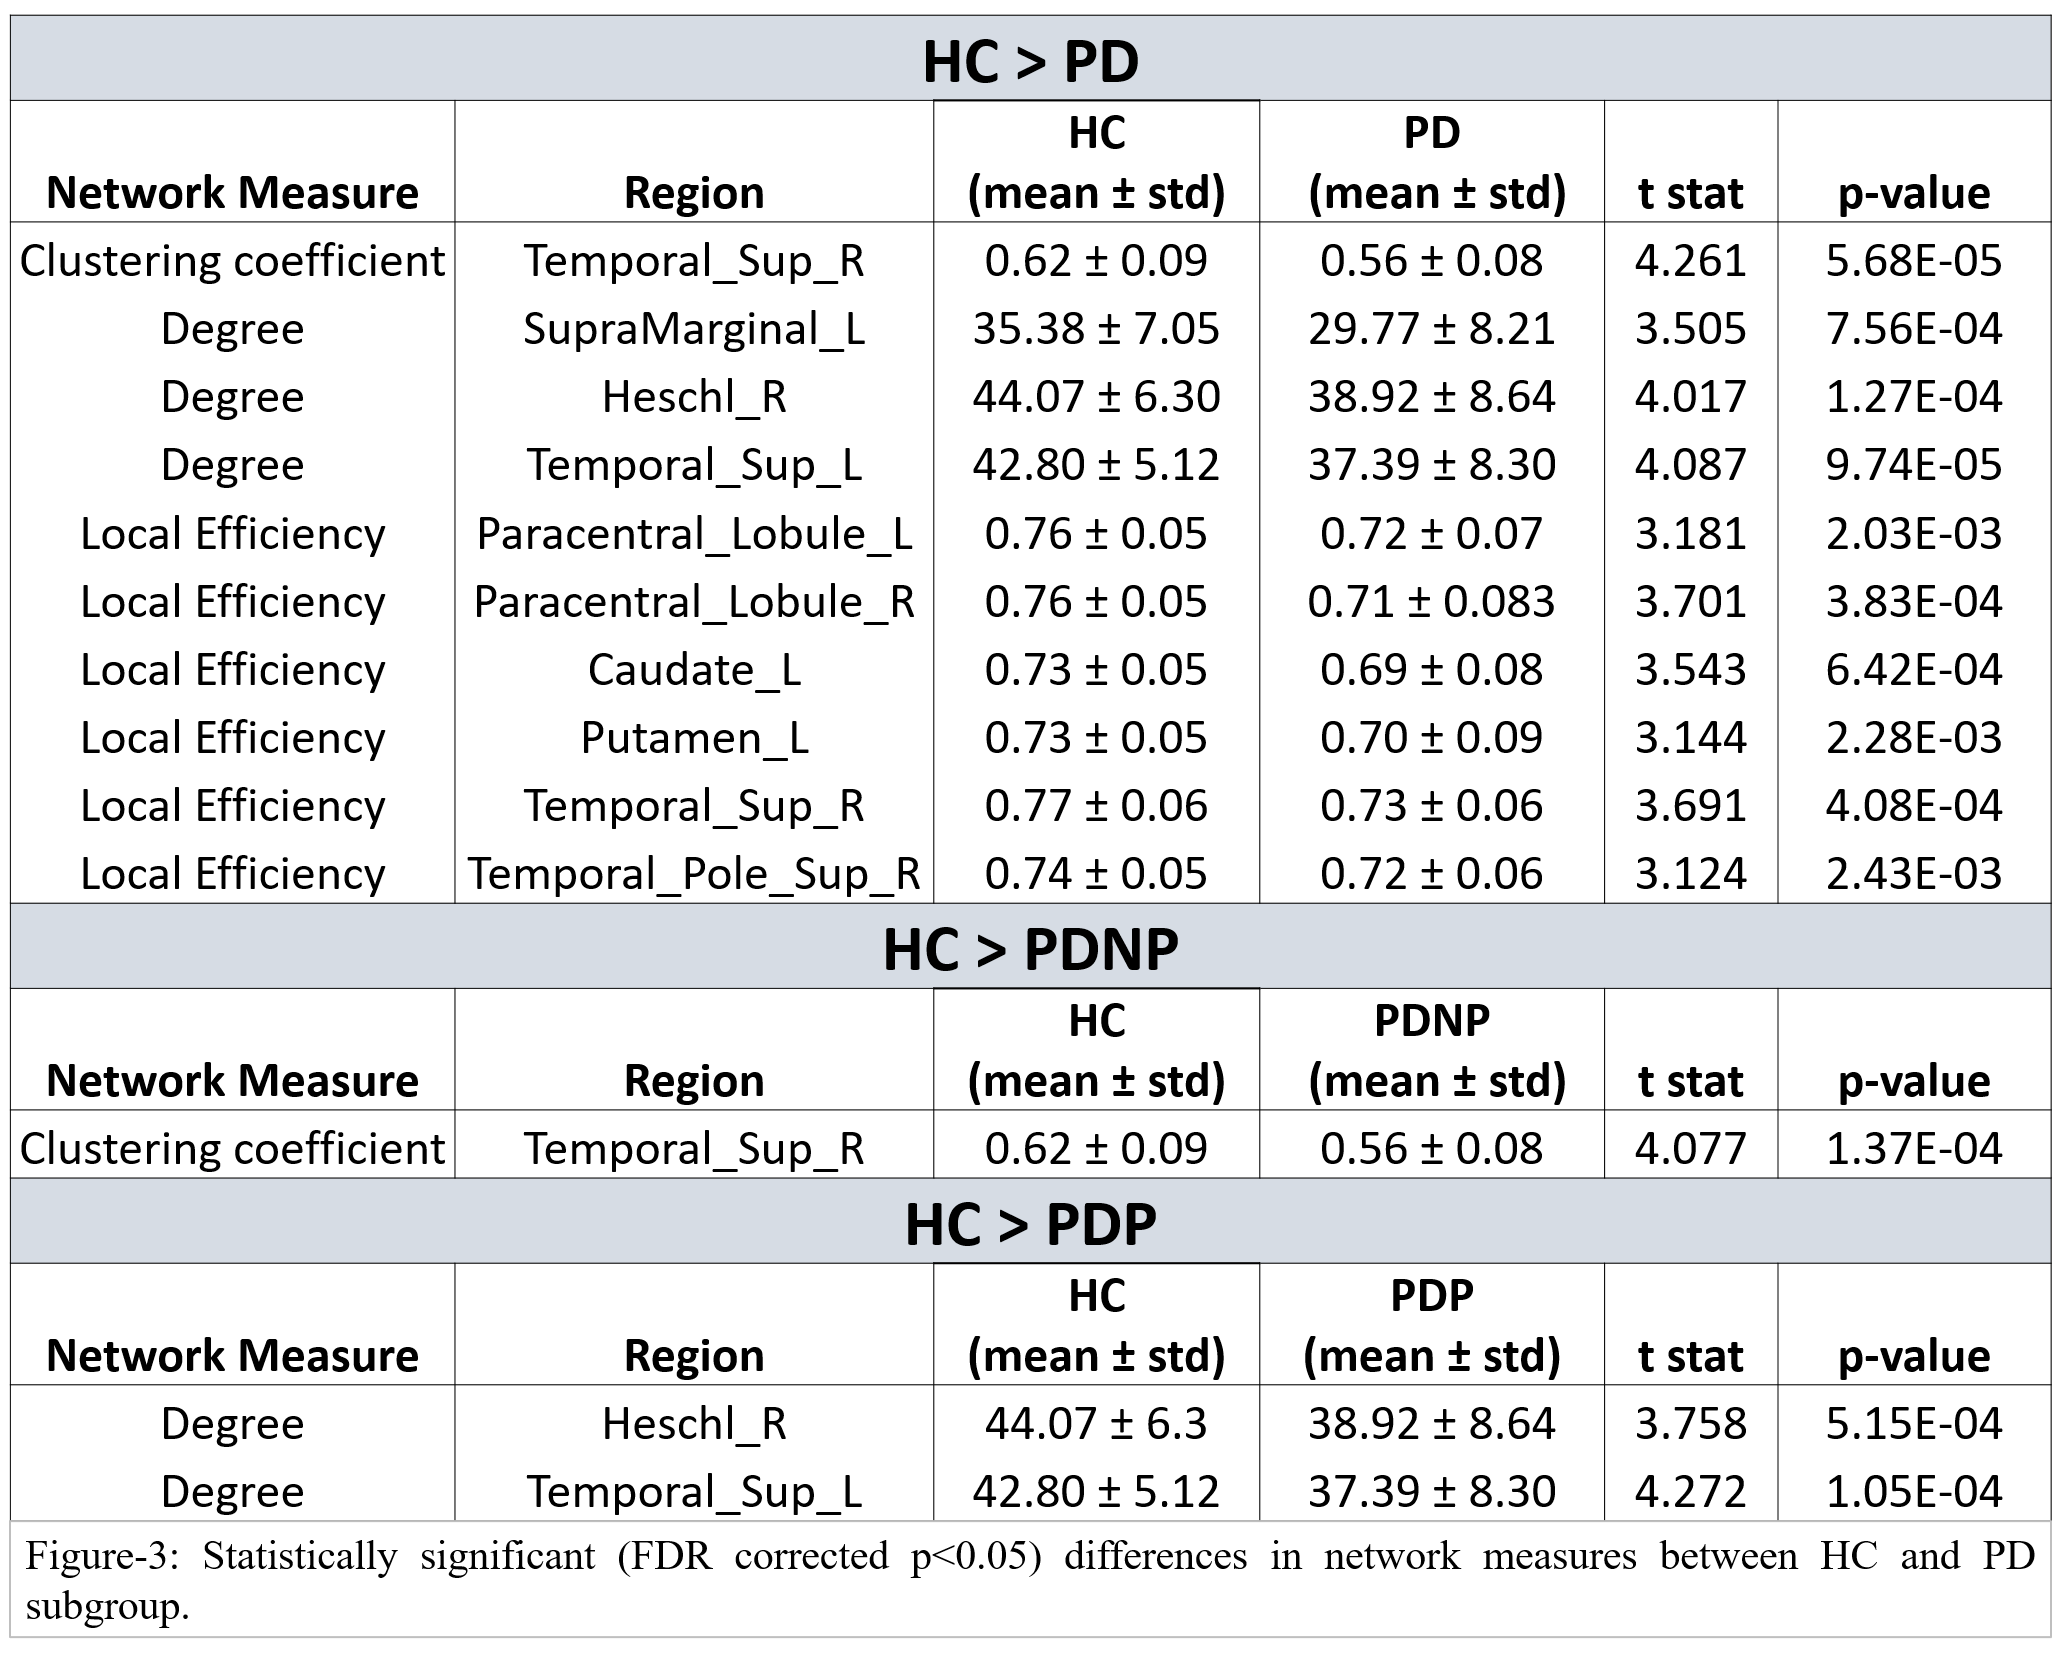
NBS analysis revealed significant large-scale FC reduction between PD groups and HC as shown in Figure-2, with 39 edges(e) and 26 nodes(n) that were significantly different between whole PD and HC groups. PD patients exhibited reduced interhemispheric FC in limbic, temporal, parietal, striatal, cerebellar, occipital and sensory motor network (SMN) regions, as compared to the HC group. PDP group (e=37, n=25) demonstrated larger FC reductions than PDNP group (e=n=21), in comparison with HC. Both PD groups showed decreased FC in SMN, limbic, parietal, occipital and temporal regions. Striatal FC reductions were seen in PDNP group, whereas reduced connections within cerebellum and with occipital and frontal regions were displayed by PDP group. No significant differences were found between PDP and PDNP patients. Local network measures such as degree and LE were significantly lower in whole PD group compared to HC as shown in Figure-3. PD group demonstrated lower LE in SMN, temporal and striatal regions. Temporal regions also showed lower degree and clustering in whole PD as well as PD subgroups. No significant differences were obtained in nodal network measures between PDP and PDNP groups and in global network measures between any of the groups.Conclusion
PD patients demonstrated widespread reduction in FC and local topology of SMN, parietal, temporal, occipital, cerebellar and striatal regions. PD patients with psychosis displayed larger FC reduction, distinctly within cerebellar regions and their connections with occipital and frontal regions. Altered network topology of temporal regions was seen across all PD groups.Acknowledgements
We would like to acknowledge the grants from Indian Council of Medical Research (ICMR)[ICMR/003/304/2013/00694] which facilitated the dataset and computational resources for this study.References
1. Aarsland, D., Larsen, J. P., Tandberg, E., & Laake, K. (2000). Predictors of nursing home placement in Parkinson's disease: a population‐based, prospective study. Journal of the American Geriatrics Society, 48(8), 938-942.
2. Fénelon, G., & Alves, G. (2010). Epidemiology of psychosis in Parkinson's disease. Journal of the neurological sciences, 289(1-2), 12-17.
3. Stebbins, G. T., Goetz, C. G., Carrillo, M. C., Bangen, K. J., Turner, D. A., Glover, G. H., & Gabrieli, J. D. (2004). Altered cortical visual processing in PD with hallucinations: an fMRI study. Neurology, 63(8), 1409–1416.
4. Ramírez-Ruiz, B., Martí, M. J., Tolosa, E., Falcón, C., Bargalló, N., Valldeoriola, F., & Junqué, C. (2008). Brain response to complex visual stimuli in Parkinson's patients with hallucinations: a functional magnetic resonance imaging study. Movement disorders : official journal of the Movement Disorder Society, 23(16), 2335–2343.
5. Yao, N., Cheung, C., Pang, S., Shek-kwan Chang, R., Lau, K. K., Suckling, J., Yu, K., Ka-Fung Mak, H., Chua, S. E., Ho, S. L., & McAlonan, G. M. (2016). Multimodal MRI of the hippocampus in Parkinson's disease with visual hallucinations. Brain structure & function, 221(1), 287–300.
6. Yao, N., Pang, S., Cheung, C., Chang, R. S., Lau, K. K., Suckling, J., Yu, K., Mak, H. K., McAlonan, G., Ho, S. L., & Chua, S. E. (2015). Resting activity in visual and corticostriatal pathways in Parkinson's disease with hallucinations. Parkinsonism & related disorders, 21(2), 131–137.
7. Yao, N., Shek-Kwan Chang, R., Cheung, C., Pang, S., Lau, K. K., Suckling, J., Rowe, J. B., Yu, K., Ka-Fung Mak, H., Chua, S. E., Ho, S. L., & McAlonan, G. M. (2014). The default mode network is disrupted in Parkinson's disease with visual hallucinations. Human brain mapping, 35(11), 5658–5666.
8. Yan, C., & Zang, Y. (2010). DPARSF: a MATLAB toolbox for" pipeline" data analysis of resting-state fMRI. Frontiers in systems neuroscience, 4, 13.
Figures