2379
Free-Water Corrected Diffusion MRI Measures Reveal White Matter Disorganization in Parkinson’s Disease Patients with Memory Impairment.1Imaging, Cleveland Clinic Lou Ruvo Center for Brain Health, Las Vegas, NV, United States, 2Neuropsychology, Cleveland Clinic Lou Ruvo Center for Brain Health, Las Vegas, NV, United States, 3Neurology, Cleveland Clinic Lou Ruvo Center for Brain Health, Las Vegas, NV, United States
Synopsis
Diffusion MRI (dMRI) could be used to understand cognitive impairment in Parkinson’s disease (PD). However, single-tensor (ST)-derived fractional anisotropy (FA) measures are biased due to the presence of crossing-fibers and contamination from cerebrospinal fluid (CSF). CSF contamination can be corrected by fitting a bi-tensor model to estimate free water (FW) contamination. Hence, in this study, we compared FW and FW-corrected ST dMRI-derived measures between PD patients (with and without cognitive impairment) and healthy controls (HC) estimated with multishell dMRI data. Our analysis suggests that FW-corrected dMRI analyses are more powerful in understanding WM disorganization in PD patients with cognitive impairment.
Introduction
Almost 80% of Parkinson’s disease (PD) patients progress to dementia (PDD) within twelve years of diagnosis1. Previous studies have suggested that mild cognitive impairment (MCI) in PD (PD-MCI) increases the risk of PDD2–4. A recent study by Jones et al.5, however, suggests that PD-MCI who revert to normal cognition (PD-NC) are also at a greater risk of developing PDD. This discrepancy may be because the diagnosis of PD-MCI is complex and fluctuates over time6. White matter (WM) changes captured using diffusion MRI (dMRI) are shown to be sensitive in PD, especially to capture early disease-related neurodegeneration7. Single-tensor (ST) dMRI-derived measures have also been shown to be affected with cognition in PD7–10 with WM fiber tracts of genu and splenium of corpus callosum (CC), cingulate bundle, and prefrontal and temporal WM tracts shown to have reduced FA9,11. However, ST-derived fractional anisotropy (FA) measures that are estimated in routine clinical investigations are biased not only due to the presence of crossing-fibers12 but also due to the contamination from cerebrospinal fluid (CSF)13. Such CSF-contamination can be corrected by fitting a bi-tensor model14,15 to correct for free water (FW) contamination. Hence, in this study, we compared FW and FW-corrected ST dMRI-derived measures between PD-NC, PD-MCI, and healthy controls (HC) estimated with high spatial and angular resolution dMRI data. We also tested for correlations of both FW and FW-corrected ST dMRI-derived measures with clinical measures in our cohort. We hypothesized that FW corrected dMRI-derived measures may be more sensitive to capture changes in WM disorganization and their correlation with clinical measures as compared to conventional ST dMRI-derived measuresMethods
Participants: Twenty-nine PD participants and 49 HC (26 Females; Age: 70.35±6.33years; Years of Education (YOE): 16.37±2.42years) were recruited at the Center for Neurodegeneration and Translational Neuroscience, Cleveland Clinic Lou Ruvo Center for Brain Health. 14 PD participants were identified as PD-MCI (3 Females; Age: 67.64±6.6years; YOE: 15.43±2.6years) and 15 PD participants were identified as PD-NC (5 Females; Age: 68.07±6.99years; YOE: 15.33±2.19years) according to a consensus diagnosis made by a neurologist and a neuropsychologist based on results of a comprehensive neuropsychological test battery following the Litvan criteria16. dMRI acquisition: dMRI was acquired for all participants on a 3T Siemens Skyra using the following protocol: 213 diffusion encoding directions (DEC) and 25 non-diffusion weighted (b0) images interspersed between the DEC, Multiband factor=3, GRAPPA=2, TR=5218ms, TE=100ms, resolution=1.5mm3, 3 b-values: 500s/mm2, 1000s/mm2, and 2500s/mm2, and phase-encoding directions of P>>A; opposite phase-encoding (A>>P) b0 image. Acquisition time: 23:13 minutes. Preprocessing: All data were corrected for eddy-current distortion using eddy17 tools from FSL and head motion was computed across the session for each participant. Processing: (i) ST dMRI-derived measures were estimated using dtifit tool of FSL and (ii) FW and FW-corrected ST dMRI measures were obtained using DiPY implementation of multi-shell dMRI acquisition18. Of note, since FA and its derivatives are only reliable at b<=1000s/mm2, estimation of ST FA and FW-corrected FA was only done using b-values<=1000s/mm2. Statistical Analysis: PALM toolbox19 in FSL was used to extract significantly different or correlated ST or FW-corrected dMRI-derived measures with clinical variables. Significance was established at pcorr<0.05, and was family-wise error correction was performed across various measures for every technique utilized in PALM. Of note, age, education, sex, years of education, head motion, and intracranial volume were utilized as covariates of no interest in statistical analysis.Results
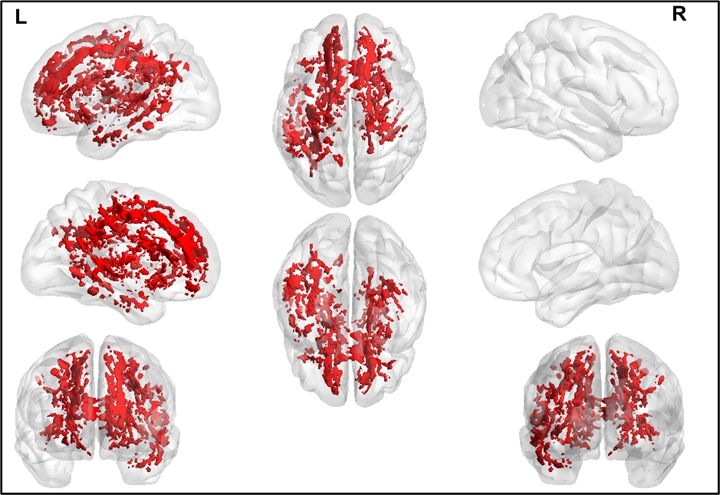
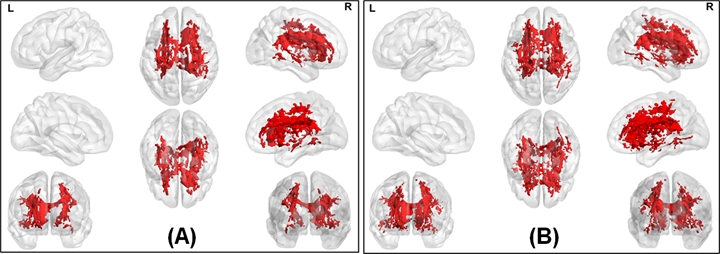
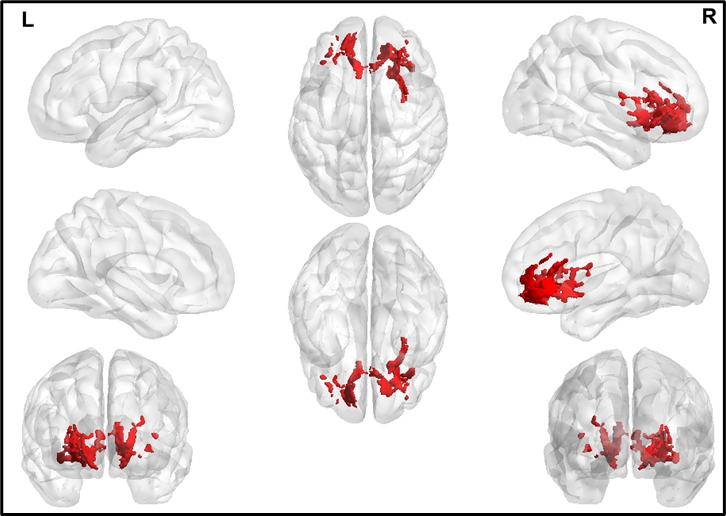
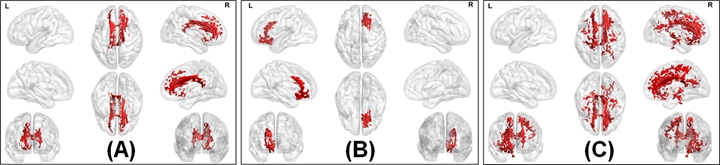
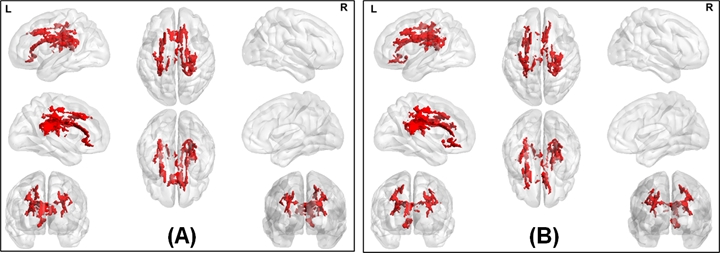
The average head motion across for each group was less than 1mm, and there was no statistically significant difference between any of the demographical variables. None of the ST dMRI-derived measures were different between any group. However, FW-corrected FA was significantly greater in HC when compared to PD-NC (Fig.1) encompassing tracts of CC, corticospinal tract (CST), and left inferior longitudinal fasciculus (ILF). Both ST dMRI-derived axial diffusivity (AxD) and FW-corrected AxD encompassing CC and CST were positively correlated with freezing of gait questionnaire (FOGQ) in the PD-MCI group (Fig.2). Only FW-corrected FA had a positive correlation with MDS-UPDRS Part-III scores in PD-MCI (Fig.3) encompassing genu of the CC. Levodopa equivalent dose (LEDD) showed a positive correlation with FW-corrected FA in both PD-MCI and PD-NC groups (Fig.4) predominantly encompassing CC. FW-corrected AxD was negatively correlated with LEDD in PD-MCI encompassing CC (Fig.5).Discussion and Conclusion
Our analyses reveal a paradoxical positive correlation between FW-corrected FA measures and UPDRS along with a paradoxical negative correlation of FW-corrected AxD with LEDD suggesting axonal death in CC of PD-MCI. Our analysis suggests that FW-corrected dMRI analyses are more powerful in understanding WM disorganization in PD patients with cognitive impairment. Analysis of correlation of ST and FW-corrected ST dMRI-derived measures with neuropsychological scores will reveal specific neuroanatomical correlates of WM disorganization in PD patients with cognitive impairment. Furthermore advanced dMRI metrics such as those evaluated using diffusion kurtosis imaging (DKI)20 and neurite orientation dispersion and density imaging (NODDI)21 might be better able to characterize if the observed changes in ST dMRI-derived measures are due to less prevalence of crossing-fibers that might be responsible for paradoxical positive correlation of dMRI-derived measures and clinical variables.Acknowledgements
This study is supported by the National Institutes of Health (grant R01NS117547, P20GM109025, R01NS118760, and R01NS118760-S1) and the Keep Memory Alive-Young Investigator Award (Keep Memory Alive Foundation).References
1. Lanskey JH, McColgan P, Schrag AE, et al. Can neuroimaging predict dementia in Parkinson’s disease? Brain. 2018;141:2545–2560.
2. Goldman JG, Vernaleo BA, Camicioli R, et al. Cognitive impairment in Parkinson’s disease: a report from a multidisciplinary symposium on unmet needs and future directions to maintain cognitive health. npj Park Dis. 2018;4:19.
3. Broeders M, Velseboer DC, de Bie R, et al. Cognitive change in newly-diagnosed patients with Parkinson’s disease: a 5-year follow-up study. J Int Neuropsychol Soc. England; 2013;19:695–708.
4. Hoogland J, Boel JA, de Bie RMA, et al. Mild cognitive impairment as a risk factor for Parkinson’s disease dementia. Mov Disord. United States; 2017;32:1056–1065.
5. Jones JD, Kuhn TP, Szymkowicz SM. Reverters from PD-MCI to cognitively intact are at risk for future cognitive impairment: Analysis of the PPMI cohort. Parkinsonism Relat Disord. 2017/12/09. 2018;47:3–7. 6. Lawson RA, Yarnall AJ, Duncan GW, et al. Stability of mild cognitive impairment in newly diagnosed Parkinson’s disease. J Neurol Neurosurg Psychiatry. 2017;88:648 LP – 652.
7. Burke RE, O’Malley K. Axon degeneration in Parkinson’s disease. Exp Neurol. United States; 2013;246:72–83.
8. Melzer TR, Watts R, MacAskill MR, et al. White matter microstructure deteriorates across cognitive stages in Parkinson disease. Neurology. United States; 2013;80:1841–1849.
9. Kamagata K, Motoi Y, Tomiyama H, et al. Relationship between cognitive impairment and white-matter alteration in Parkinson’s disease with dementia: tract-based spatial statistics and tract-specific analysis. Eur Radiol. Germany; 2013;23:1946–1955.
10. Agosta F, Canu E, Stefanova E, et al. Mild cognitive impairment in Parkinson’s disease is associated with a distributed pattern of brain white matter damage. Hum Brain Mapp. United States; 2014;35:1921–1929.
11. Deng B, Zhang Y, Wang L, et al. Diffusion tensor imaging reveals white matter changes associated with cognitive status in patients with Parkinson’s disease. Am J Alzheimers Dis Other Demen. United States; 2013;28:154–164.
12. Jeurissen B, Leemans A, Tournier J-D, Jones DK, Sijbers J. Investigating the prevalence of complex fiber configurations in white matter tissue with diffusion magnetic resonance imaging. Hum Brain Mapp. United States; 2013;34:2747–2766.
13. Papadakis NG, Martin KM, Mustafa MH, et al. Study of the effect of CSF suppression on white matter diffusion anisotropy mapping of healthy human brain. Magn Reson Med. United States; 2002;48:394–398.
14. Pasternak O, Sochen N, Gur Y, Intrator N, Assaf Y. Free water elimination and mapping from diffusion MRI. Magn Reson Med. United States; 2009;62:717–730. 15. Mishra V, Guo X, Delgado MR, Huang H. Toward tract-specific fractional anisotropy (TSFA) at crossing-fiber regions with clinical diffusion MRI. Magn Reson Med. 2015;74.
16. Litvan I, Goldman JG, Tröster AI, et al. Diagnostic criteria for mild cognitive impairment in Parkinson’s disease: Movement Disorder Society Task Force guidelines. Mov Disord. 2012/01/24. 2012;27:349–356.
17. Andersson JLR, Sotiropoulos SN. An integrated approach to correction for off-resonance effects and subject movement in diffusion MR imaging. Neuroimage. United States; 2016;125:1063–1078.
18. Hoy AR, Ly M, Carlsson CM, et al. Microstructural white matter alterations in preclinical Alzheimer’s disease detected using free water elimination diffusion tensor imaging. PLoS One. United States; 2017;12:e0173982.
19. Winkler AM, Ridgway GR, Webster MA, Smith SM, Nichols TE. Permutation inference for the general linear model. Neuroimage. United States; 2014;92:381–397.
20. Jensen JH, Helpern JA, Ramani A, Lu H, Kaczynski K. Diffusional kurtosis imaging: the quantification of non-gaussian water diffusion by means of magnetic resonance imaging. Magn Reson Med. United States; 2005;53:1432–1440.
21. Zhang H, Schneider T, Wheeler-Kingshott CA, Alexander DC. NODDI: practical in vivo neurite orientation dispersion and density imaging of the human brain. Neuroimage. United States; 2012;61:1000–1016.
Figures