2377
Examination of nigral volumetric and microstructural changes in prodromal and overt Parkinson’s disease1Center for Advanced Neuroimaging, University of California Riverside, Riverside, CA, United States, 2Department of Neurosciences, University of California San Diego, San Diego, CA, United States, 3Parkinson & Other Movement Disorders Center, University of California San Diego, San Diego, CA, United States, 4Department of Neurology, Emory University, Atlanta, GA, United States, 5Department of Bioengineering, University of California Riverside, Riverside, CA, United States
Synopsis
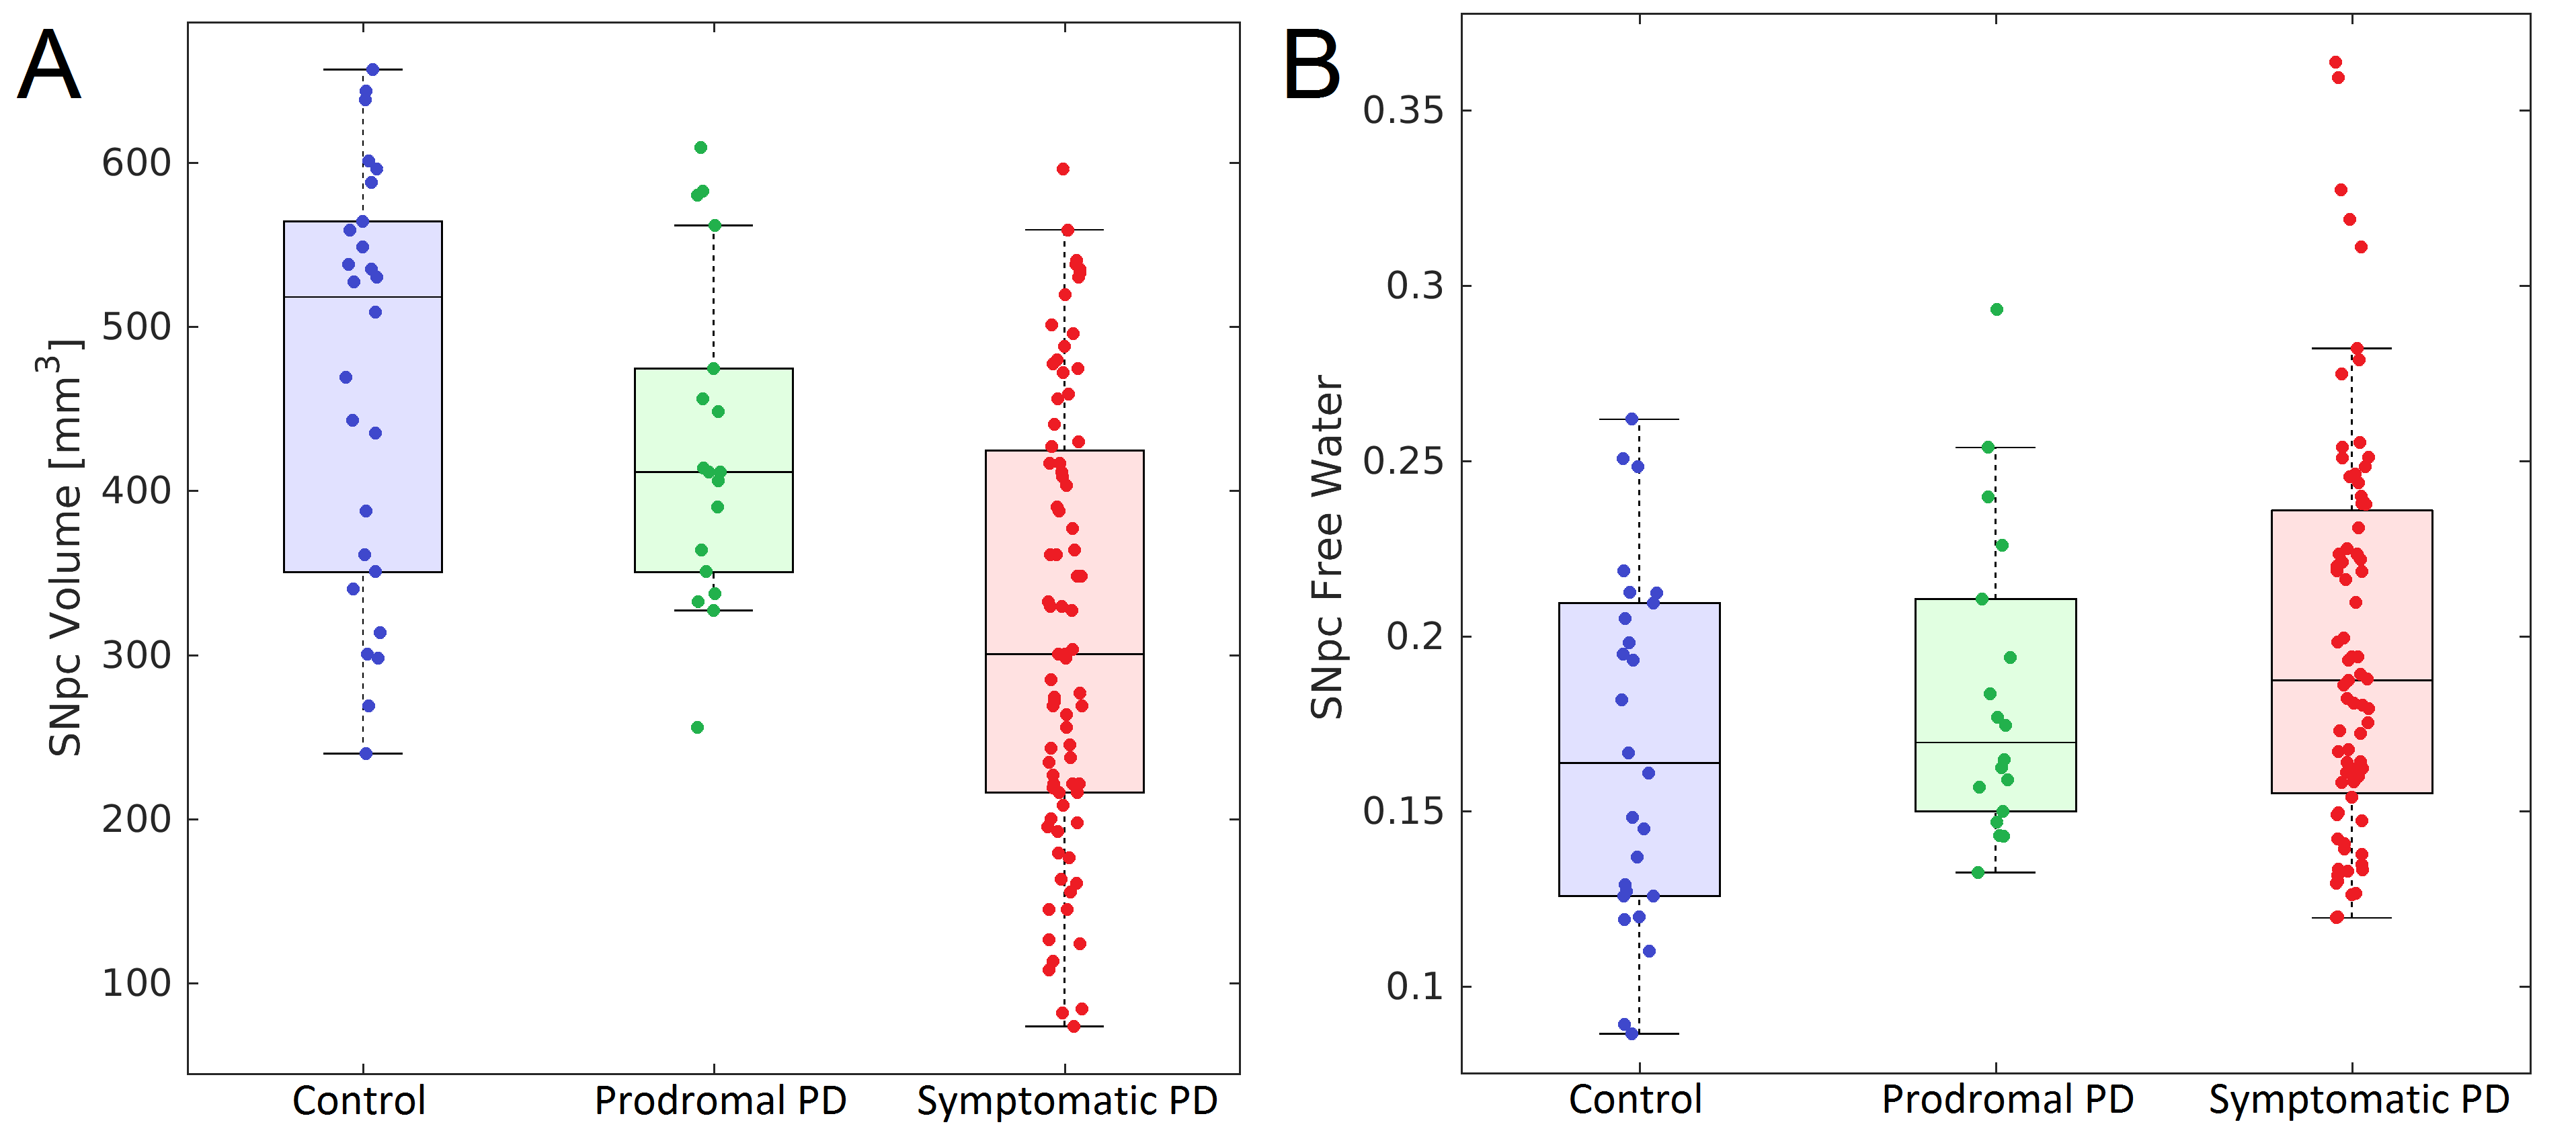
We examine nigral volume and tissue microstructure in prodromal and symptomatic Parkinson’s disease. Decreases in nigral volume were observed in the symptomatic Parkinson's disease group relative to the control group (p<10-3) and prodromal Parkinson's disease (p<10-3) group. A reduction in nigral volume was seen in the prodromal Parkinson's disease group relative to the control group (p=0.025). An increase in nigral free water was also found in the symptomatic Parkinson’s disease group relative to the control group (p=0.014).
Introduction
Parkinson’s disease (PD) is a progressive, neurodegenerative disorder characterized by asymmetrical onset of motor symptoms such as bradykinesia, rigidity, and tremor. The loss of melanized catecholaminergic neurons in substantia nigra pars compacta (SNpc) is a principal pathologic feature of PD1,2 and up to 50% of melanized neurons in SNpc are lost at the time of onset of Parkinsonian symptoms.2 Melanized neurons in these SNpc can be imaged in vivo using implicit or explicit magnetization transfer (MT) effects3-5 and magnetization transfer contrast (MTC) colocalizes with melanized neurons.6 Implicit MT effects are generated by an interleaved multislice turbo spin echo acquisition7 and explicit MT effects can be generated by a MT preparation pulse5 or fat saturation pulse.4Application of magnetization transfer effects to investigate PD-related changes in catecholamine nuclei have revealed reductions in nigral volume7,8 or nigral contrast4,9 in prodromal and clinically manifest PD cohorts. Other work examining microstructural changes has found increases in the free water compartment in prodromal and overt PD.10-12 Here, we examine nigral volume loss and microstructural changes in a prodromal and symptomatic PD cohort.
Methods
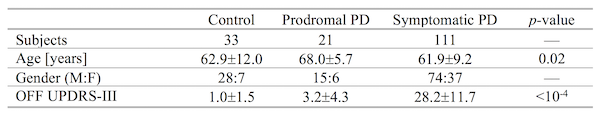
Data was obtained from the Parkinson’s Progression Markers Initiative (PPMI) database (www.ppmi-info.org/data). For up-to-date information on the study, visit www.ppmi-info.org. Full inclusion and exclusion criteria for enrollment in PPMI can be found at www.ppmi-info.org. Institutional IRB approved the study for each site and subjects gave written informed consent. Criteria for inclusion for subjects from the PPMI database used in this analysis were as follows: 1) participants must be scanned with cardiac-gated diffusion tensor imaging (DTI) and dual echo turbo-spin echo (TSE) with a fat saturation pulse, 2) participants must have DTI and TSE scans with scan parameters matching those in the PPMI imaging protocol, and 3) PD subjects must have scan data at the 24 month time point. A total of 165 subjects (33 controls, 21 prodromal, 111 PD patients) met this criteria. Demographic information for this cohort is summarized in Table 1.T1-weighted structural images in the PPMI cohort were used for registration to common space. Dual TSE images were acquired with the following parameters: TE1/TE2/TR=11/101/3270 ms, FOV=240×213 mm2, voxel size=0.9×0.9×3 mm3, fat saturation pulse, 48 slices. The first echo of the TSE acquisition contains magnetization transfer effects from the fat saturation pulse and interleaved TSE acquisition. Cardiac-gated diffusion-MRI data in the PPMI cohort were acquired using a monopolar diffusion encoding gradient with 64 unique gradient directions and the following parameters: TE/TR=88/650-1100 ms, flip angle=90.0°, FOV=229×229 mm2, voxel size=1.98×1.98×2 mm3, b=1000 s/mm2, cardiac-triggered, with 72 slices.
Transformations between subject space and common space were derived using nonlinear transforms in FSL. A boundary-based registration cost function was then used to derive a transform between the T1-weighted image and the first TSE image and b=0 images.
DTI data were corrected for motion and eddy-current distortions using EDDY in FSL. Next, susceptibility distortions were reduced by nonlinearly fitting the b=0 image to second echo from the TSE acquisition. A bi-compartment model,13 implemented in DIPY,14 was used to construct free water maps. Mean SNpc free water was measured for each subject using previously reported probabilistic standard space mask.15
Data from the first echo in the TSE acquisition has magnetization transfer effects and was used to segment SNpc. SNpc was segmented using a thresholding method. A reference region was drawn in the cerebral peduncle in MNI common space and then transformed to individual NM-MRI images and used to threshold. Voxels with intensity >μref+3σref were considered to be part SNpc. Thresholding was restricted to the anatomic location of SNpc using previously reported probabilistic standard space mask.14
Results
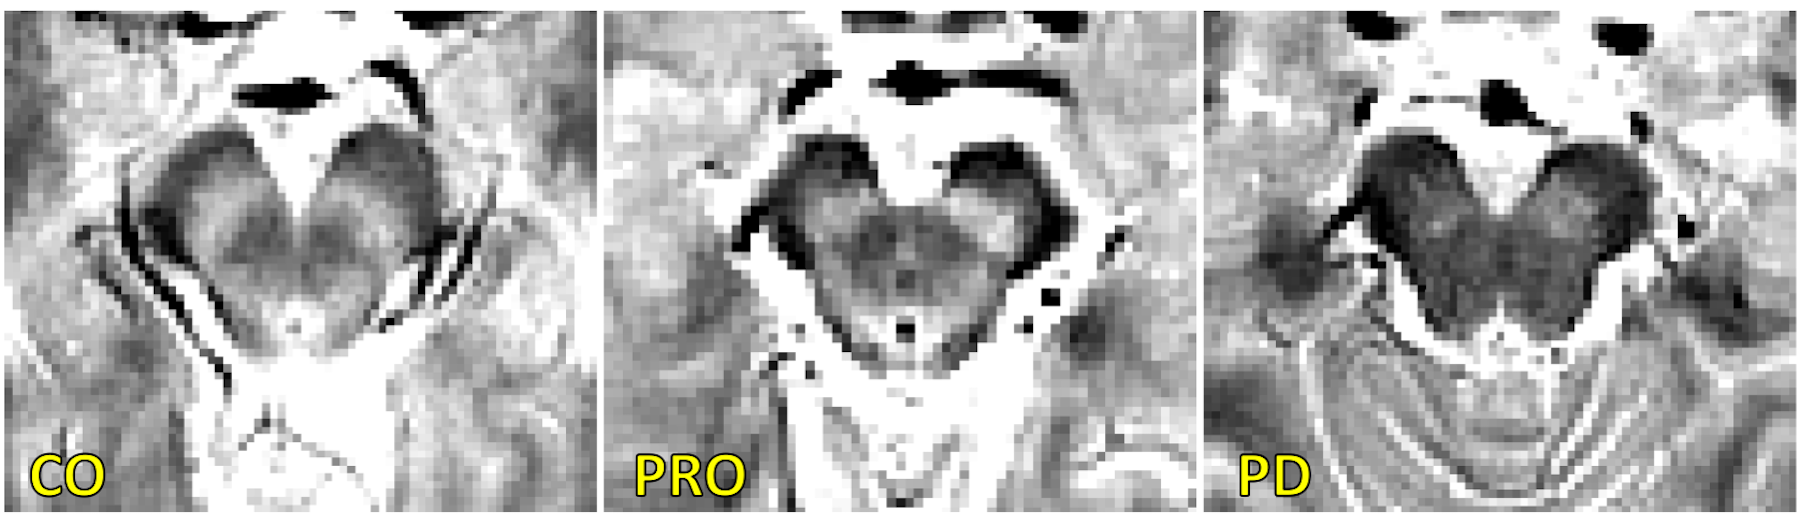
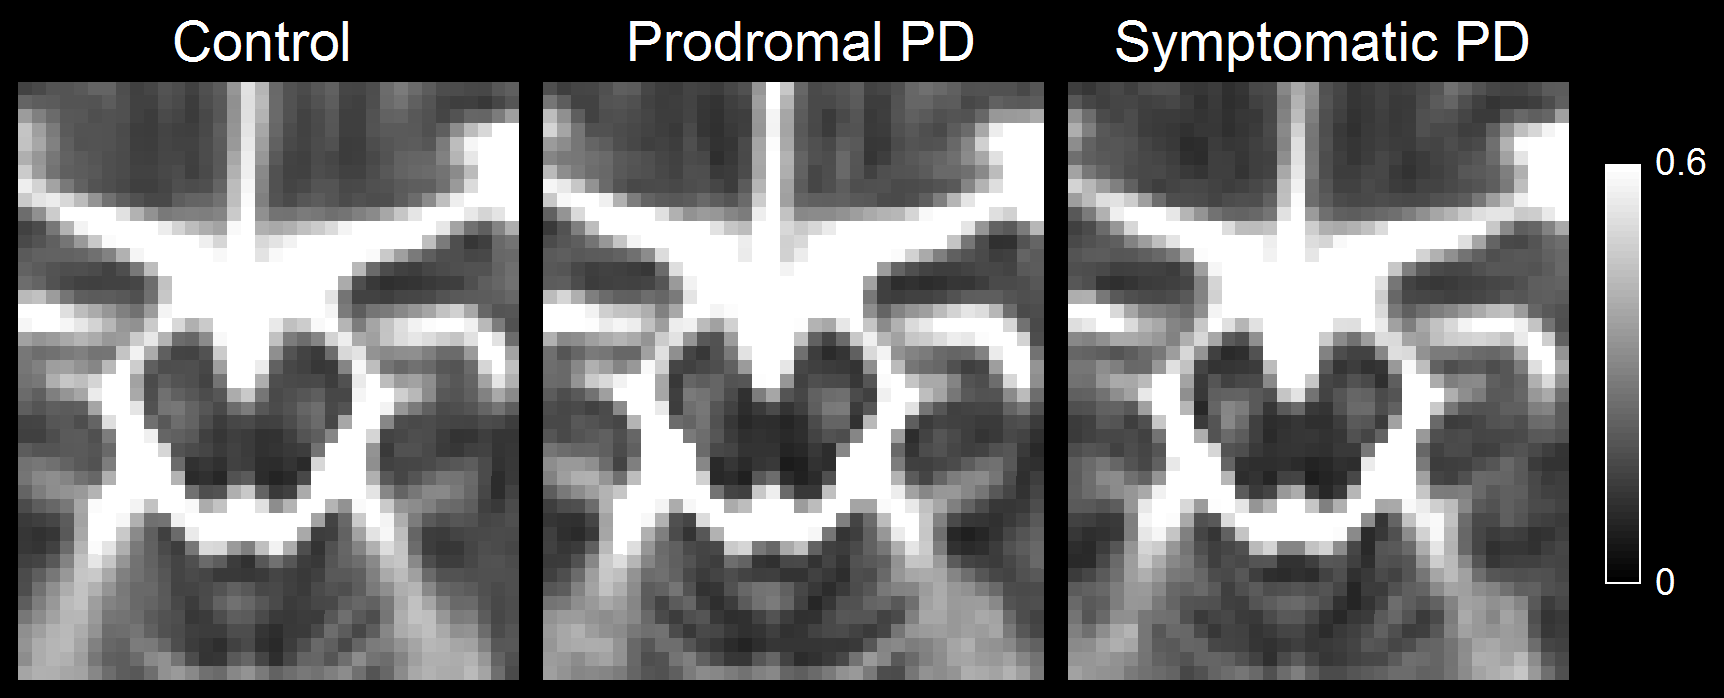
A comparison of SNpc contrast in the first echo from the TSE acquisition and free water images for prodromal PD, symptomatic PD, and control subjects are shown in Figures 1 and 2, respectively. The effect of group (symptomatic PD, prodromal PD, control) was tested with separate analysis of covariance (ANCOVA) in each MRI measure (SNpc volume free water), controlling for age. A significant main effect in group (p<10-4;F=25.12) was seen for SNpc volume. Pairwise-comparisons showed decreases in SNpc volume in the symptomatic PD group relative to the control group (p<10-3) and prodromal (p<10-3) groups. Relative to the control group, reduced SNpc volume was seen in the prodromal PD group (p=0.025). Similarly, a significant main effect in group was seen in SNpc free water (p=0.046;F=3155) with means showing increases in SNpc free water in the symptomatic PD group relative to control group (p=0.014). No difference was seen in SNpc free water between prodromal PD and control (p=0.323) or symptomatic PD groups (p=0.357).Discussion
We found reductions in nigral volume in the prodromal PD and symptomatic PD groups relative to controls and an increase in nigral free water in the symptomatic PD group relative to controls. A reduction in contrast was observed in the posterior regions of SNpc (Figure 1). This is in agreement with earlier studies that found volume a reduction of neuromelanin-sensitive contrast in the posterior portion of SNpc.8 Increases in SNpc free water are also observed in the symptomatic PD group relative to the control group but not the prodromal PD group and agrees with earlier studies.10-12Acknowledgements
Data used in this abstract was collected by PPMI. PPMI – a public-private partnership – is funded by the Michael J. Fox Foundation for Parkinson’s Research and funding partners, including [list the full names of all of the PPMI funding partners found at www.ppmi-info.org/fundingpartners].References
[1] Braak, et al. Staging of brain pathology related to sporadic Parkinson's disease. Neurobiol Aging, 24:197-211
[2] Fearnley & Lees. Ageing and Parkinson’s disease: substantia nigra regional selectivity. Brain 114:2283-2301
[3] Sasaki, et al. Neuromelanin magnetic resonance imaging of locus ceruleus and substantia nigra in Parkinson's disease. Neuroreport. 17:1215-8
[4] Schwarz, et al. T1-Weighted MRI shows stage-dependent substantia nigra signal loss in Parkinson's disease. Movement Disorders. 26:1633–38
[5] Chen, et al. Simultaneous imaging of
locus coeruleus and substantia nigra with a quantitative neuromelanin MRI
approach. Magn Reson Imaging. 32:1301-6
[6] Keren, et al. Histologic validation of locus coeruleus MRI contrast in post-mortem tissue. Neuroimage, 113:235-245 [7] Dixon, et al. Incidental magnetization transfer contrast in standard multislice imaging. Magn Reson Imaging, 8:417-22
[7] Ogisu, et al. 3D neuromelanin-sensitive magnetic resonance imaging with semi-automated volume measurement of the substantia nigra pars compacta for diagnosis of Parkinson’s disease, Neuroradiology 55:719–724
[8] Schwarz, et al. In vivo assessment of brainstem depigmentation in Parkinson disease: potential as a severity marker for multicenter studies, Radiology :160662
[9] Reimao, et al. Substantia nigra neuromelanin magnetic resonance imaging in de novo Parkinson’s disease patients, Eur. J. Neurol. 22: 540–546
[10] Guttuso, et al. Substantia Nigra Free Water Increases Longitudinally in Parkinson Disease. AJNR Am J Neuroradiol. Mar 2018;39(3):479-484
[11] Burciu, et al. Progression marker of Parkinson's disease: a 4-year multi-site imaging study. Brain. 140:2183-2192
[12] Zhou, et al. Increased free water in the substantia nigra in idiopathic REM sleep behaviour disorder. Brain, 144:1488-1497.
[13] Pasternak, et al. Free water elimination and mapping from diffusion MRI. Magn Reson Med. 62:717-30
[14] Garyfallidis, et al. Dipy, a library for the analysis of diffusion MRI data. Front Neuroinform. 2014;8:8
[15] Langley, et al. Characterization of age-related microstructural changes in locus coeruleus and substantia nigra pars compacta. Neurobiol Aging, 87:89-97
Figures