2375
Multiecho sandwich spatial saturation neuromelanin imaging: improved nigral hyperintensity and need for T2* correction in NM-sensitive images1Seoul National University, Seoul, Korea, Republic of, 2Severance Hospital, Seoul, Korea, Republic of, 3Department Radiology, Samsung Medical Center, Seoul, Korea, Republic of, 4Siemens Healthineers Ltd., Seoul, Korea, Republic of, 5Department of Radiology, Ajou University School of Medicine, Ajou University Medical Center, Suwon, Korea, Republic of, 6Heuron Co. Ltd., Incheon, Korea, Republic of, 7Department of Neurology, Severance Hospital, Seoul, Korea, Republic of
Synopsis
Multi-echo sandwich spatial saturation neuromelanin (sandwichNMmulti-echo) imaging is proposed to simultaneously acquire a high-quality neuromelanin-sensitive image, a co-localized T2* map, and an improved susceptibility map weighted image for nigral hyperintensity. When this method is applied for PD patients and healthy controls, the results suggest that the reduced neuromelanin contrast in PD is partially explained by shorter T2* in substantia nigra of the PD patients. Initial results at 7T further support the finding, suggesting a need for T2* correction in assessing the NM-sensitive images.
Introduction
Neuromelanin (NM)-sensitive MRI1–4 and susceptibility imaging for nigral hyperintensity,5–8 and the joint analysis of the two imaging methods9–11 are of great interests in the research of Parkinson’s disease (PD). Recently, sandwich spatial saturation neuromelanin (sandwichNM) imaging was developed using spatial saturation pulses for MT weighting (Figure 1).12 Because sandwichNM is based on a 3D GRE sequence, the phase data may be utilized for susceptibility-based nigral imaging, similar to a previous study.10 In this work, we propose to extend the sandwichNM method by utilizing multi-echo magnitude and phase images, which can be acquired at no extra cost. These images are utilized to obtain NM-sensitive images along with co-localized T2* maps, and improved nigral hyperintensity images using susceptibility map weighted imaging (SMWI).7,13 We demonstrate that the new SMWI images benefit from additional NM weighting from sandwichNM. The comparison between PD patients and healthy controls (HCs) reveals a need for T2* correction prior to assessing NM-sensitive images. This finding is further supported by 7T results.Methods
[Multi-echo sandwichNM of PD patients and HCs]Ten PD patients (4 males; 69.5 ± 8.67 years) and two HCs (62- and 76-year-old female) were scanned using a 3T scanner (MAGNETOM Prismafit, Siemens Healthineers, Erlangen, Germany; IRB approved) for comparison between sandwichNM images in PD and HC. The patients met UK Parkinson’s Disease Society Brain Bank Criteria and had dopamine deficit in striatum in dopamine transporter imaging. SandwichNM images were acquired using scan parameters summarized in Table 1.
In all subjects, T2* maps were generated by fitting a mono-exponential model to the magnitude images. Then, the multi-echo magnitude and phase images were processed using the SMWI toolbox. The resulting SMWI images have NM-weighting and is named as NM-SMWI to distinguish them from conventional SMWI7 that utilized no saturation pulses.
To assess the CNR7 of nigral hyperintensity signature (or nigrosome 1) in NM-SMWI, conventional-SMWI is also acquired with the same sequence parameters.
Substantia nigra (SN) and crus cerebri (CC) ROIs were drawn for ROI analysis of T2* values and contrast ratio (CR)1 with
$$ CR(\%) = \frac{(I_{SN}-I_{CC})}{I_{CC}}\ \times100 $$
where $$$I_{SN}$$$ and $$$I_{CC}$$$ are the ROI-averaged signal intensities. SN ROIs were then divided into medial and lateral ROIs (Figure 2a, b; red: medial SN, purple: lateral SN), and ROI-averaged T2* were calculated.
[7T multi-echo sandwichNM]
One healthy subject was scanned at a 7T scanner (MAGNETOM Terra, Siemens Healthineers, Erlangen, Germany; IRB approved). Two sandwiched saturation pulses with 150 mm thickness and 5 mm gap were utilized to meet the SAR limitation. Scan parameters are summarized in Table 1. To demonstrate the T2* weighting, sandwichNM images were extrapolated to TE = 0 ms.
Results
SandwichNM images and T2* maps are displayed for one HC and one PD patient (Figure 2). When CR and T2* are compared, they are smaller in PD patients than in HCs (CR: 24.0 ± 2.4% vs. 27.5 ± 1.5%; T2*: 32.0 ± 6.3 ms vs. 45.6 ± 5.3 ms). Mean T2*SN,medial is smaller than T2*SN,lateral in HCs (T2*SN,medial: 42.9 ± 4.7, T2*SN,lateral: 51.3 ± 5.6), whereas they are comparable in PD patients (T2*SN,medial: 31.8 ± 7.0, T2*SN,lateral: 32.1 ± 6.0).When the NM-SMWI and conventional-SMWI images are compared (Figure 3), the nigral hyperintensity is observed in both images of HC (Figure 3a, red arrows), while it disappeared in the PD patient. The hyperintensity appears brighter in the NM-SMWI images, due to the NM-weighting, improving CNR (NW-SMWI: 2.88 vs. Conventional-SMWI: 2.09).
The 7T sandwichNM, sandwichNM at TE of 0 ms, and NM-SMWI are displayed in Figure 4. SandwichNM at TE of 0 ms displays substantially higher signal intensity than that at 1st echo due to the T2*-weighting, suggesting a necessity to correct for the T2* effects. A laminar structure is noticed in the sandwichNM image (Figure 4, red arrows).
Discussion and Conclusion
In this study, sandwichNMmulti-echo is proposed and applied for PD patients and HCs. SandwichNM results reveal a CR drop in PD patients compared to HCs, agreeing with the previous studies.1,11,14,15 Our new NM-SMWI displays improved nigral hyperintensity compared to conventional-SMWI.While CR is smaller in PD compared to HCs, the results must be carefully interpreted considering the T2* differences and non-zero TE. The PD patients had shorter T2*SN,total, presumably from high iron deposition in SN, creating reduction in CR when non-zero TE is used. Furthermore, the different spatial distribution of T2* values (i.e., T2*SN,medial vs. T2*SN,lateral) may affect voxel-wise comparison of NM in HCs and PDs in NM-sensitive imaging using GRE. Therefore, the T2* effects must be considered before the analysis of NM-sensitive MRI images (e.g., extrapolate to TE = 0 ms).
The 7T scan had longer TE due to flow compensation. Moreover, T2* is shorter at 7T,16 resulting in larger T2*-weighting in 7T sandwichNM images. The appearances of SN in sandwichNM (1st echo) and sandwichNM at TE of 0 ms are visually different, supporting the finding that the T2* effects must be considered in NM-sensitive images.
In conclusion, the proposed sandwichNMmulti-echo provides NM-sensitive images, co-localized T2* maps, and improved SMWI for nigral hyperintensity. The T2* analysis suggests a need for T2* correction prior to the assess of NM-sensitive images.
Acknowledgements
This work was supported by Heuron Co. Ltd., and the BK21 FOUR program of the Education and Research Program for Future ICT Pioneers, Seoul National University in 2021.References
1. Sasaki, M. et al. Neuromelanin magnetic resonance imaging of locus ceruleus and substantia nigra in Parkinson’s disease. Neuroreport 17, 1215–1218 (2006).
2. Cassidy, C. M. et al. Neuromelanin-sensitive MRI as a noninvasive proxy measure of dopamine function in the human brain. Proc National Acad Sci 116, 201807983 (2019).
3. Liu, Y. et al. Optimizing neuromelanin contrast in the substantia nigra and locus coeruleus using a magnetization transfer contrast prepared 3D gradient recalled echo sequence. Neuroimage 218, 116935 (2020).
4. Chen, X. et al. Simultaneous imaging of locus coeruleus and substantia nigra with a quantitative neuromelanin MRI approach. Magn Reson Imaging 32, 1301–1306 (2014).
5. Kwon, D. et al. Seven‐tesla magnetic resonance images of the substantia nigra in Parkinson disease. Ann Neurol 71, 267–277 (2012).
6. Schwarz, S. T. et al. The ‘Swallow Tail’ Appearance of the Healthy Nigrosome – A New Accurate Test of Parkinson’s Disease: A Case-Control and Retrospective Cross-Sectional MRI Study at 3T. Plos One 9, e93814 (2014).
7. Nam, Y., Gho, S., Kim, D., Kim, E. Y. & Lee, J. Imaging of nigrosome 1 in substantia nigra at 3T using multiecho susceptibility map‐weighted imaging (SMWI). J Magn Reson Imaging 46, 528–536 (2017).
8. Cheng, Z. et al. Imaging the Nigrosome 1 in the substantia nigra using susceptibility weighted imaging and quantitative susceptibility mapping: An application to Parkinson’s disease. Neuroimage Clin 25, 102103 (2020).
9. Langley, J. et al. A multicontrast approach for comprehensive imaging of substantia nigra. Neuroimage 112, 7–13 (2015).
10. He, N. et al. Imaging iron and neuromelanin simultaneously using a single 3D gradient echo magnetization transfer sequence: Combining neuromelanin, iron and the nigrosome-1 sign as complementary imaging biomarkers in early stage Parkinson’s disease. Neuroimage 230, 117810 (2021).
11. Sung, Y. H., Noh, Y. & Kim, E. Y. Early‐stage Parkinson’s disease: Abnormal nigrosome 1 and 2 revealed by a voxelwise analysis of neuromelanin‐sensitive MRI. Hum Brain Mapp 42, 2823–2832 (2021).
12. Ji, S. et al. High neuromelanin contrast achieved using sandwiched flow saturation RF pulses: sandwich-fsNM imaging. in Proceedings 2021 Annual Meeting, International Society for Magnetic Resonance in Medicine 1253 (2021).
13. Gho, S. et al. Susceptibility map‐weighted imaging (SMWI) for neuroimaging. Magnet Reson Med 72, 337–346 (2014).
14. Prasuhn, J. et al. Association of Locus Coeruleus and Substantia Nigra Pathology With Cognitive and Motor Functions in Patients With Parkinson Disease. Neurology 97, e1007–e1016 (2021).
15. Oshima, S. et al. Neuromelanin‐Sensitive Magnetic Resonance Imaging Using DANTE Pulse. Movement Disord (2020) doi:10.1002/mds.28417.
16. Peters, A. M. et al. T2* measurements in human brain at 1.5, 3 and 7 T. Magn Reson Imaging 25, 748–753 (2007).
17. Blazejewska, A. I. et al. Visualization of nigrosome 1 and its loss in PD. Neurology 81, 534–540 (2013).
Figures
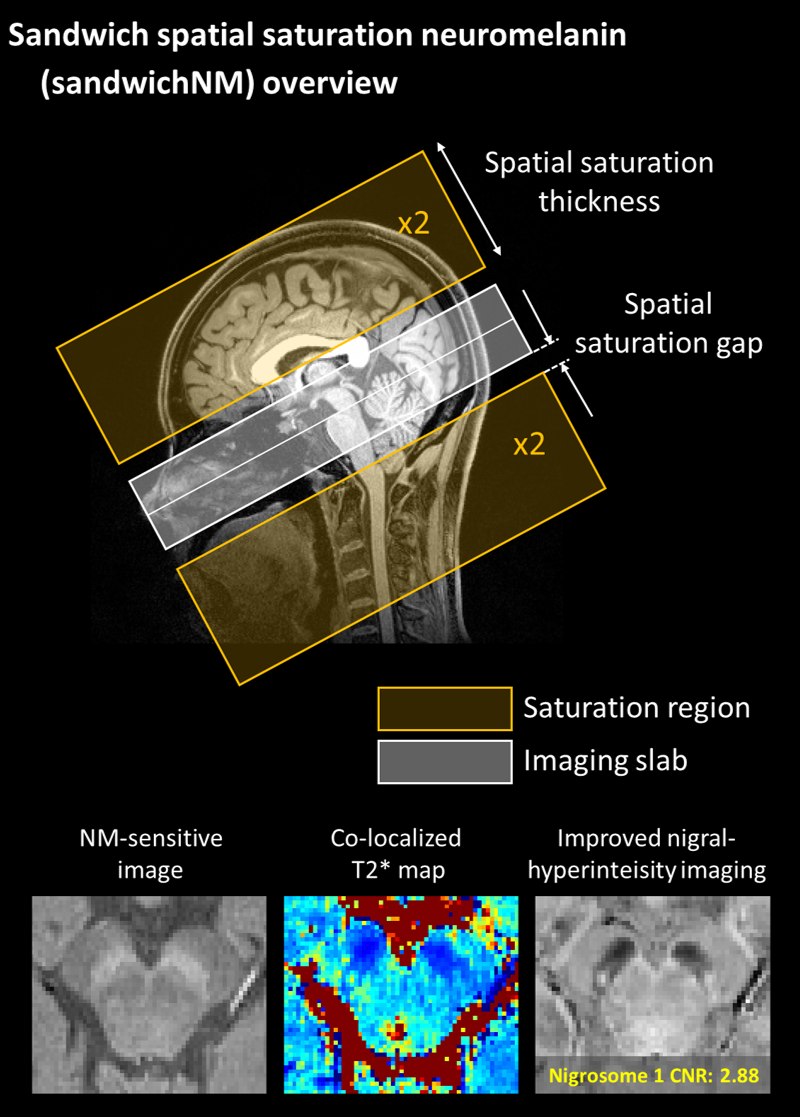
Figure 1. Overview of the multi-echo spatial saturation neuromelanin
(sandwichNMmulti-echo)
imaging. SandwichNM imaging uses spatial saturation pulses for magnetization
transfer (MT) weighting. Four spatial saturation pulses are alternately applied
inferior and superior to the imaging volume, inducing symmetric MT effects
across slices. SandwichNMmulti-echo imaging
provides high quality NM images, co-localized T2* maps, and improved nigral hyperintensity
images.
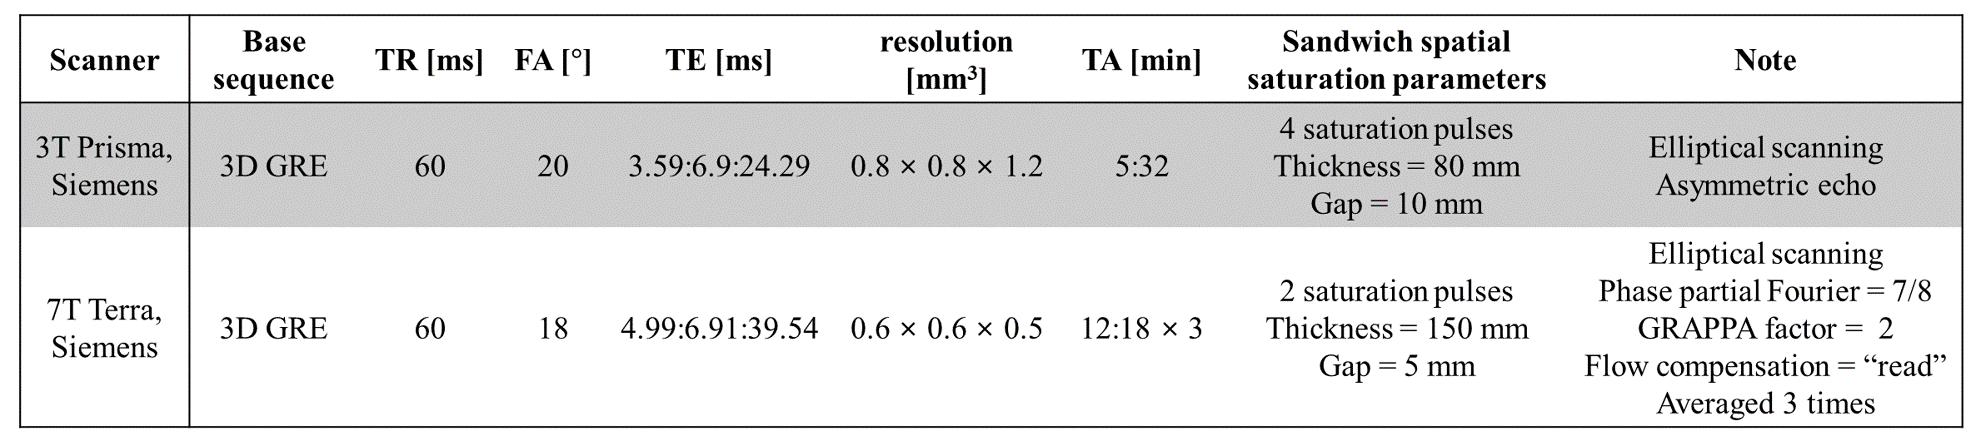
Table 1. Sequence parameters for this study.
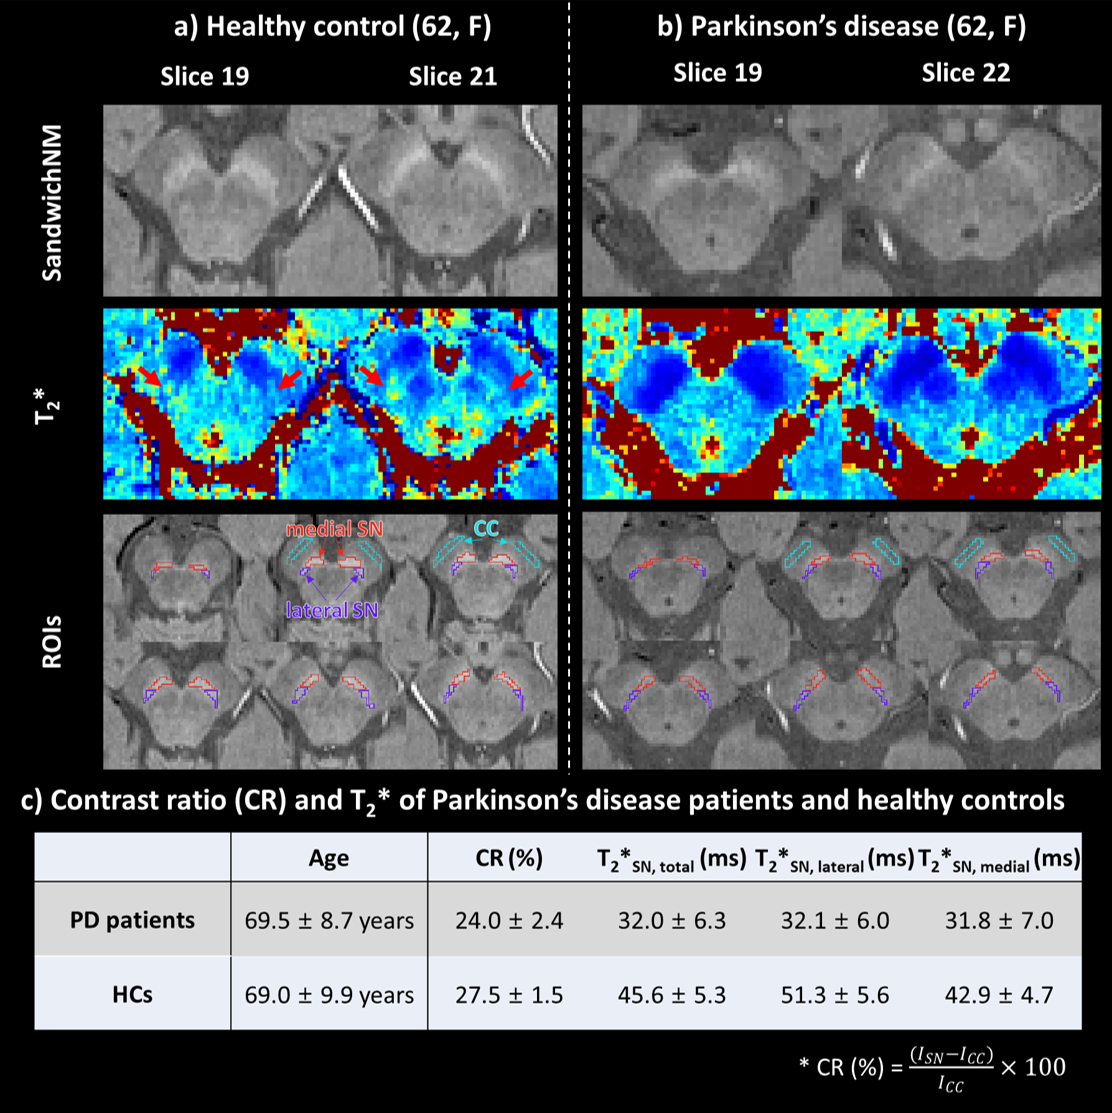
Figure 2. Two slices of healthy control (HC; (a)) and PD patient
(b) data are compared for the sandwichNM images (1st echo) and T2* maps. Red, purple, and sky-blue lines on the ROIs panel
denote medial substantia nigra (SN), lateral SN, and crus cerebri (CC) ROIs,
respectively. c) When averaged across each group, the CR of SN is smaller in PD
patients than HCs. However, T2* is shorter in PD patients, suggesting influence of T2* differences on CR due to non-zero TE(=3.59 ms).
Spatial distribution of T2* is different in PD and HC (T2*lateral compared to T2*medial higher in HC, but
similar in PD).
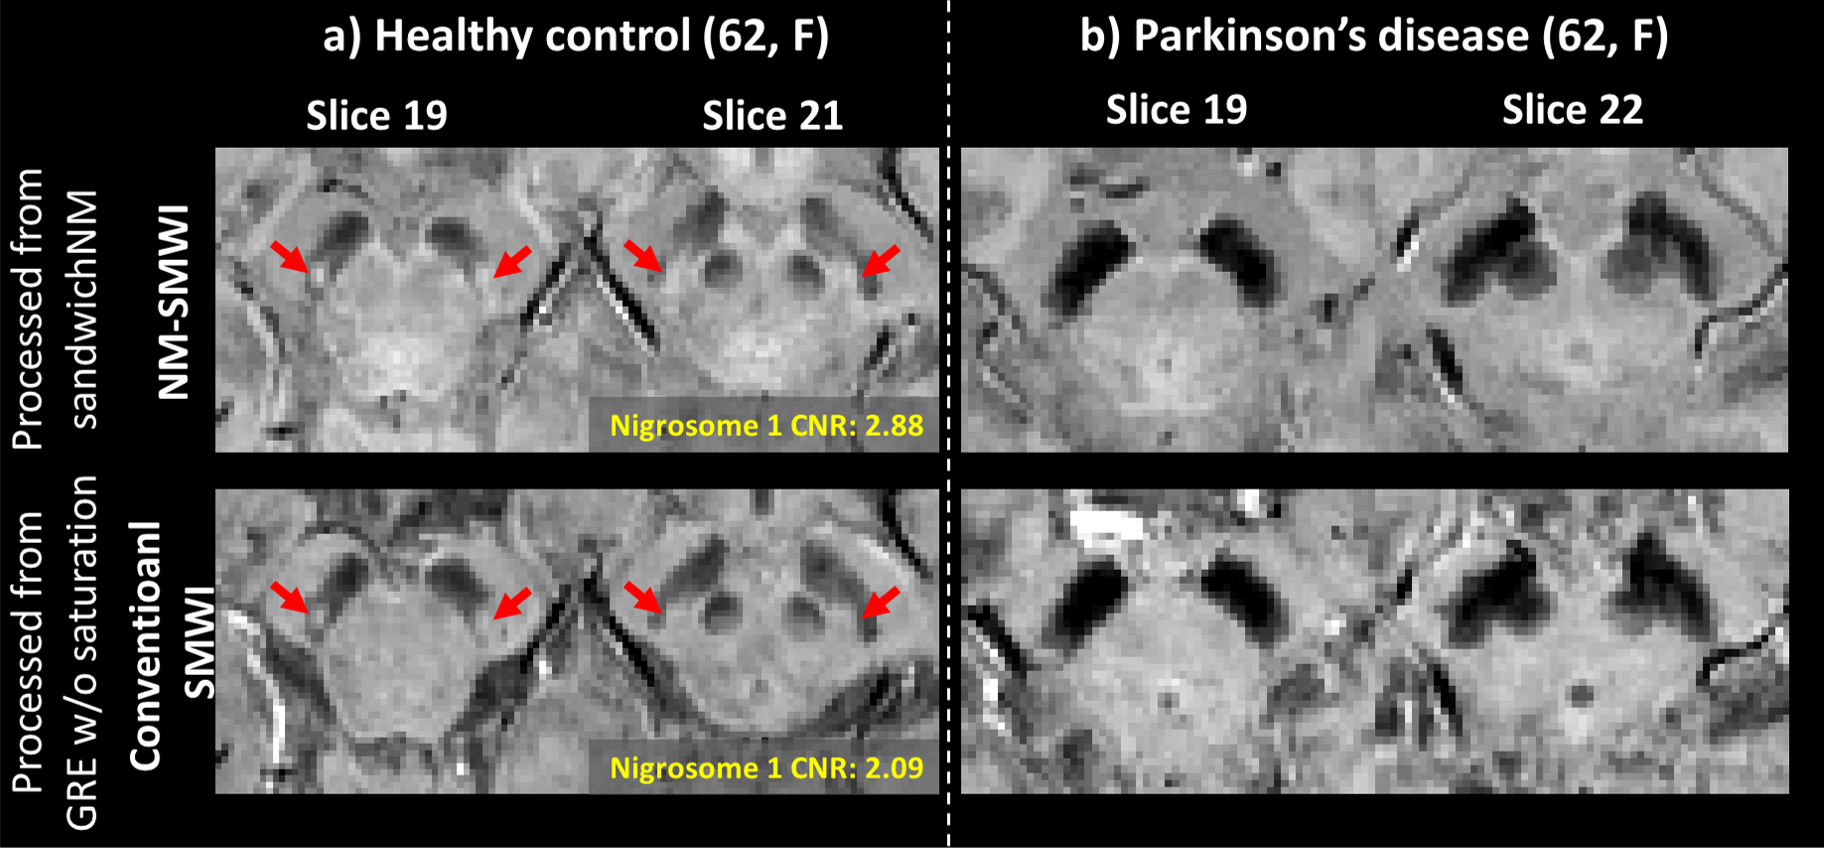
Figure 3. The NM-SMWI, GRE-SMWI images of the age- and sex-matched HC (a) and
PD patient (b). All images of HC successfully delineate the nigral
hyperintensity region (a.k.a nigrosome 1), while the region is not noticeable
in the PD patient images. The nigrosome 1 signature in NM-SMWI appear brighter
than in conventional SMWI, which is confirmed in the CNR comparison (2.88 in
NM-SMWI vs. 2.09 in conventional-SMWI).
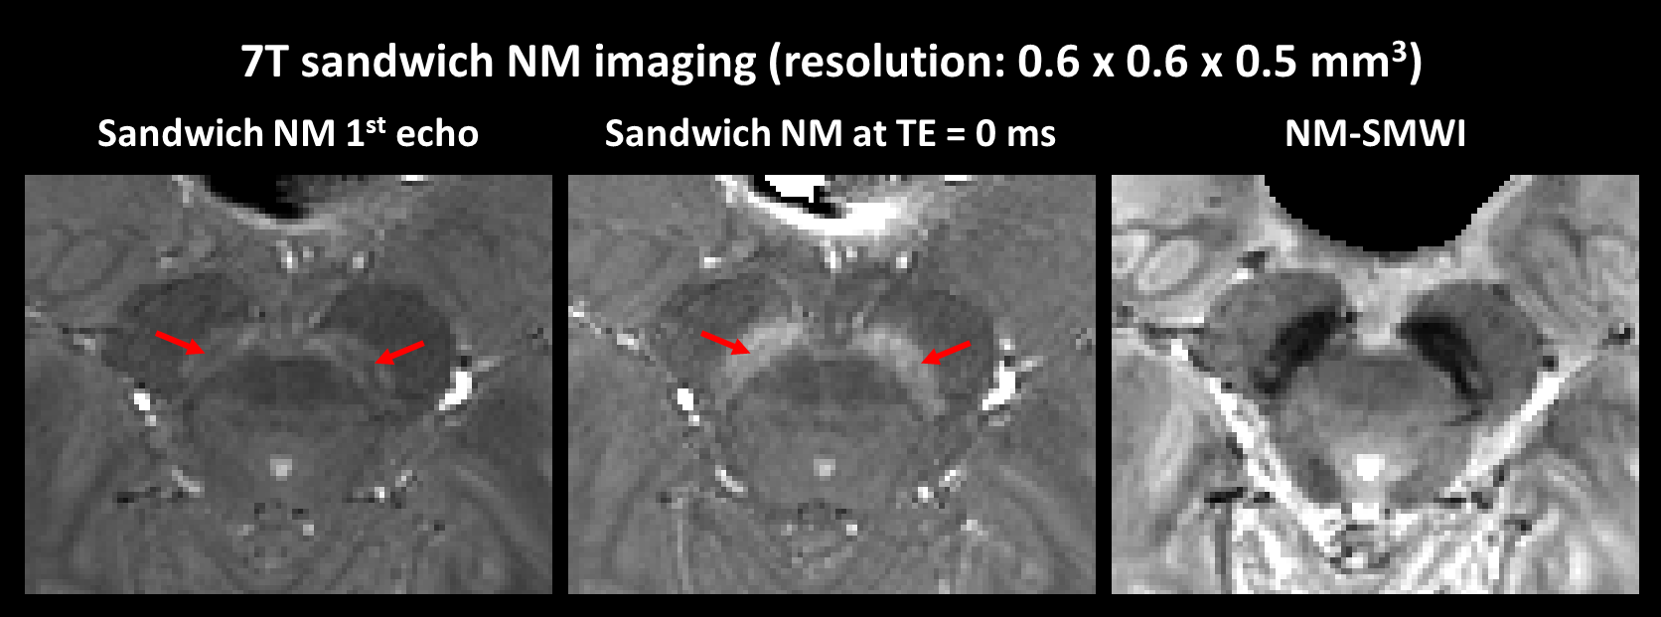
Figure 4. SandwichNM images at 7T acquired with higher
resolution. Due to shorter T2* at 7T and longer TE from high resolution, the T2* effects are more pronounced at the sandwichNM image,
resulting in a substantially reduced NM contrast. An improved NM contrast can
be combined after extrapolating a TE of 0 ms image. In this high-resolution 7T
sandwichNM image, the laminar structure of NM is noticed (red arrows), similar
to that observed in a histopathology study17. NM-SMWI displays the nigral hyperintensity sign.