2373
Observing hyperintensity region within substantia nigra in cynomolgus monkey1Department of Electrical and Computer Engineering, Seoul National University, Seoul, Korea, Republic of, 2National Primate Research Center, Korea Research Institute of Bioscience and Biotechnology (KRIBB), Cheongju, Korea, Republic of, 3Heuron Co.,Ltd, Incheon, Korea, Republic of
Synopsis
In this study, a hyperintensity region within substantia nigra is explored in cynomolgus monkeys over a wide range of ages. This region is similar to that of humans, which is often called as a swallow tail sign in healthy subjects. This nigral hyperintensity appears consistently in SMWI, QSM, and T2*-weighted images, particularly in aged animals.
Introduction
Parkinson’s disease (PD) is one of the major neurodegenerative diseases. Recently, several studies have suggested that a hyperintense pattern within substantia nigra of an MR image can be used as an imaging biomarker for PD.1,2 This nigral hyperintensity is observed in the susceptibility-related contrast images including T2*-weighted image1, SWI2, and SMWI3 with the best visibility in SMWI at 3T.3So far, most of the studies have focused on the human brain. However, no study has explored a similar pattern in cynomolgus monkeys (macaca fascicularis), which may be used as an animal model for PD.4 In this study, we optimize the scan protocol to observe the nigral hyperintensity for the small-size brain of the cynomolgus monkey and demonstrate that the nigral hyperintensity can be identified using 3T MRI. This outcome may help us to monitor the progression of PD in the animal model.
Methods
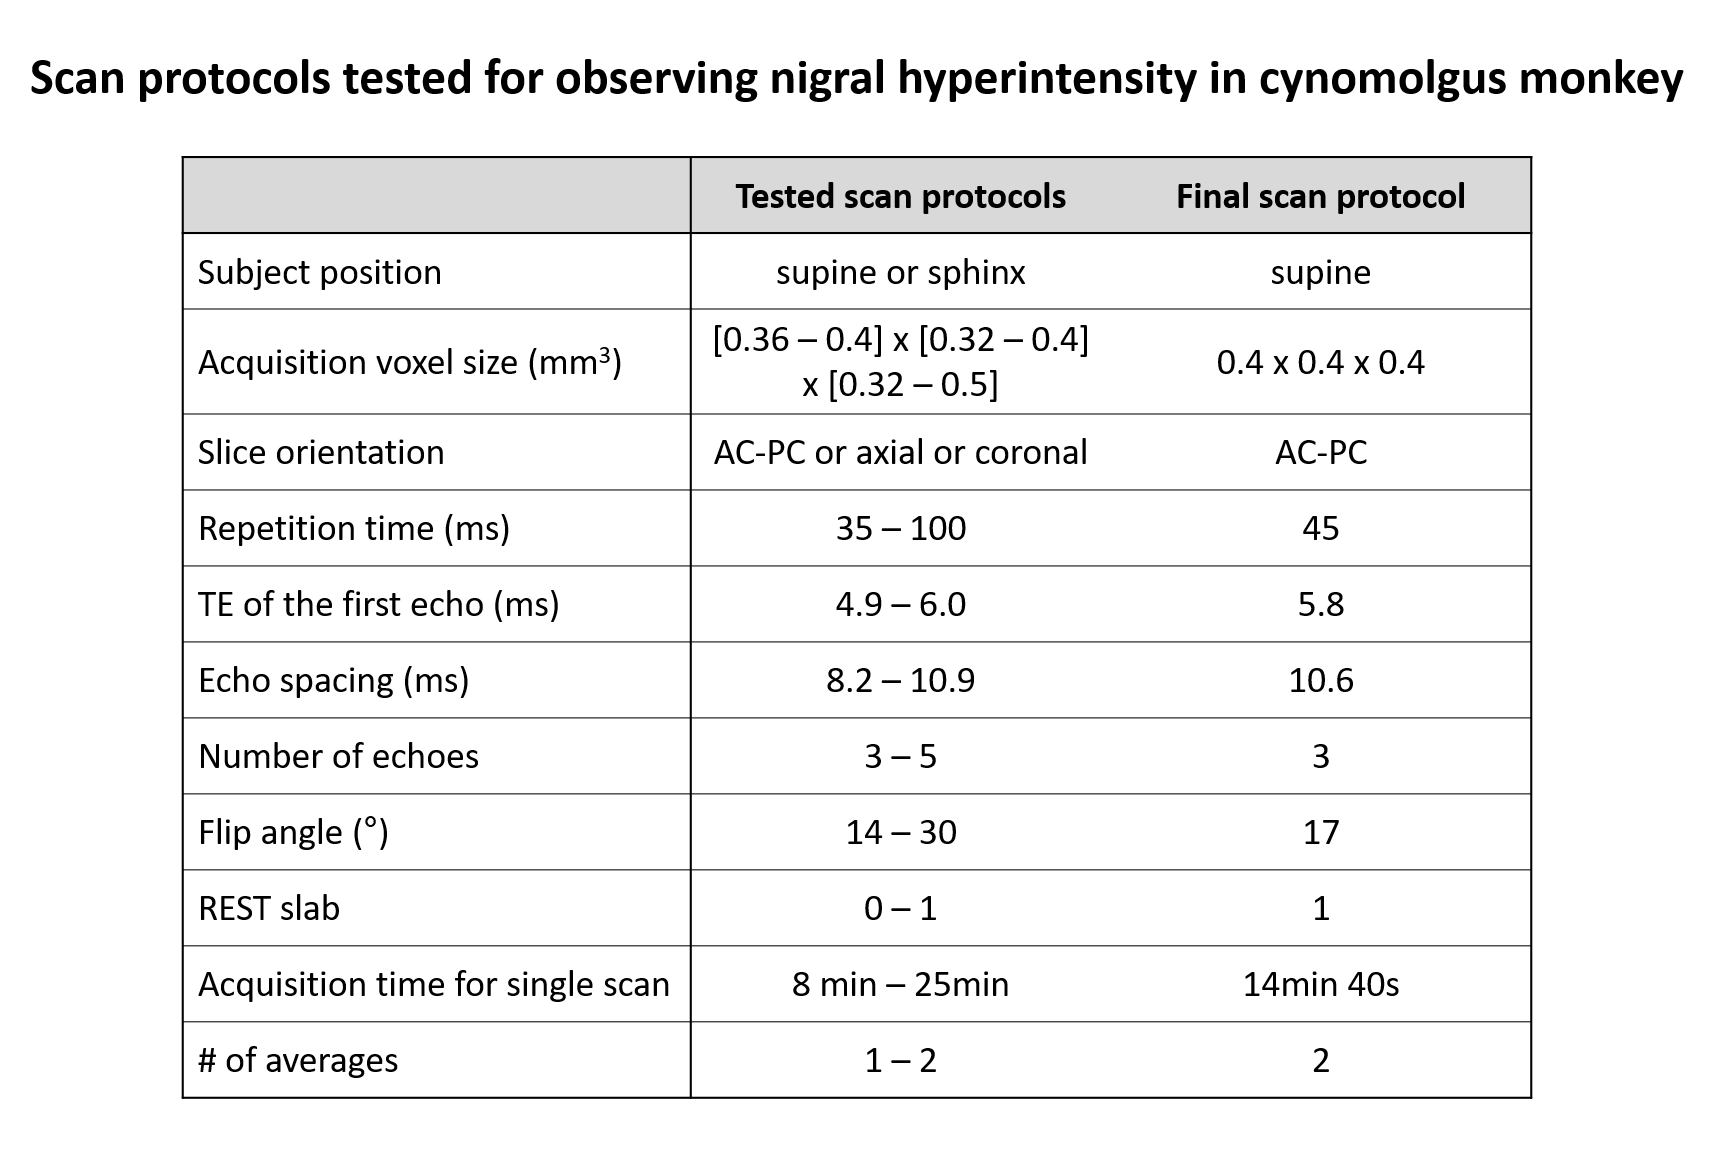
[Optimizing scan protocol]For optimizing the scan protocol, a total of nine healthy cynomolgus monkeys with ages from 5 to 18 years were examined at a 3T MRI system (Archieva, Philips) using a commercial 8-channel human knee coil. The images were acquired using a 3D multi-echo gradient-recalled echo (GRE) sequence. The tested scan protocols in the nine monkeys and the final protocol are summarized in Figure 1.
[Image processing]
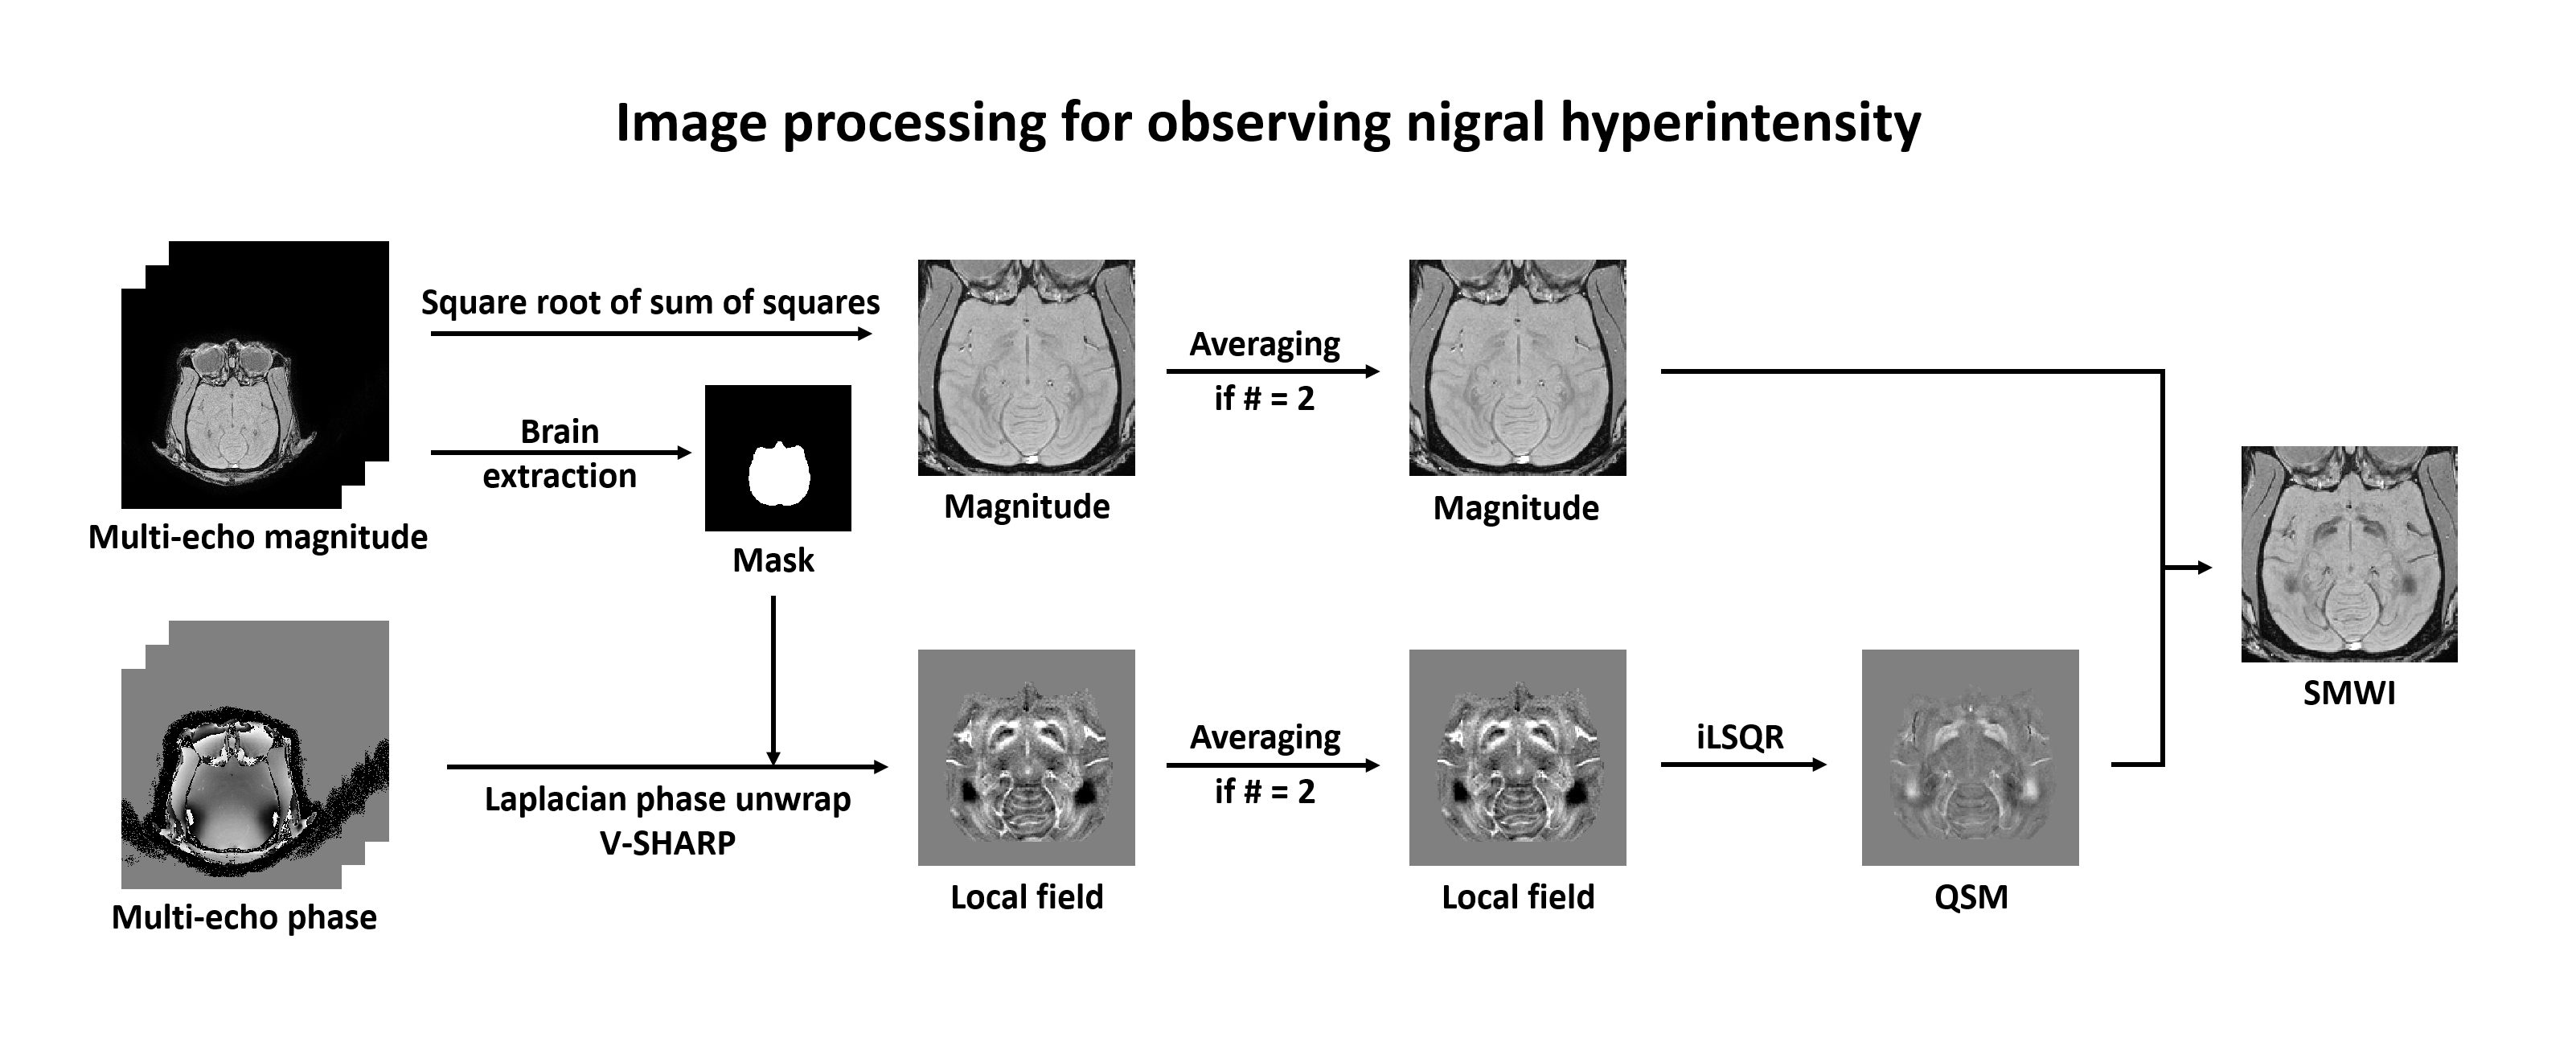
From the magnitude images of the multiple echoes, a single magnitude map was generated by the square root of the sum of squares over echoes. From the phase images of the multiple echoes, a local field map was generated using Laplacian phase unwrapping and V-SHARP background field removal method. When the scan was acquired twice, local field maps and magnitude maps from two scans were averaged after registration. Afterward, the QSM map was generated from the local field map by iLSQR, and the SMWI map was generated from the magnitude image and QSM map as suggested.3 The overall image processing is summarized in Figure 2.
[Human subjects]
To compare the nigral hyperintensity patterns between monkeys and humans, SMWI images were reconstructed from thirteen healthy human subjects (age: 27 ± 2.9 years). Out of the thirteen subjects, one subject was examined at a 3T MRI system (Prisma, Siemens Healthineers) and twelve subjects were from the COSMOS dataset of the previous study.5 The resolution of the image was 0.8 x 0.8 x 1.2 mm3 for one subject and 1 x 1 x 1 mm3 for twelve subjects, and the scan time was 5 min 3-40s for each scan.
[ROI analysis]
The QSM values in substantia nigra were measured by manually segmenting the region of interest (ROI) for substantia nigra both in monkeys and humans. A linear model was applied to analyze a trend between QSM values in substantia nigra and the ages of the monkeys.
Results
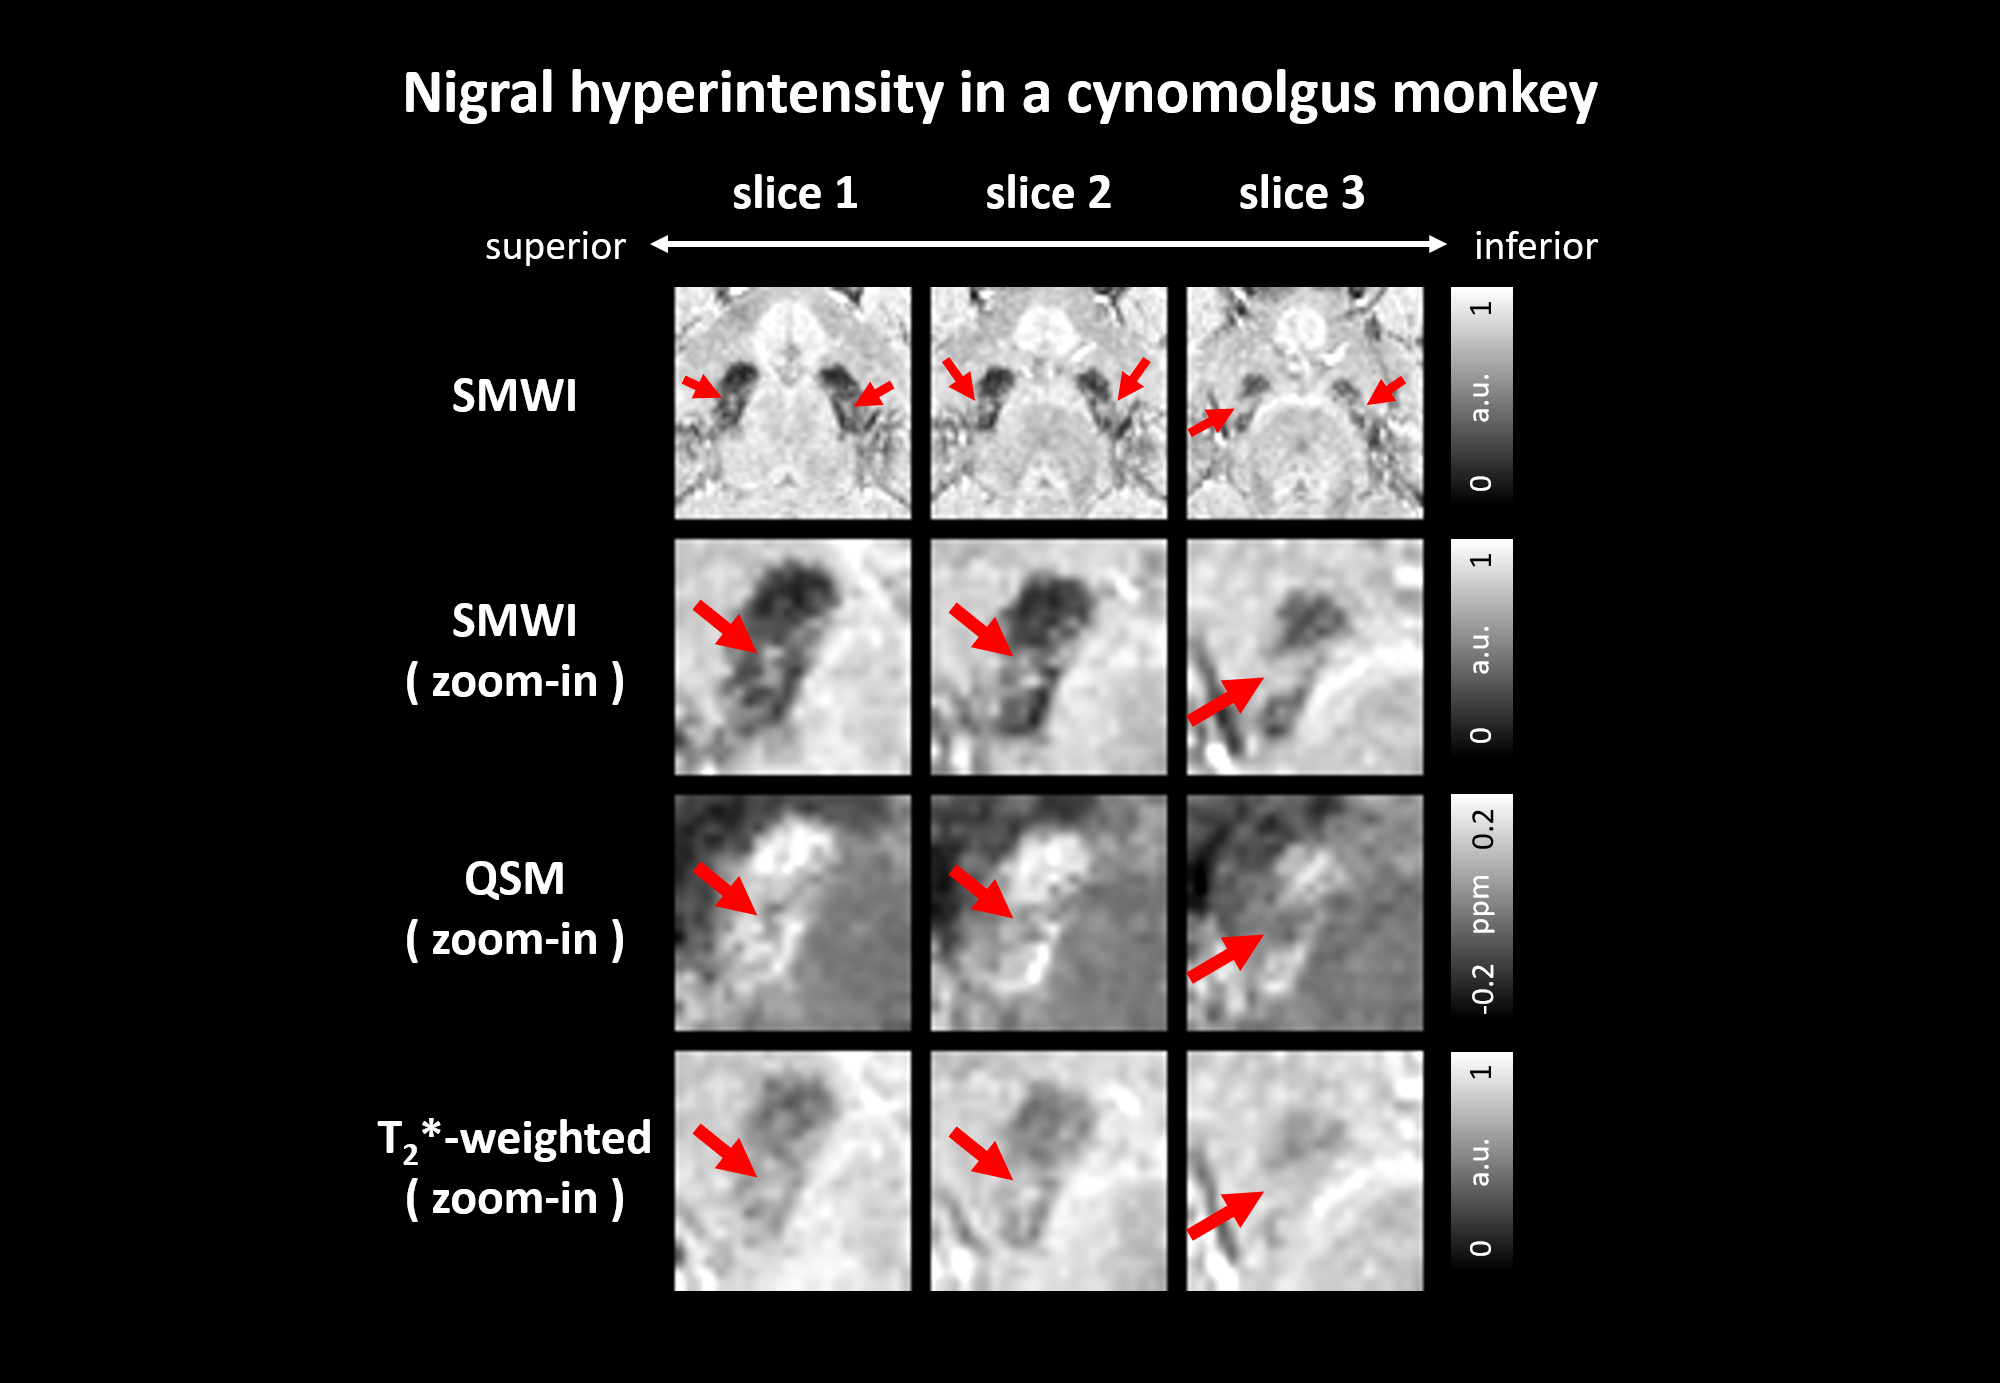
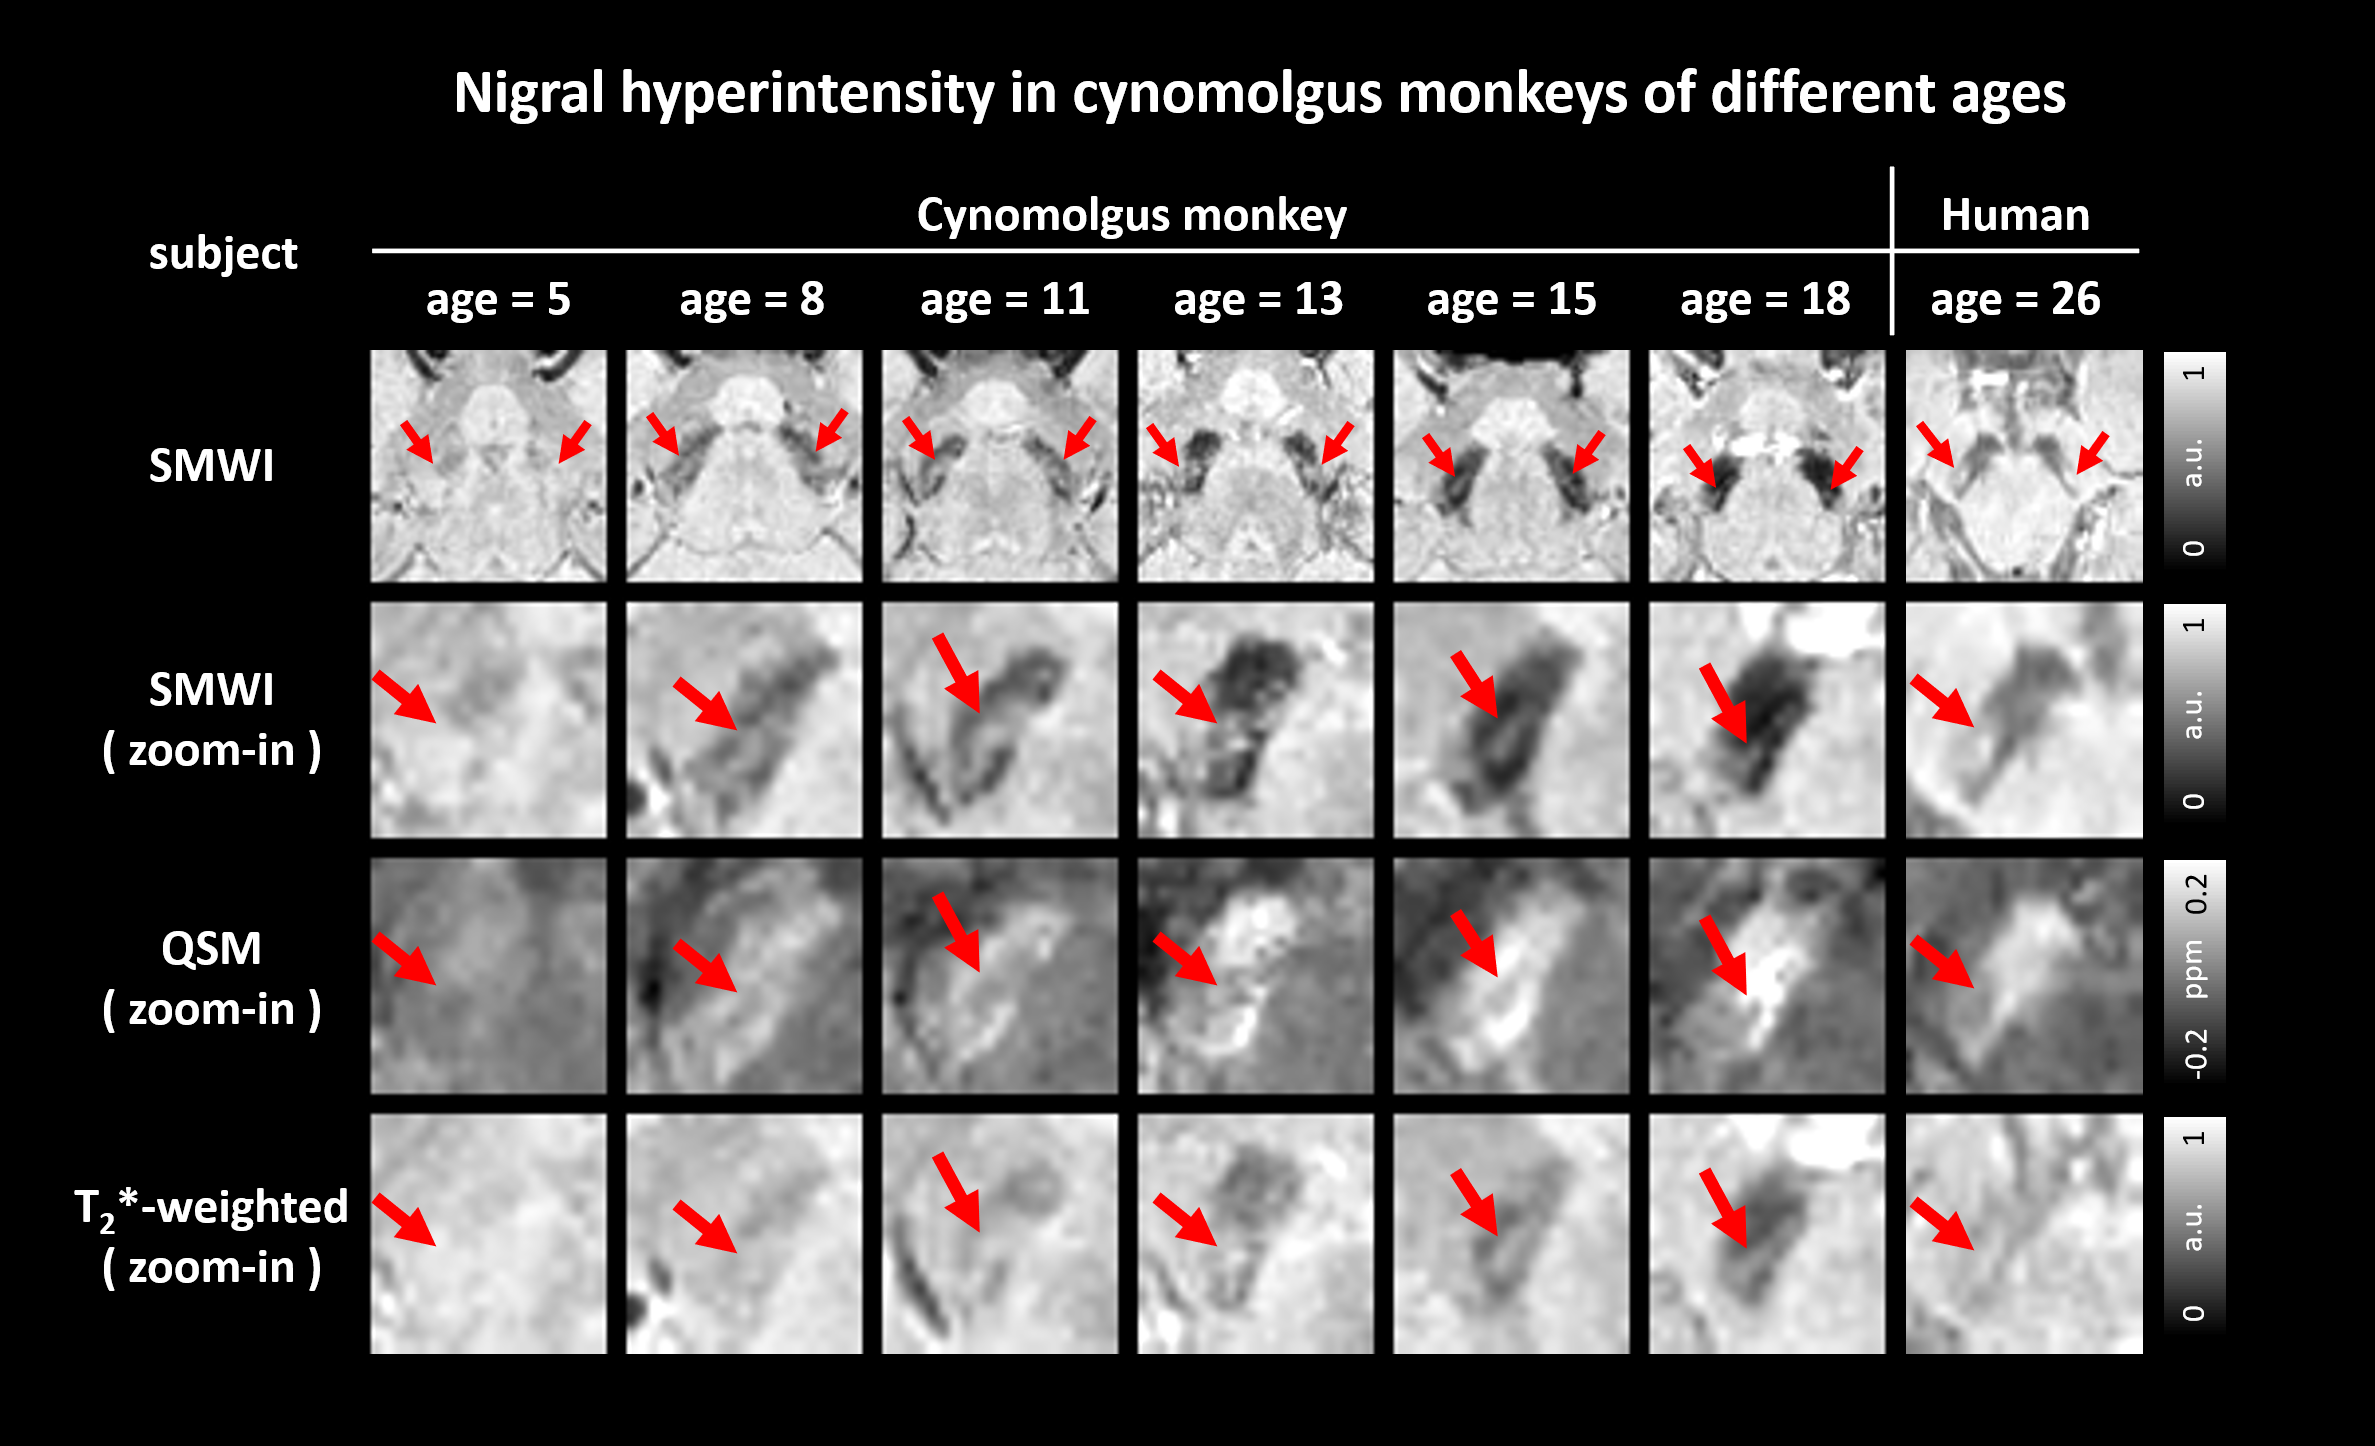
Figure 3 shows the nigral hyperintensity images in three consecutive slices from a cynomolgus monkey. The nigral hyperintensity was observed in SMWI, and the same pattern was also observed in QSM and T2*-weighted images.Figure 4 shows the nigral hyperintensity images in cynomolgus monkeys over a wide range of ages. The images reveal that the nigral hyperintensity is noticeable in monkeys, while the signature is best-identified in old animals (≥ 8 years) using SMWI images. When comparing the hyperintense patterns of the monkeys and humans, the hyperintense patterns of the aged monkeys (≥ 13 years) are similar to that of the human.
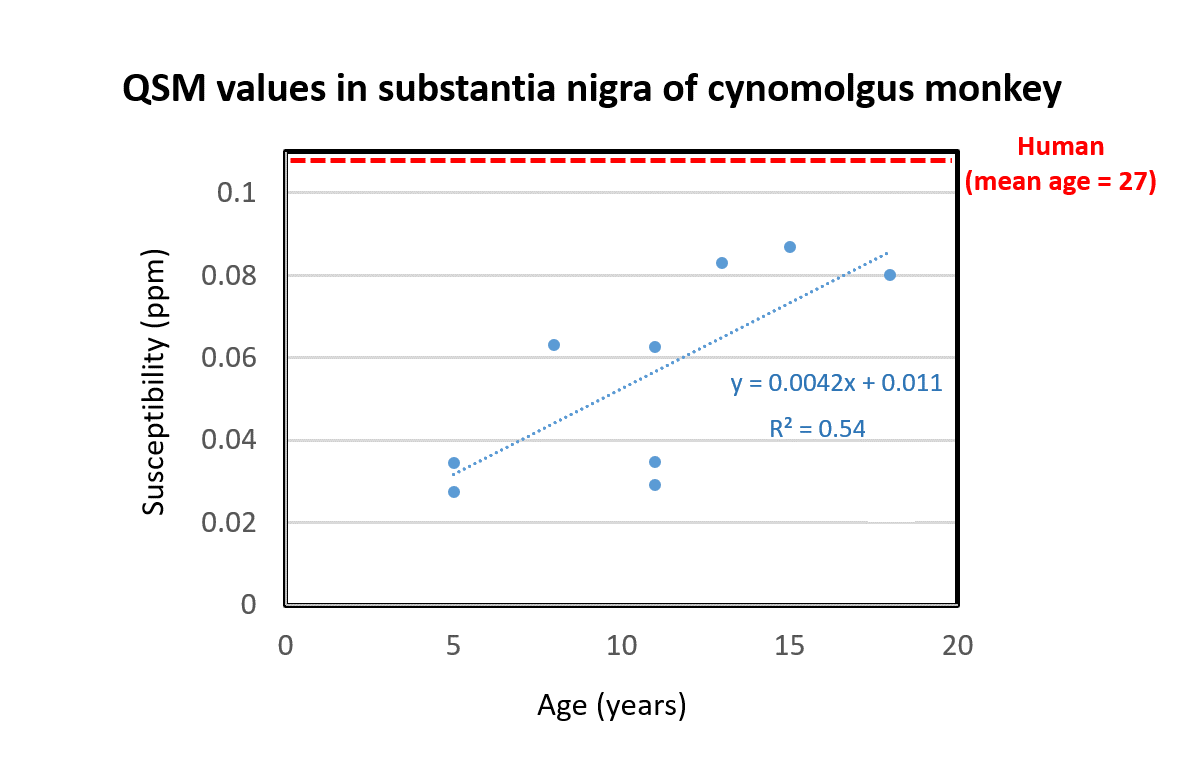
When the trend between QSM values in the substantia nigra and ages of the monkeys is explored, a linear trend is observed, reporting increased susceptibility with aging (Figure 5; y = 0.0042x + 0.011 with R2 = 0.54). In humans, the mean ± standard deviation of the QSM values of the thirteen healthy subjects was 0.11 ± 0.02. When the QSM values of the monkeys and humans are compared, the QSM values of the monkeys become closer to that of the humans as the monkeys get older.
Discussion and Conclusion
In summary, we observed hyperintensity within substantia nigra in healthy cynomolgus monkeys. This hyperintense pattern was best observed in aged animals using SMWI but also can be identified in other susceptibility-related images and younger animals. Furthermore, in the aged animals, the hyperintensity pattern was similar to that of humans. This pattern is suggested to indicate nigrosome-16 and has been utilized as a biomarker for PD in humans. Future investigations may explore the change of this hyperintense pattern in the cynomolgus monkey model of PD.Acknowledgements
This work has been supported by Heuron Co. Ltd. and by the Korea government (MSIT) (No.NRF-2021R1A2B5B03002783)References
1. Kwon, D. H. et al. Seven-tesla magnetic resonance images of the substantia nigra in Parkinson disease. Am. Neurol. Assoc. 71, 267–277 (2012).
2. Schwarz, S. T. et al. The ‘swallow tail’ appearance of the healthy nigrosome - A new accurate test of Parkinson’s disease: A case-control and retrospective cross-sectional MRI study at 3T. PLoS One 9, (2014).
3. Nam, Y., Gho, S. M., Kim, D. H., Kim, E. Y. & Lee, J. Imaging of nigrosome 1 in substantia nigra at 3T using multiecho susceptibility map-weighted imaging (SMWI). J. Magn. Reson. Imaging 46, 528–536 (2017).
4. Dauer, W. & Przedborski, S. Parkinson’s Disease: Mechanisms and models. Neuron 39, 889–909 (2003).
5. Yoon, J. et al. Quantitative susceptibility mapping using deep neural network: QSMnet. Neuroimage 179, 199–206 (2018).
6. Blazejewska, A. I. et al. Visualization of nigrosome 1 and its loss in PD. Am. Acad. Neurol. 81, 534–540 (2013).
Figures