2371
QSM with Implicit Regularisation Using Non-Uniform Fourier Transformation1Medical Physics and Biomedical Engineering, University College London, London, United Kingdom
Synopsis
Direct solutions of the dipole inversion problem in quantitative susceptibility mapping (QSM) are computationally efficient but plagued by streaking artifacts. Here, we have shown that non-uniform sampling of frequency space can achieve additional streaking artifact reduction compared to QSM with thresholded k-space division and state-of-the-art regularisation. By avoiding sampling areas in frequency space where the solution is not well defined, the solution of the ill-posed inverse problem is made more robust and noise amplification is reduced. This approach could be combined with compressed sensing techniques to further improve the QSM reconstruction. This research uses open-source tools from the MR community.
Introduction
In quantitative susceptibility mapping (QSM), the goal is to reconstruct a local magnetic susceptibility distribution from measured global phase perturbations. Since these are related through a convolution with a dipole field ($$$D$$$ in k-space), the inverse problem is ill-posed. This ill-posed problem requires regularisation of the solution to avoid large (streaking) artefacts. Some examples of this regularisation include thresholding the dipole field kernel ($$$D^{-1}$$$) [1,2], using iterative reconstruction methods with regularisation such as a Tikhonov term [3,4] or, more recently, machine-learning-based approaches [5].Here, we used non-uniform Fourier transformations (nuFT) to constrain the problem to regions of the frequency domain where the inverse problem is well-posed. In this way, the direct solution of the problem can be computed without the need for explicit regularisation such as thresholding. Multiple frequency domain sampling strategies were compared using the simulated QSM challenge 2.0 [6] numerical phantom dataset which features a ground truth for error comparison. Finally, in-vivo results are presented to show how the method performs on real, noisy data.
Methods
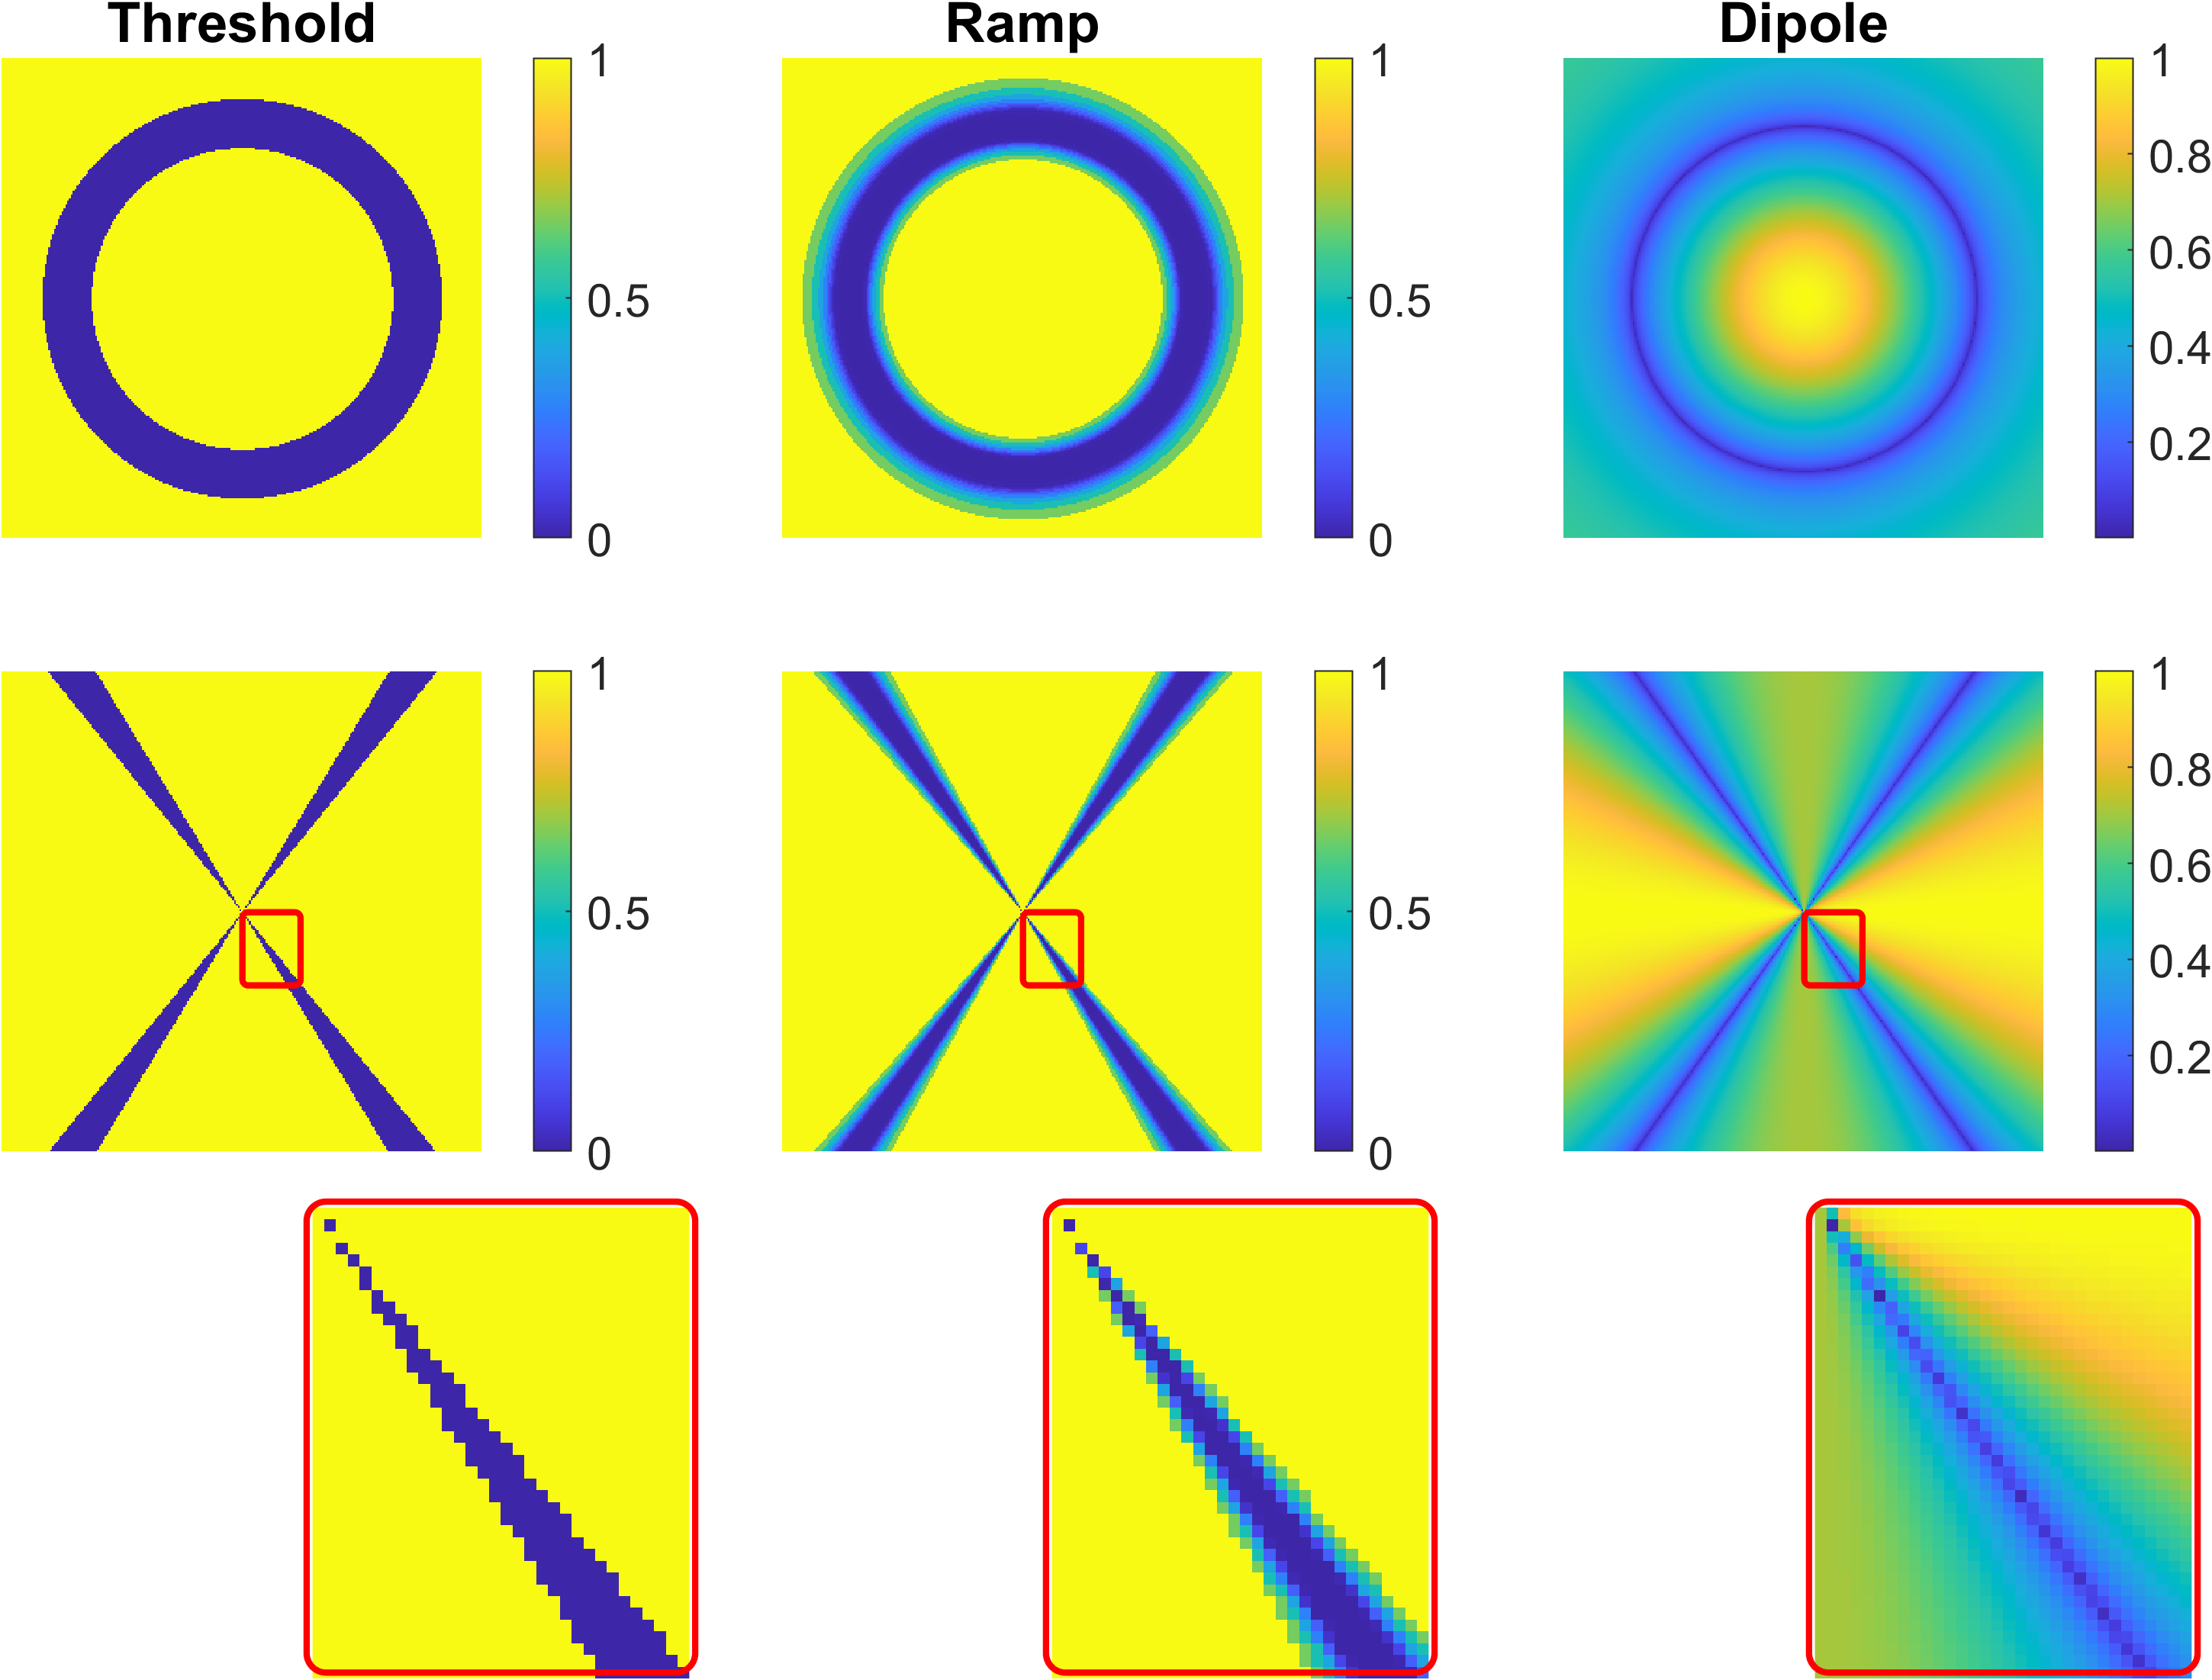
In all cases, the non-uniform Fourier transformation and its inverse were computed using the BART toolbox [7]. To investigate the impact of sampling density patterns, three distinct patterns were compared: 1) Threshold: A uniform randomly sampled frequency space in which the samples within the ill-posed region (below a threshold of 1/16 on $$$|D|$$$ as found in [8]) were discarded; 2) Ramp: A pattern in which areas where the k-space dipole is large are sampled uniformly with a linear ramp down in sampling density towards the zeros in $$$D$$$ (i.e. a linear ramp from $$$|D|$$$= 1/10 to 1/32, covering the edge of the ill-posed region [8], with no samples below that); and 3) Dipole: A sampling pattern that follows the magnitude of the dipole field in k-space to the 8th power ($$$|D^8|$$$) , i.e., more samples in areas where the magnitude of the dipole field is larger (and thus the inverse problem “more” well posed) and fewer samples where $$$D$$$ is small and the problem is ill-posed. Figure 1 illustrates all three sampling patterns. NuFT QSM with these different sampling patterns was compared to thresholded k-space division (TKD [1,2,4], with an optimal threshold of 2/3 [2]). These direct methods (TKD and nuFT) used $$$3\times$$$ oversampling in k-space (zero padding) and the results were corrected for susceptibility underestimation [2]. These direct methods were also compared with a state-of-the-art iterative Tikhonov reconstruction ($$$\alpha = 0.004$$$) [3,4] and a cutting-edge non-linear algorithm with total variation regularisation (nlTV, $$$\alpha = 10^{-4}$$$) [9-11]. For all sampling patterns and methods, errors were computed relative to the synthetic susceptibility map from the QSM 2.0 challenge [6] and quantified using a susceptibility-tuned metric, XSIM [12]. Finally, QSM with the nuFT sampling pattern that performed best in the numerical phantom was compared to the TKD, iterative Tikhonov ($$$\alpha = 0.05$$$) and nlTV ($$$\alpha = 10^{-7}$$$) QSM reconstructions on a local field map of the brain of a healthy volunteer acquired using high (1mm isotropic) resolution 3D GRE in vivo as described in [13]. All computations were performed using MATLAB (Natick, MA, USA) on an Intel i9-10920x (12 core) CPU with 64Gb of RAM.Results
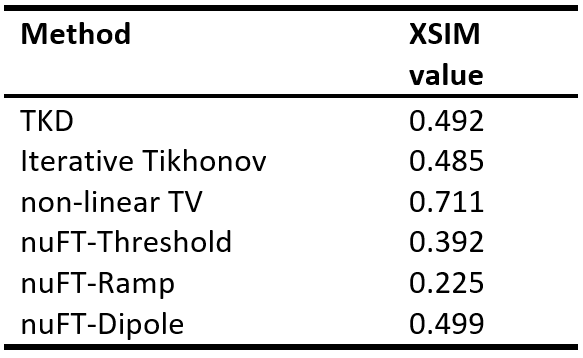
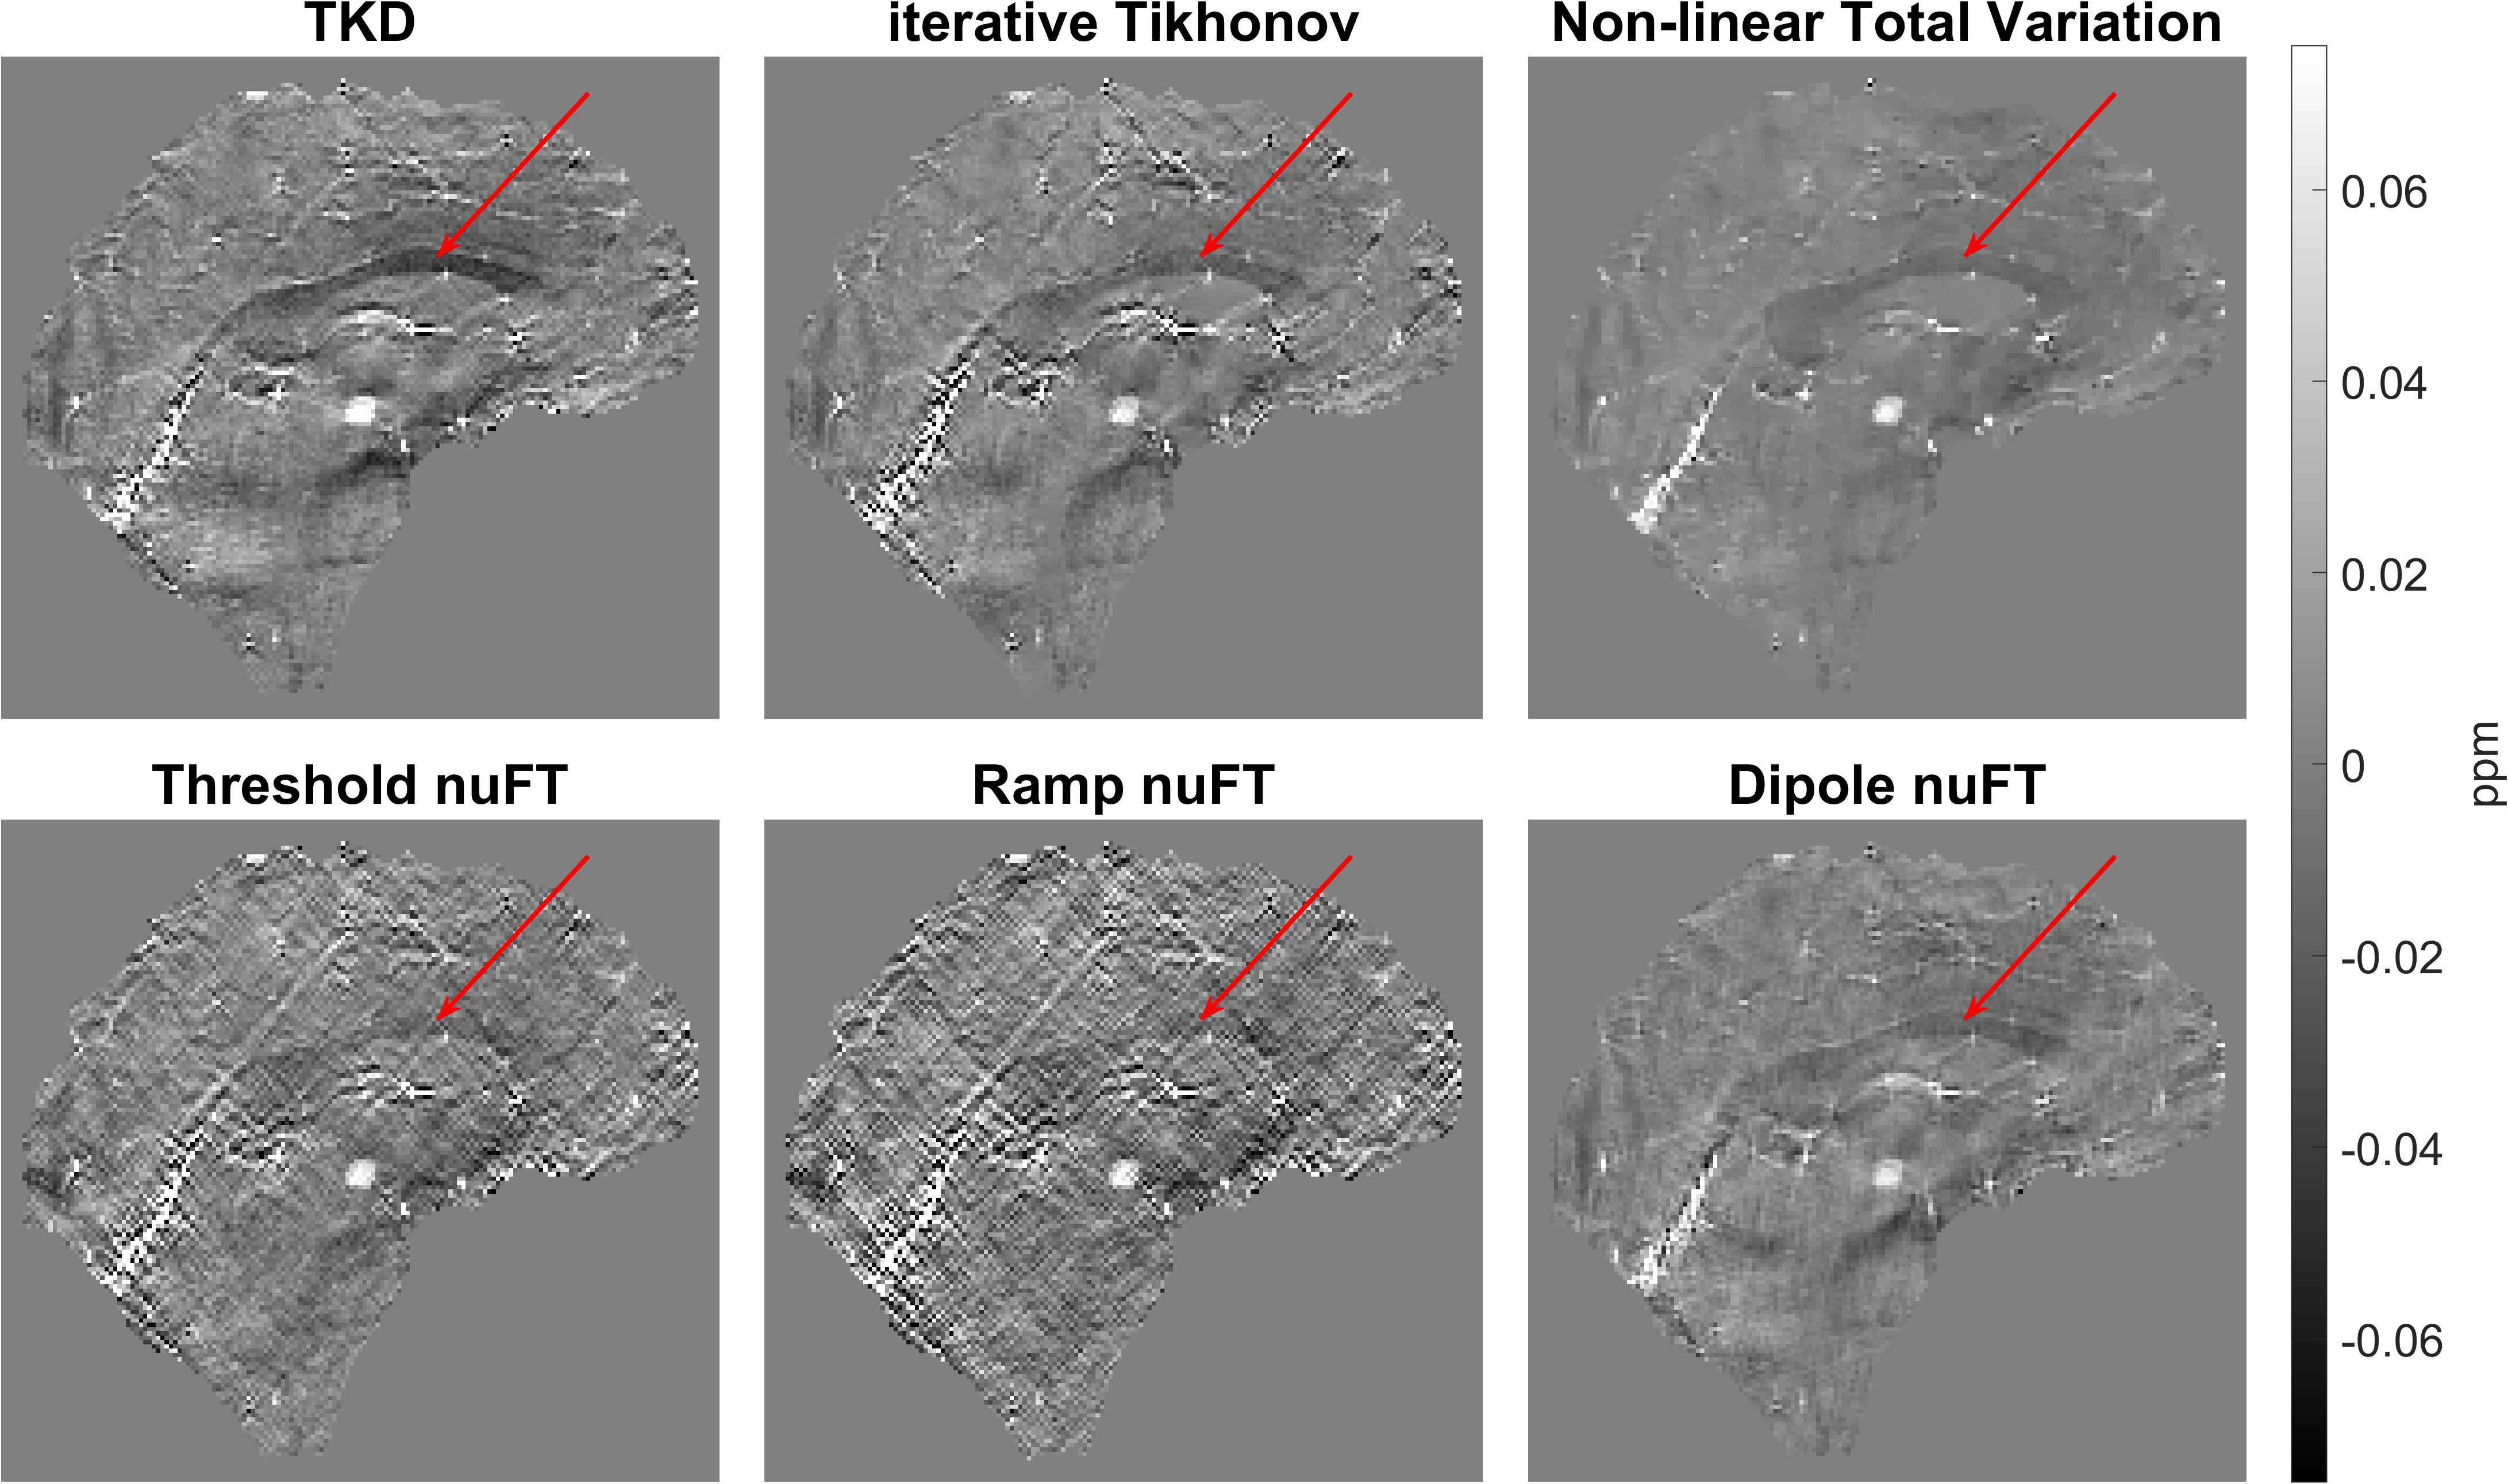
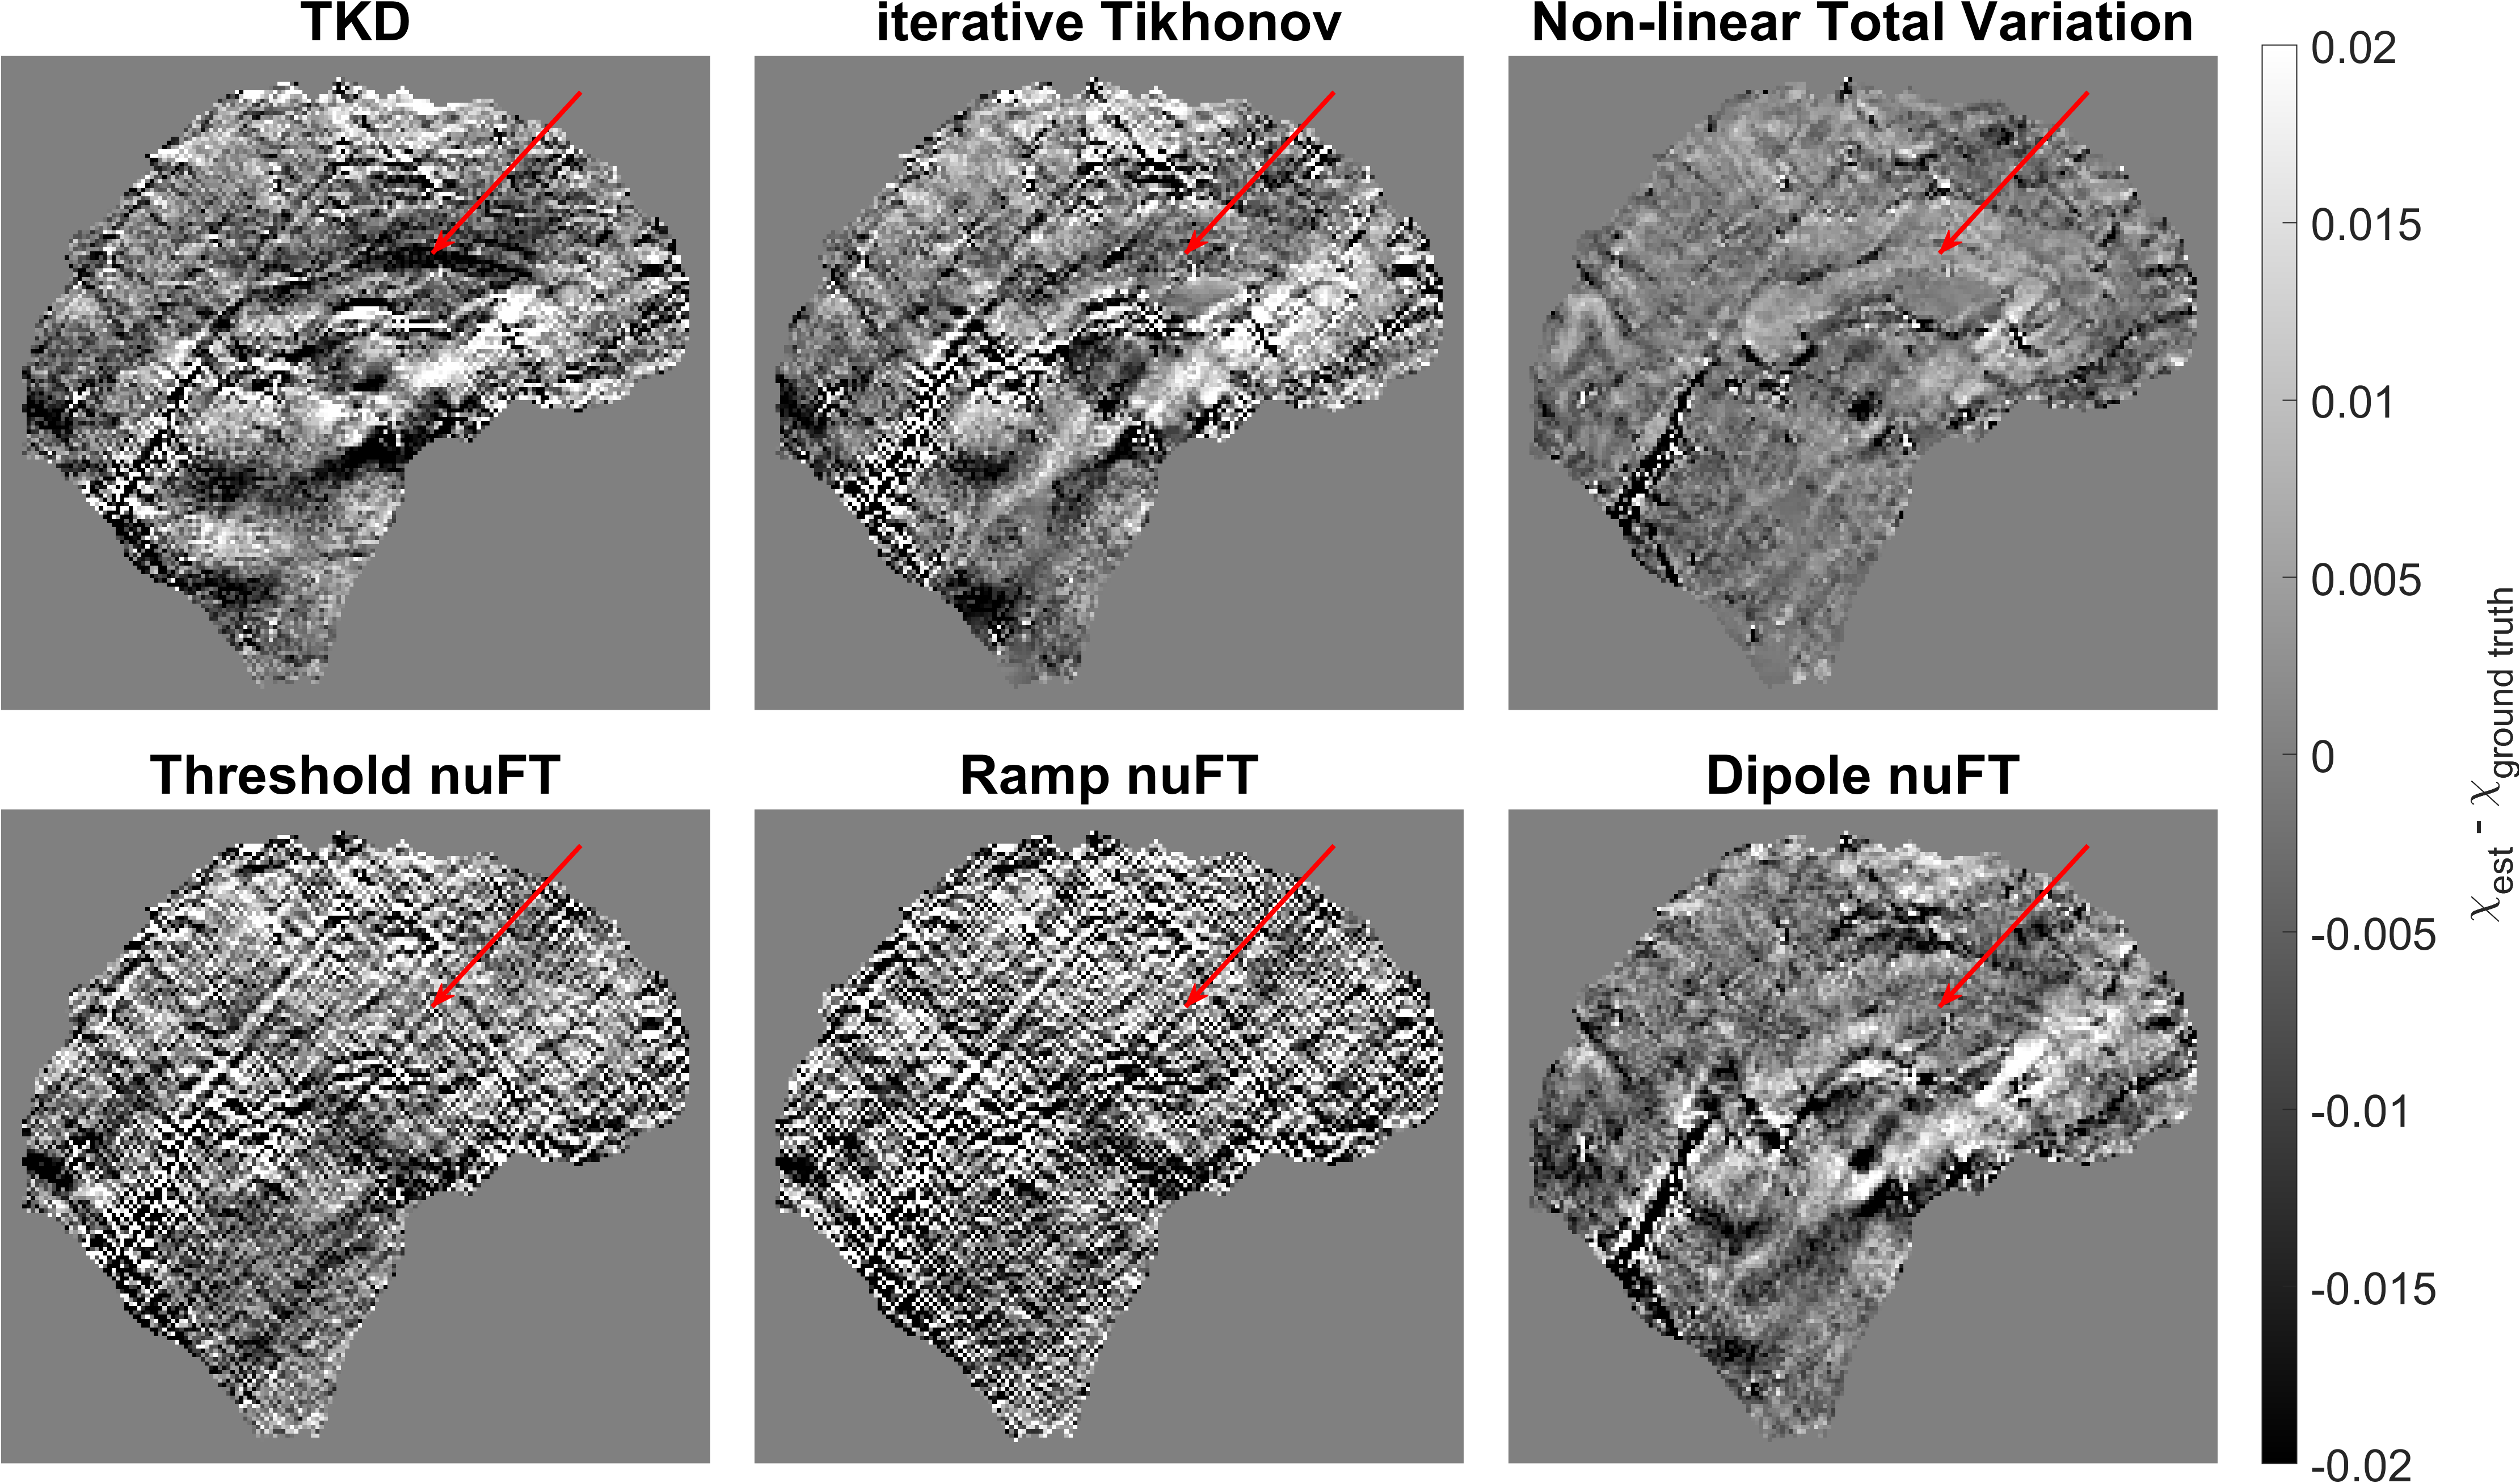
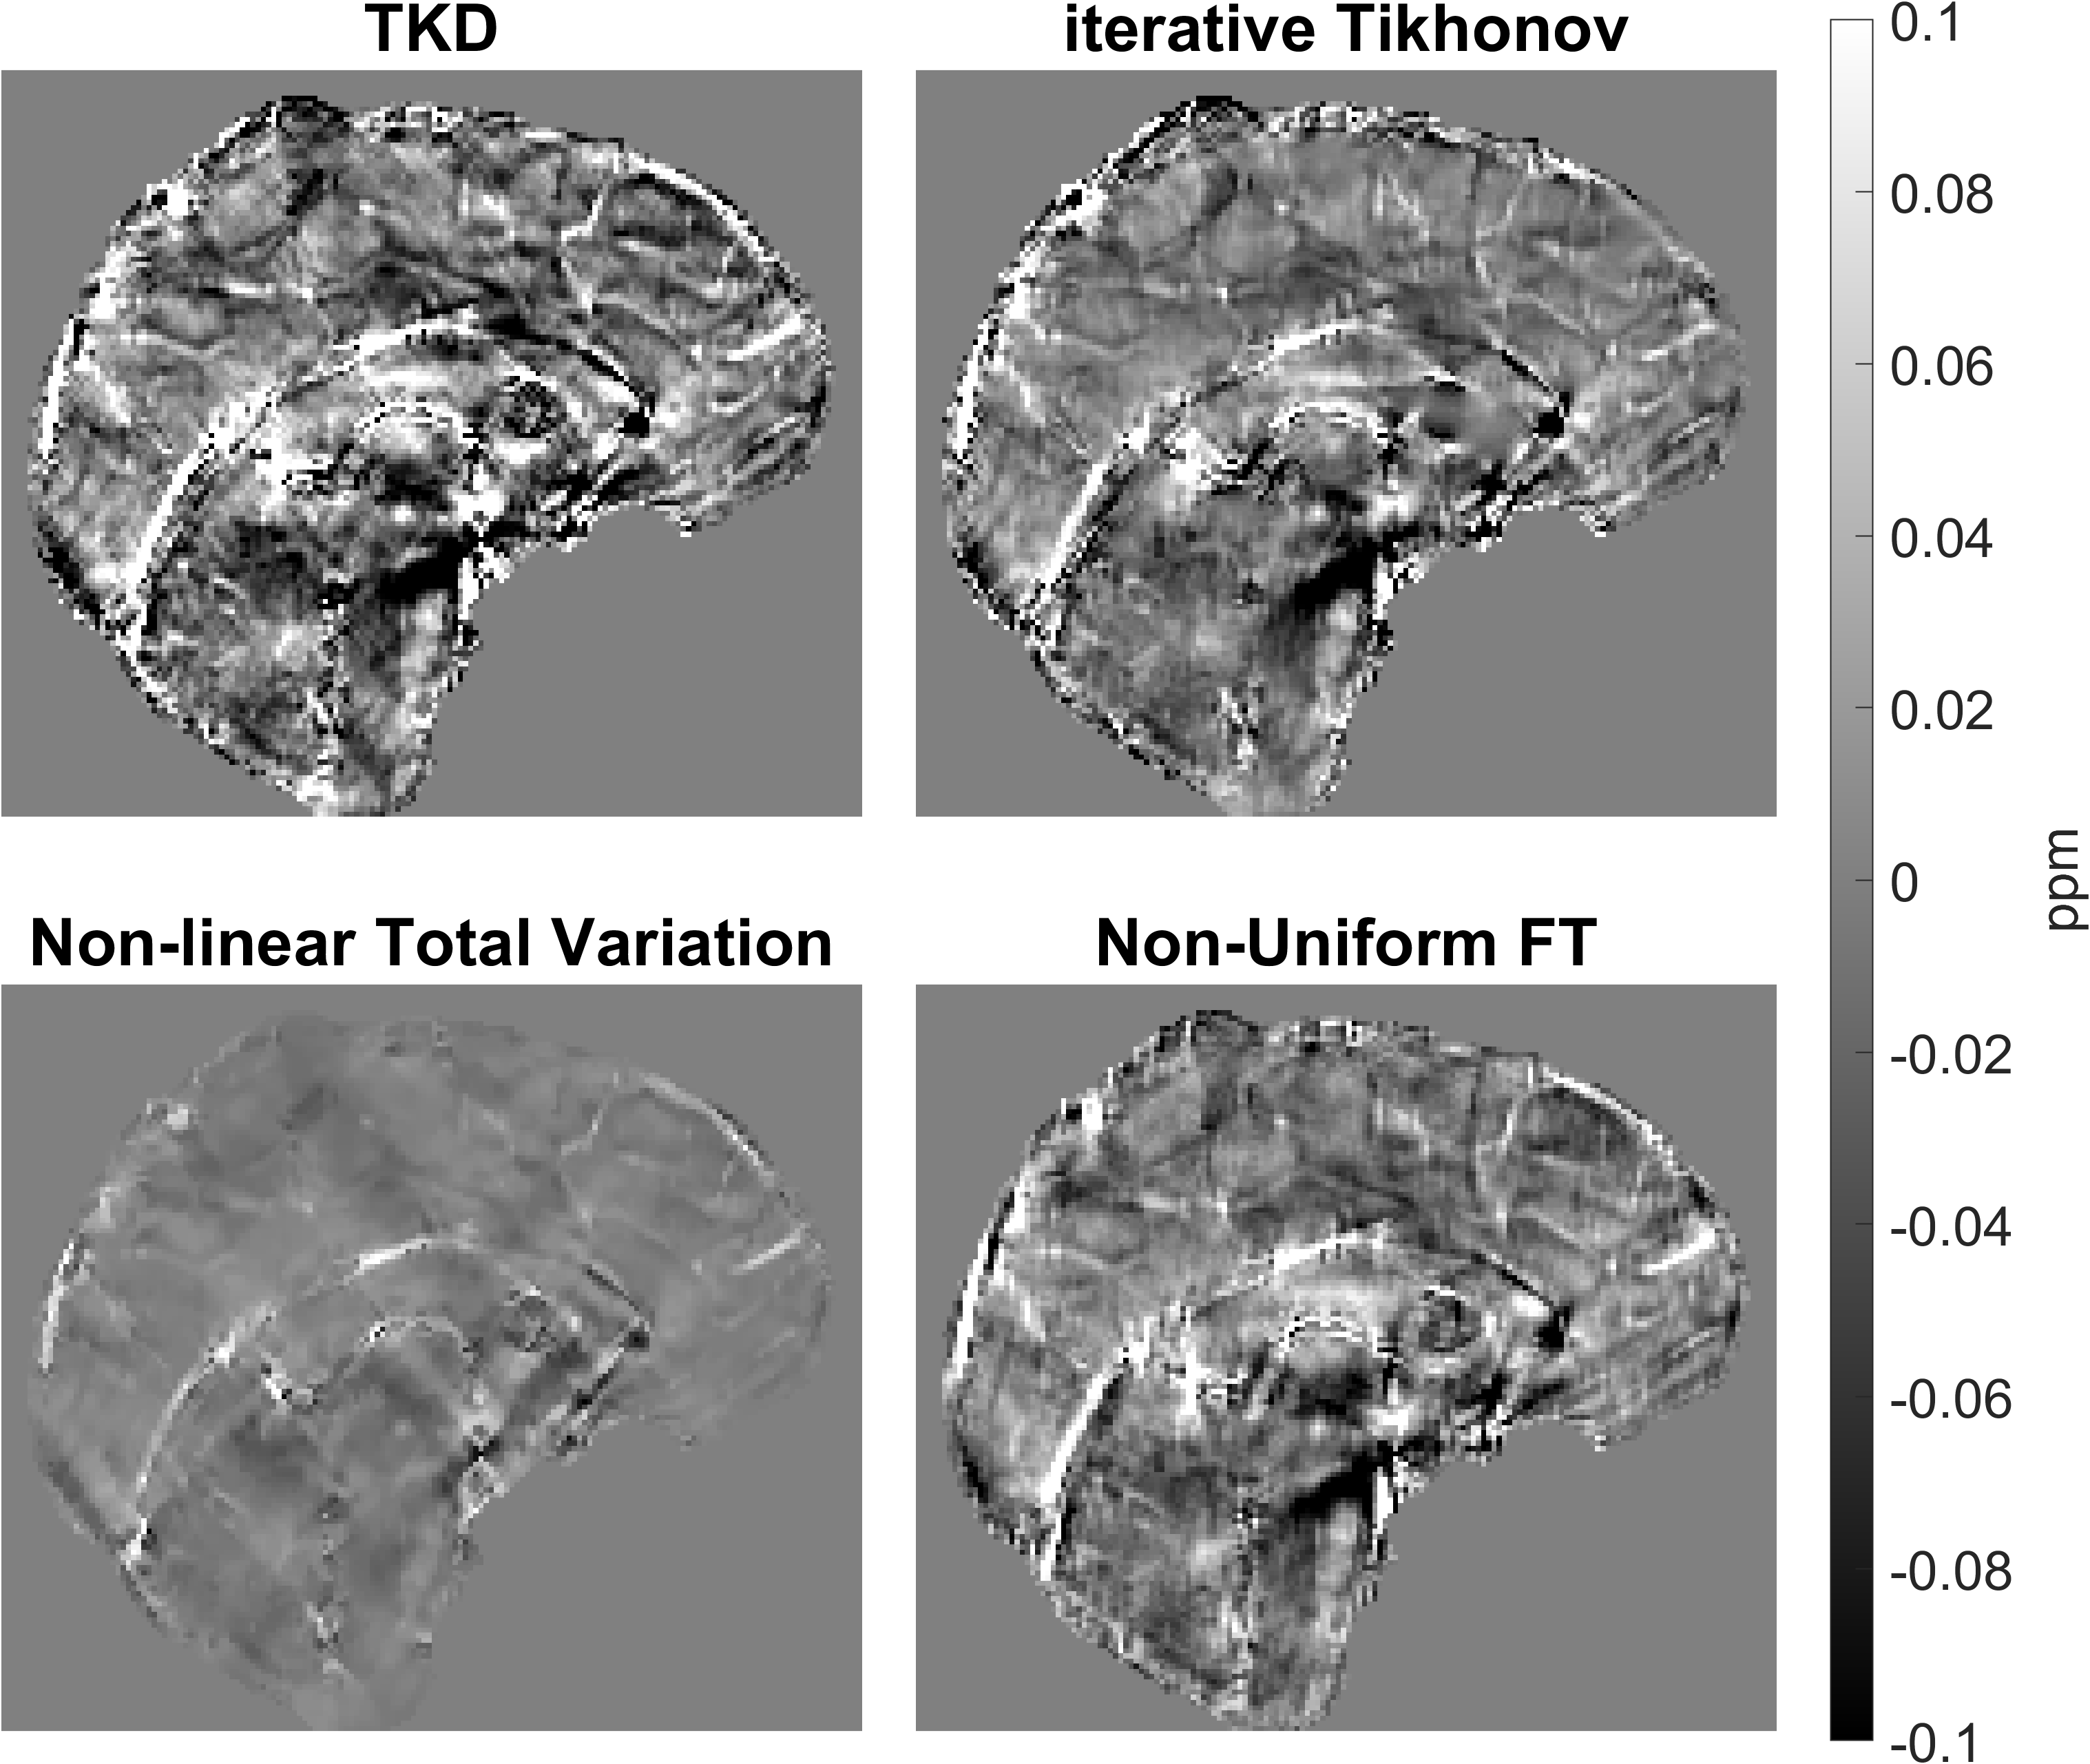
The numerical phantom results are shown in Figures 2-4. Figure 2 contains a table of the XSIM similarity measures of the reconstructed susceptibility distributions where 0 is the lowest and 1 is a perfect reconstruction. Figure 3 contains the susceptibility reconstructions, and Figure 4 shows the error maps of all the reconstructions. Figure 5 shows the susceptibility distributions reconstructed in vivo, where the nuFT reconstructions were computed in 107 seconds, TKD in 0.2 seconds, iterative Tikhonov in 1.2 seconds and nlTV in about 43 seconds.Discussion
Based on the errors shown in Figure 4, our nuFT approach avoids some of the underestimation of the corpus callosum visible in the TKD method (arrows, Figures 3, and 4). Of the three different nuFT sampling density patterns, the dipole-based pattern performs best and outperforms TKD in terms of the XSIM although these two reconstructions are very similar overall. In vivo and in silico, it seems that the nuFT method is more accurate than TKD as it provides less susceptibility contrast (like nlTV) and reduces streaking which may appear as reduced overall signal. These direct (nuFT) methods are not expected to compete with nlTV due to their limited regularisation options.Conclusion
Here, we investigated the effect of non-uniform sampling of frequency space for direct QSM. This nuFT approach resulted in fewer streaking artefacts and a higher XSIM than other direct and iterative reconstructions (TKD and iterative Tikhonov) without using extra explicit regularisation. NuFT also provides detailed control and insight into the dipole kernel ($$$D^{-1}$$$) in the spatial frequency domain and could be combined with compressed sensing techniques [14] to further improve QSM reconstruction. Application of this nuFT method to the nonlinear dipole model [15], or in iterative schemes [3,11] may be interesting, combining non-uniform sampling with explicit regularisation methods to correct for some of the observed differences in contrast while avoiding over-regularisation due to the flexibility afforded by sampling only the well-posed region of the frequency domain.Acknowledgements
Both authors are supported by European Research Council Consolidator Grant DiSCo MRI SFN 770939References
[1] Shmueli et al., Magnetic susceptibility mapping of brain tissue in vivo using MRI phase data Magn. Res. Med., 2009
[2] Schweser et al., Quantitative susceptibility mapping for investigating subtle susceptibility variations in the human brain, Magn. Res. Med.,2012
[3] Karsa et al., An optimized and highly repeatable MRI acquisition and processing pipeline for quantitative susceptibility mapping in the head‐and‐neck region, Magn. Res. Med., 2020
[4] https://xip.uclb.com/product/mri_qsm_tkd
[5] Jung et al., Exploring linearity of deep neural network trained QSM: QSMnet, NMR Biomed., 2020
[6] Bilgic et al., QSM reconstruction challenge 2.0: Design and report of results, Magn. Res. Med., 2021
[7] Uecker et al., Berkeley advanced reconstruction toolbox. ISMRM 2015
[8] Schweser et al., Quantitative susceptibility mapping for investigating subtle susceptibility variations in the human brain, Neuroimage 2012
[9] https://gitlab.com/cmilovic/FANSI-toolbox
[10] Bilgic et al., Sparse Methods for Quantitative Susceptibility Mapping; Wavelets and Sparsity XVI, SPIE 2015
[11] Milovic et al., Fast Nonlinear Susceptibility Inversion with Variational Regularization, Magn. Res. Med., 2017
[12] Milovic et al., Structural Similarity Index Metric setup for QSM applications (XSIM), Workshop on MRI Phase Contrast & QSM, 2019
[13] Karsa et al., The effect of low resolution and coverage on the accuracy of susceptibility mapping, Magn. Res. Med., 2019.
[14] De Leeuw et al., Inversion of incomplete spectral data using support information with an application to magnetic resonance imaging, J. Phys.Comm., 2021
[15] Polak et al., Nonlinear dipole inversion (NDI) enables robust quantitative susceptibility mapping (QSM), NMR Biomed., 2020
Figures