2369
The effect of echo train length and TE range on multi-echo quantitative susceptibility mapping.1NMR Research Unit, Queen Square MS Centre, Department of Neuroinflammation, UCL Queen Square Institute of Neurology, University College London, London, United Kingdom, 2Department of Medical Physics and Biomedical Engineering, University College London, London, United Kingdom, 3Multiple Sclerosis Centre of Catalonia (Cemcat), Vall d’Hebron Institute of Research, Vall d’Hebron Hospital Campus, Barcelona, Spain, 4Radiomics Group, Vall d’Hebron Institute of Oncology, Vall d’Hebron Hospital Campus, Barcelona, Spain, 5Centre for Medical Image Computing (CMIC), Department of Medical Physics and Biomedical Engineering, University College London, London, United Kingdom, 6Universitat Oberta de Catalunya, Barcelona, Spain, 7Department of Brain and Behavioral Sciences, University of Pavia, Pavia, Italy, 8Brain Connectivity Centre, IRCCS Mondino Foundation, Pavia, Italy
Synopsis
Quantitative susceptibility mapping (QSM) from multi-echo acquisitions provides more accurate results than single echo, but the optimal choice of echo train length and echo time (TE) range requires investigation. In this work, we showed that QSM values depend on the TE range sampled, so QSM data computed over different TE ranges should not be mixed. Dropping later echoes might help resolve echo-to-echo phase inconsistency artifacts, at the expense of QSM accuracy. Finally, in multi-centre studies using data acquired with different TE settings, covering the same total TE range is preferable to simply matching the number of echoes.
Introduction
Clinical applications of quantitative susceptibility mapping (QSM) are increasing rapidly. In multiple sclerosis (MS), QSM has been shown to be a promising biomarker for demyelination and iron deposition, particularly in subcortical grey matter nuclei1. The QSM community has focused on investigating the effects of different reconstruction algorithms2,3, but it is also important to understand how different acquisition parameters affect QSM results4,5, particularly in the context of multi-centre clinical trials.Multi-echo acquisitions are known to provide more accurate QSM than single echoes6. However, it is not known what range or number of echo times (TE) is optimal. In this work, QSM was calculated from multi-echo gradient-echo scans, and both the effect of different echo train length, and the distribution of the echoes over the total TE range, were investigated in the context of a prospective MS clinical trial.
Methods
Cohort and MRI acquisition: The cohort consisted of 20 subjects: 8 controls and 12 MS patients, who were scanned on a Philips Ingenia 3.0T CX MR system. The MRI protocol included: 1) multi-echo 3D tilted sagittal spoiled gradient-echo (8 echoes, TE1/ΔTE=2.3/3.3 ms, TR=28.5 ms, flip angle=24°, 1x1x1 mm3 resolution) for QSM calculation, also covering the C2-C5 portion of the cervical spinal cord; 2) 3D sagittal T1-weighted (3DT1) MPRAGE (TE=3.2 ms, TR=6.9 ms, flip angle=8°, 1x1x1mm3 resolution) for tissue segmentation; 3) 3D sagittal FLAIR (TE=263.8 ms, TR=4800 ms, inversion time=1650 ms, flip angle=90°, 1x1x1 mm3 resolution) for lesion segmentation.Preprocessing: The GRE complex data for all 8 echoes were merged and reoriented to match the standard template (fslmerge, fslreorient2std)7. In MS patients, lesions were automatically segmented via NicMSlesions8, quality checked by expert clinicians, and subsequently used for lesion filling9 on the 3DT1 scans. Geodesic Information Flows (GIF)10 was then applied to the 3DT1 scans to produce brain tissue and parcellation masks.
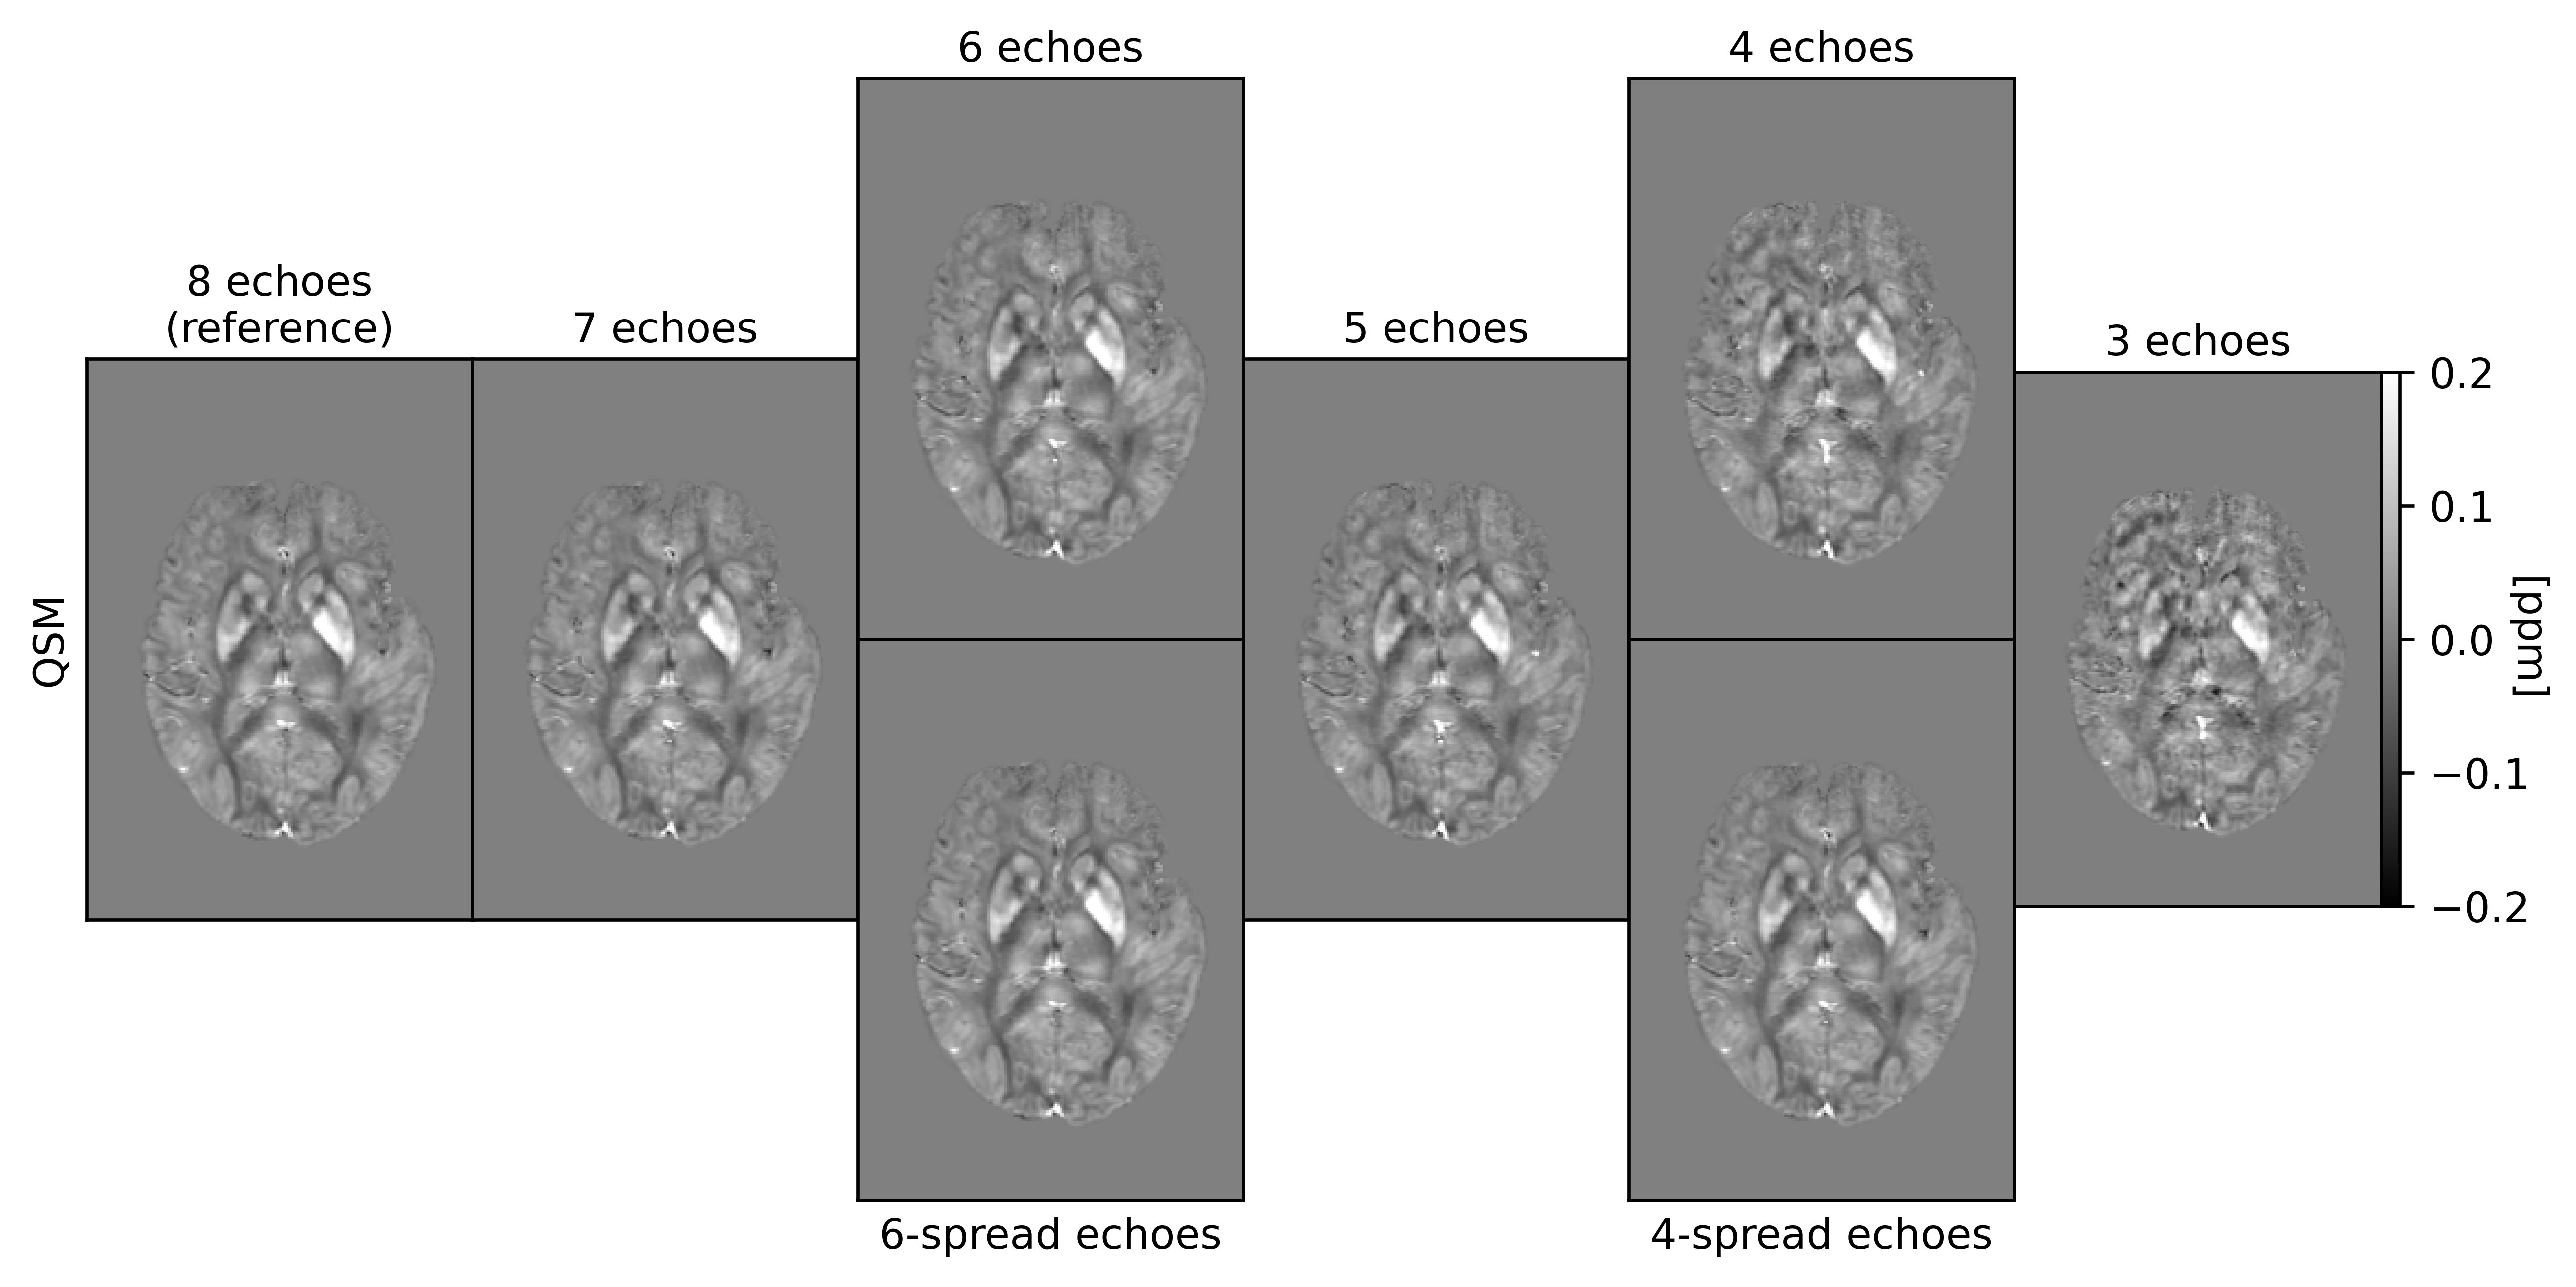
QSM: For QSM processing, the Morphology Enabled Dipole Inversion (MEDI) toolbox11, Rapid Opensource Minimum spanning treE algOrithm (ROMEO) v3.2.412, and MATLAB-2020a13 were used. The pipeline involved: 1) removal of any echo-dependent linear phase gradient, 2) nonlinear field fitting14, 3) Laplacian phase unwrapping15, 4) background field removal by projection onto dipole fields16, and 5) susceptibility calculation using iterative Tikhonov regularization17 with regulariser weight α=0.05. GIF whole-brain masks were dilated by one voxel (fslmaths), followed by noise-based mask erosion18. The oblique images were rotated into alignment with the main magnetic field after step 3)19. QSM processing was performed using all 8 echoes (referred to as the “reference”), and then repeated, progressively dropping later echoes, down to the first 3 echoes required for the non-linear fit. QSM was then also calculated over 6 and 4 echoes spread across the total TE range. The effect of a shorter echo train length was assessed also in terms of artefact removal in the presence of echo-to-echo phase inconsistencies.
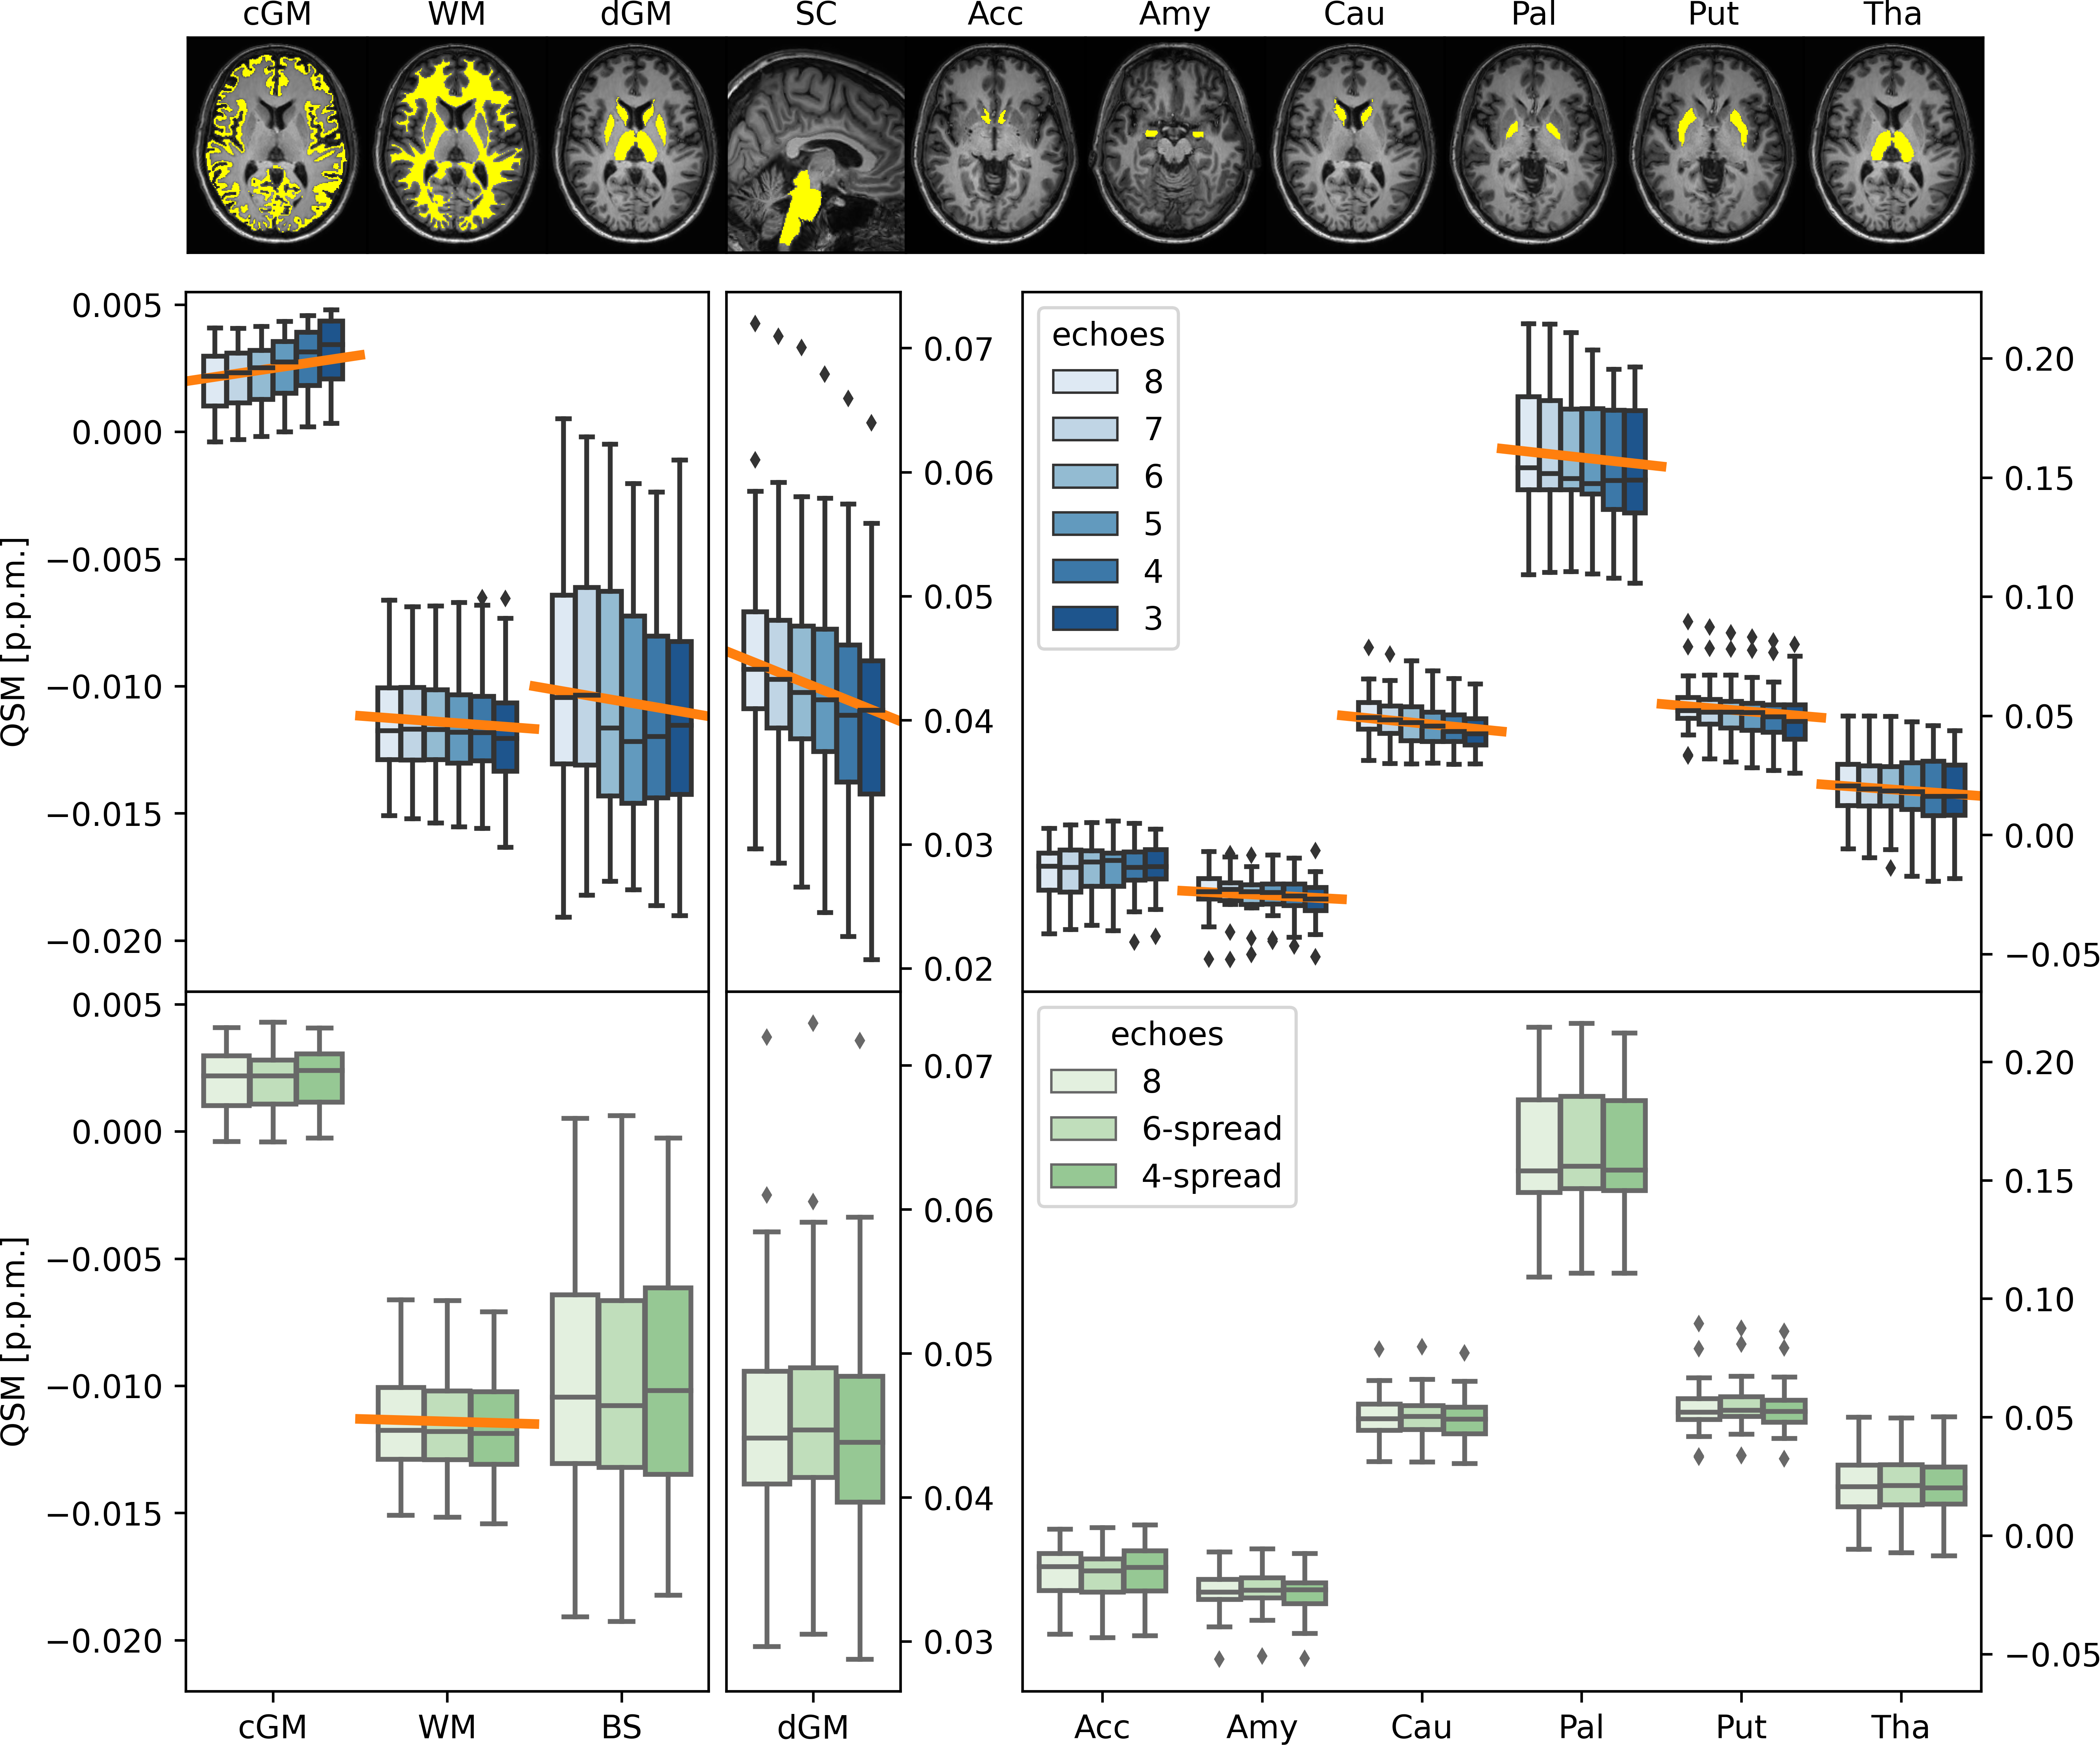
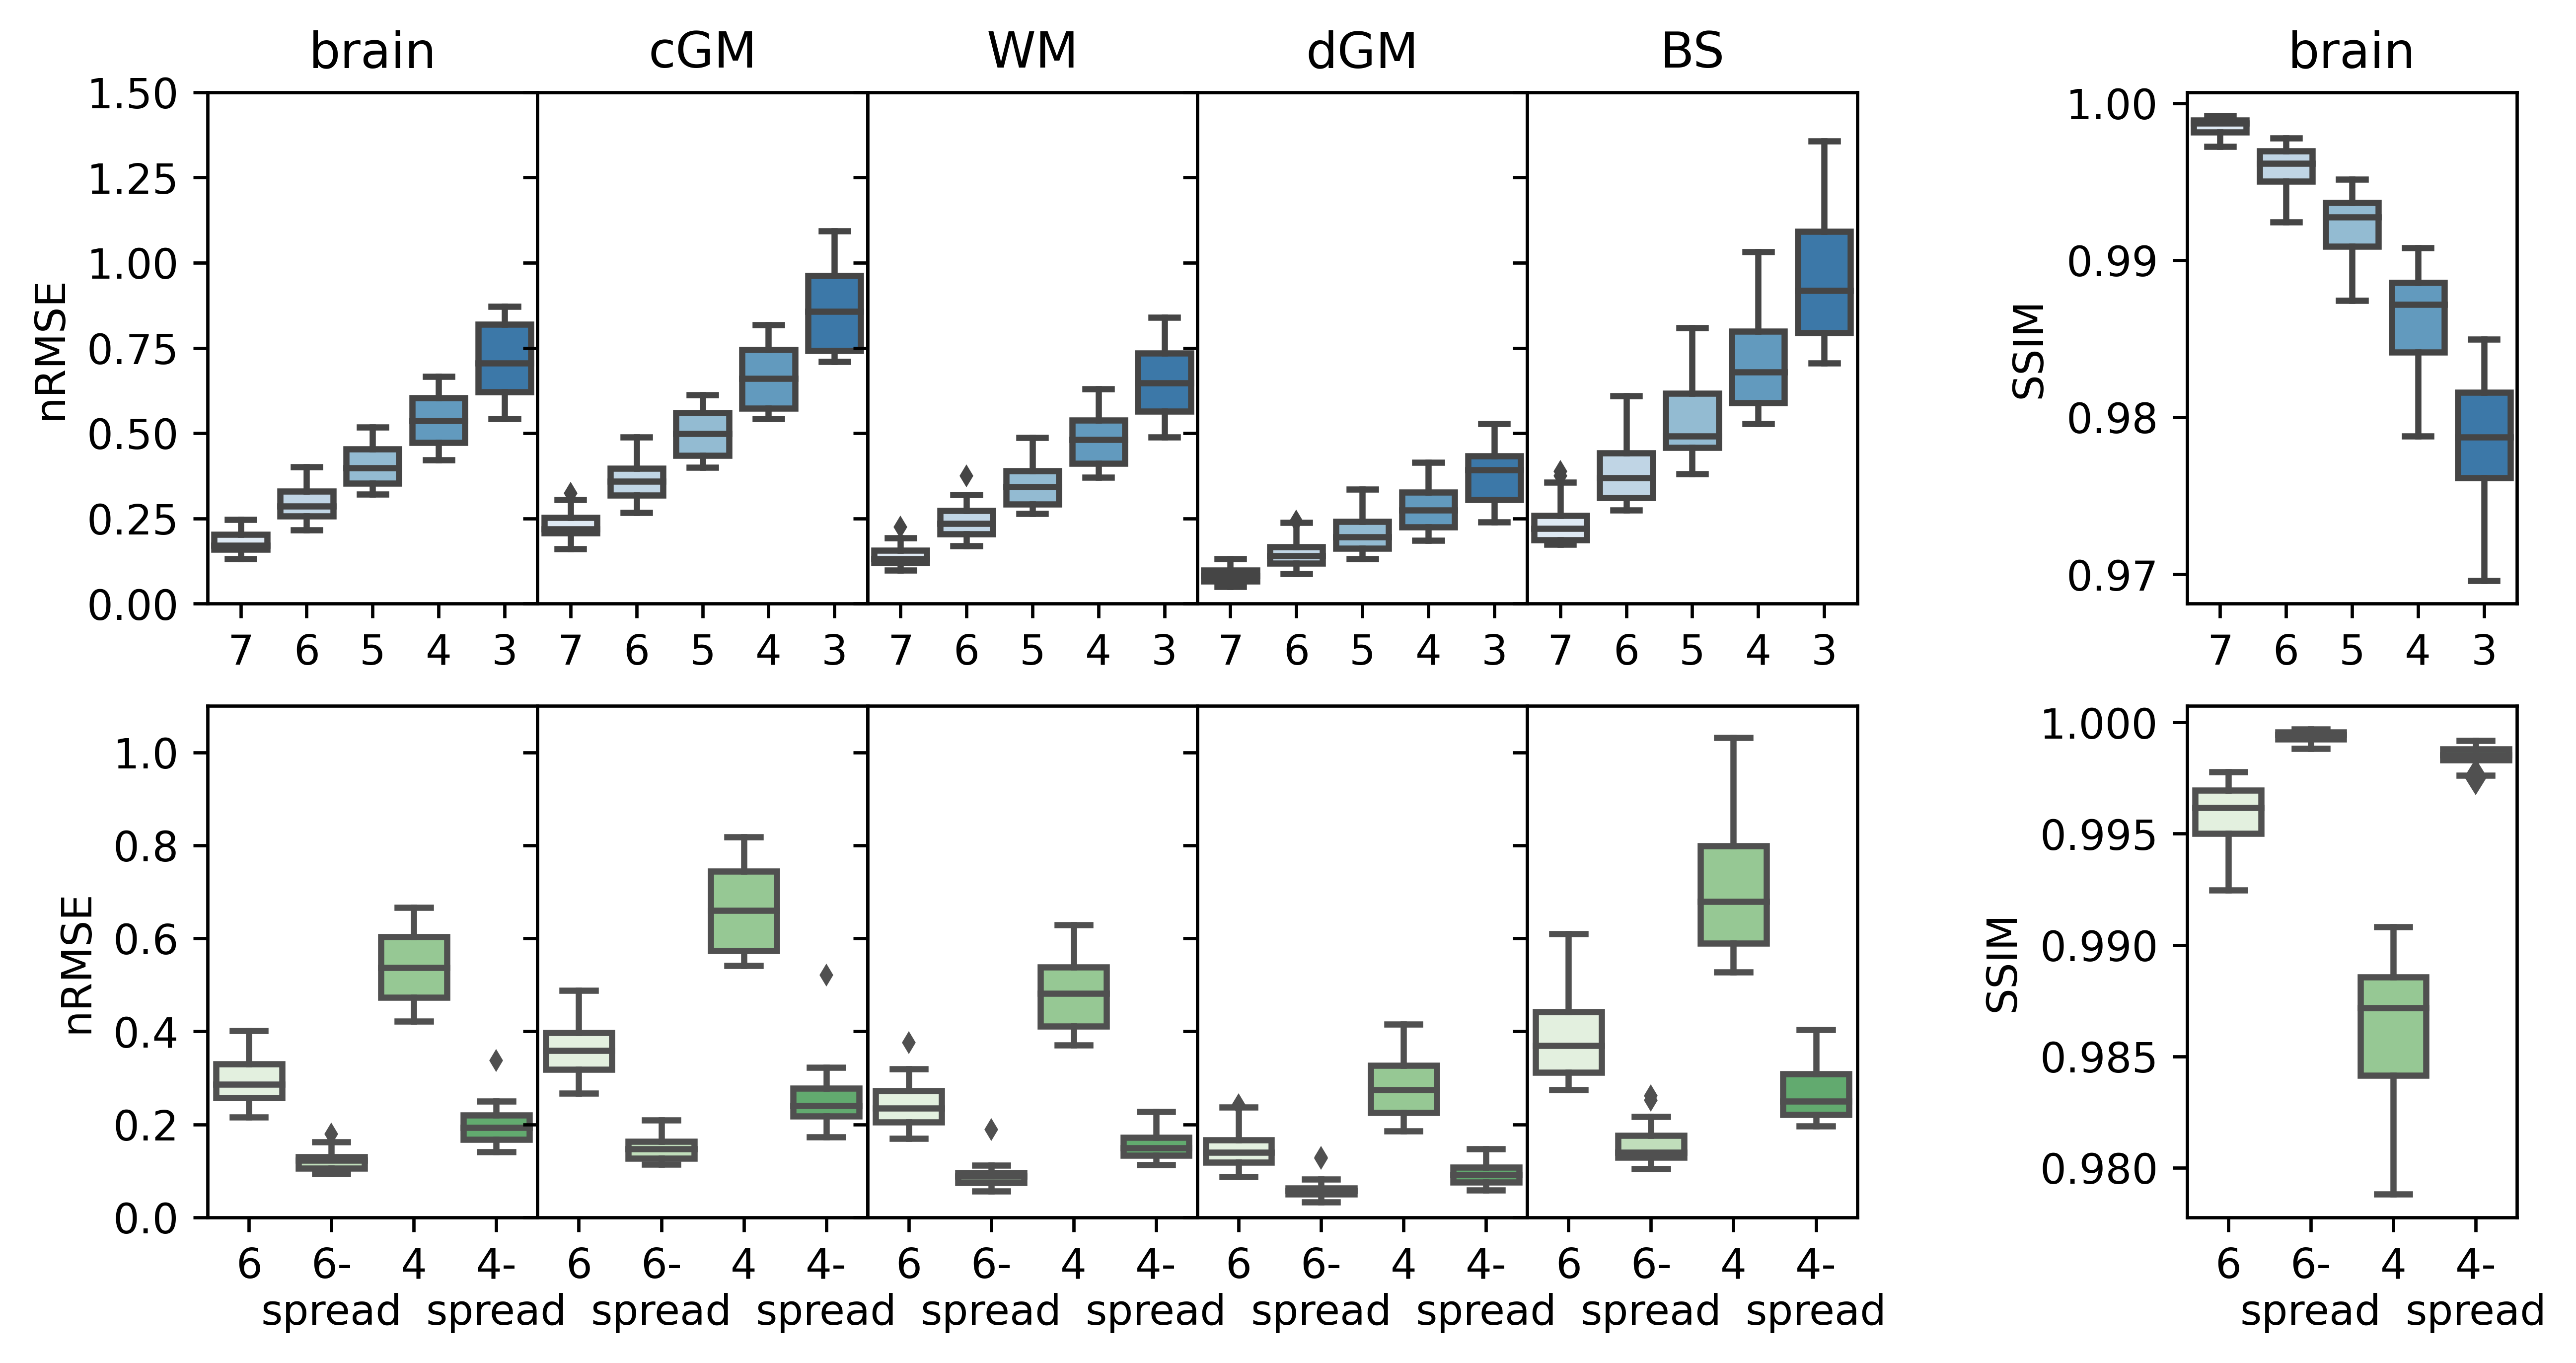
Statistical analysis: Mean susceptibility values in white matter (WM), cortical and deep grey matter (cGM, dGM), and brain stem (BS) were calculated for all cases. Mean susceptibilities in the individual dGM nuclei - accumbens, amygdala, caudate, pallidum, putamen and thalamus - were also calculated. Normalised root mean square error (nRMSE) and structural similarity index (SSIM)3 were computed between QSM calculated over the reduced echo train and the reference.
Results
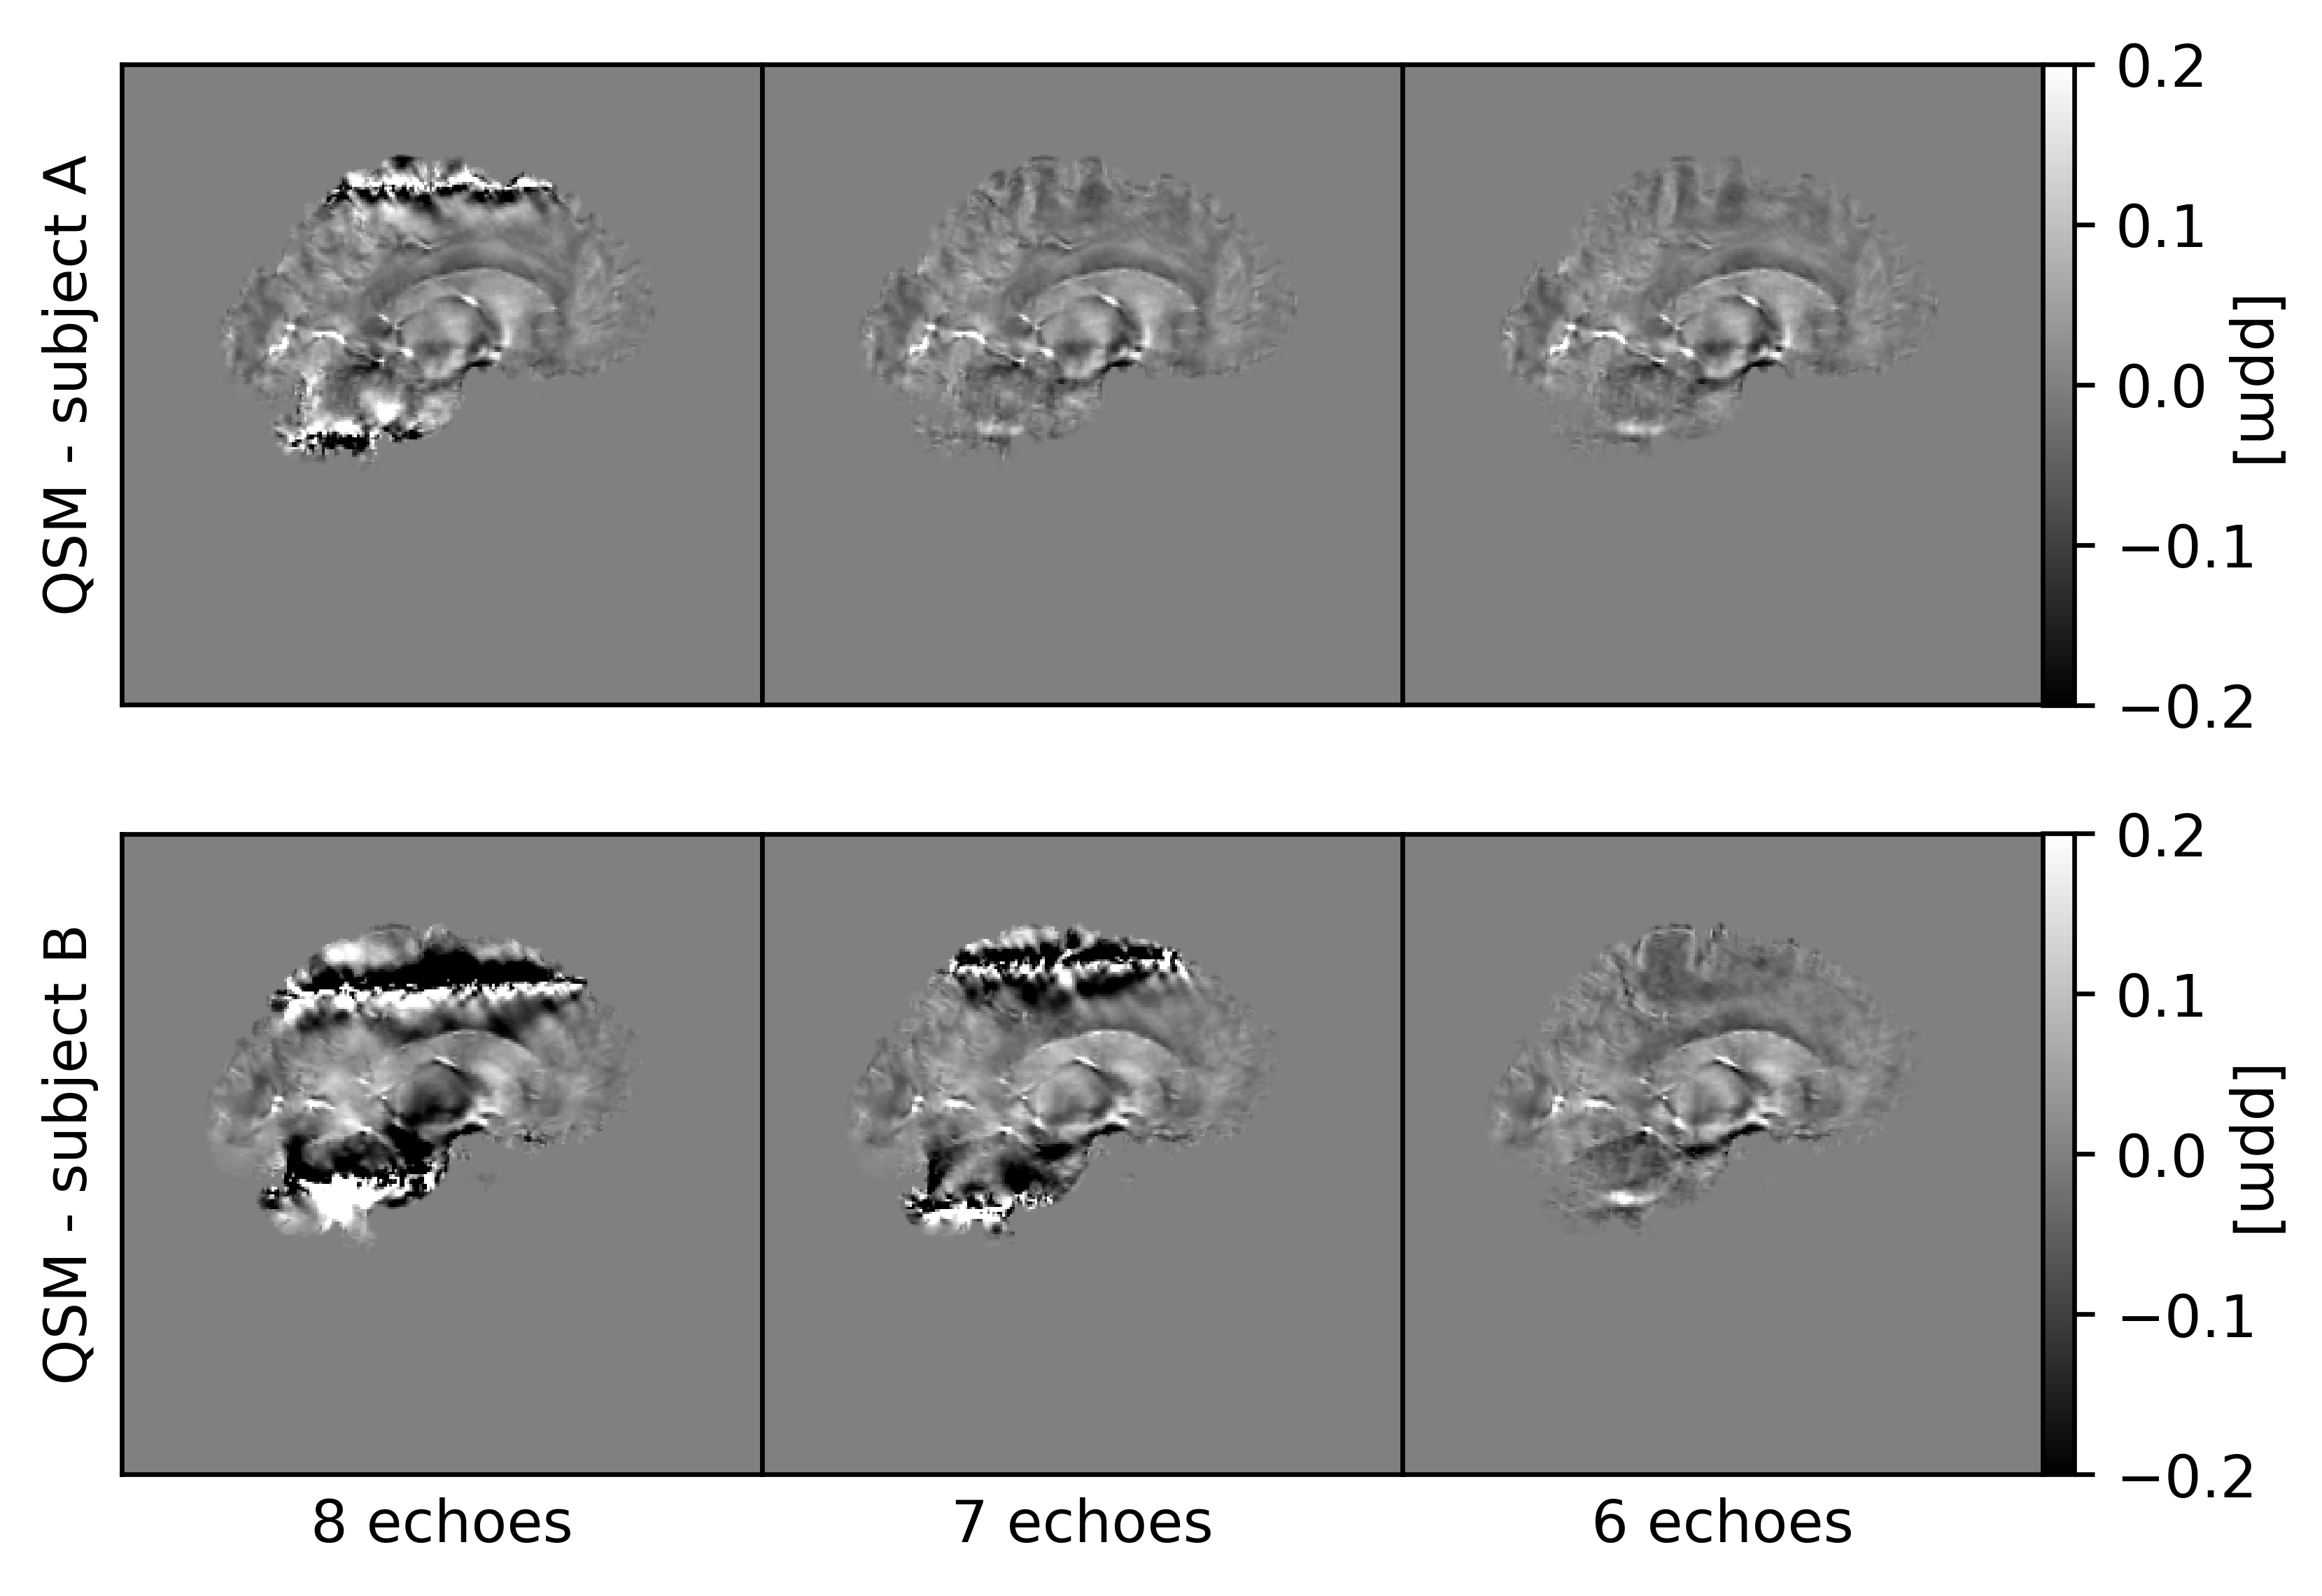
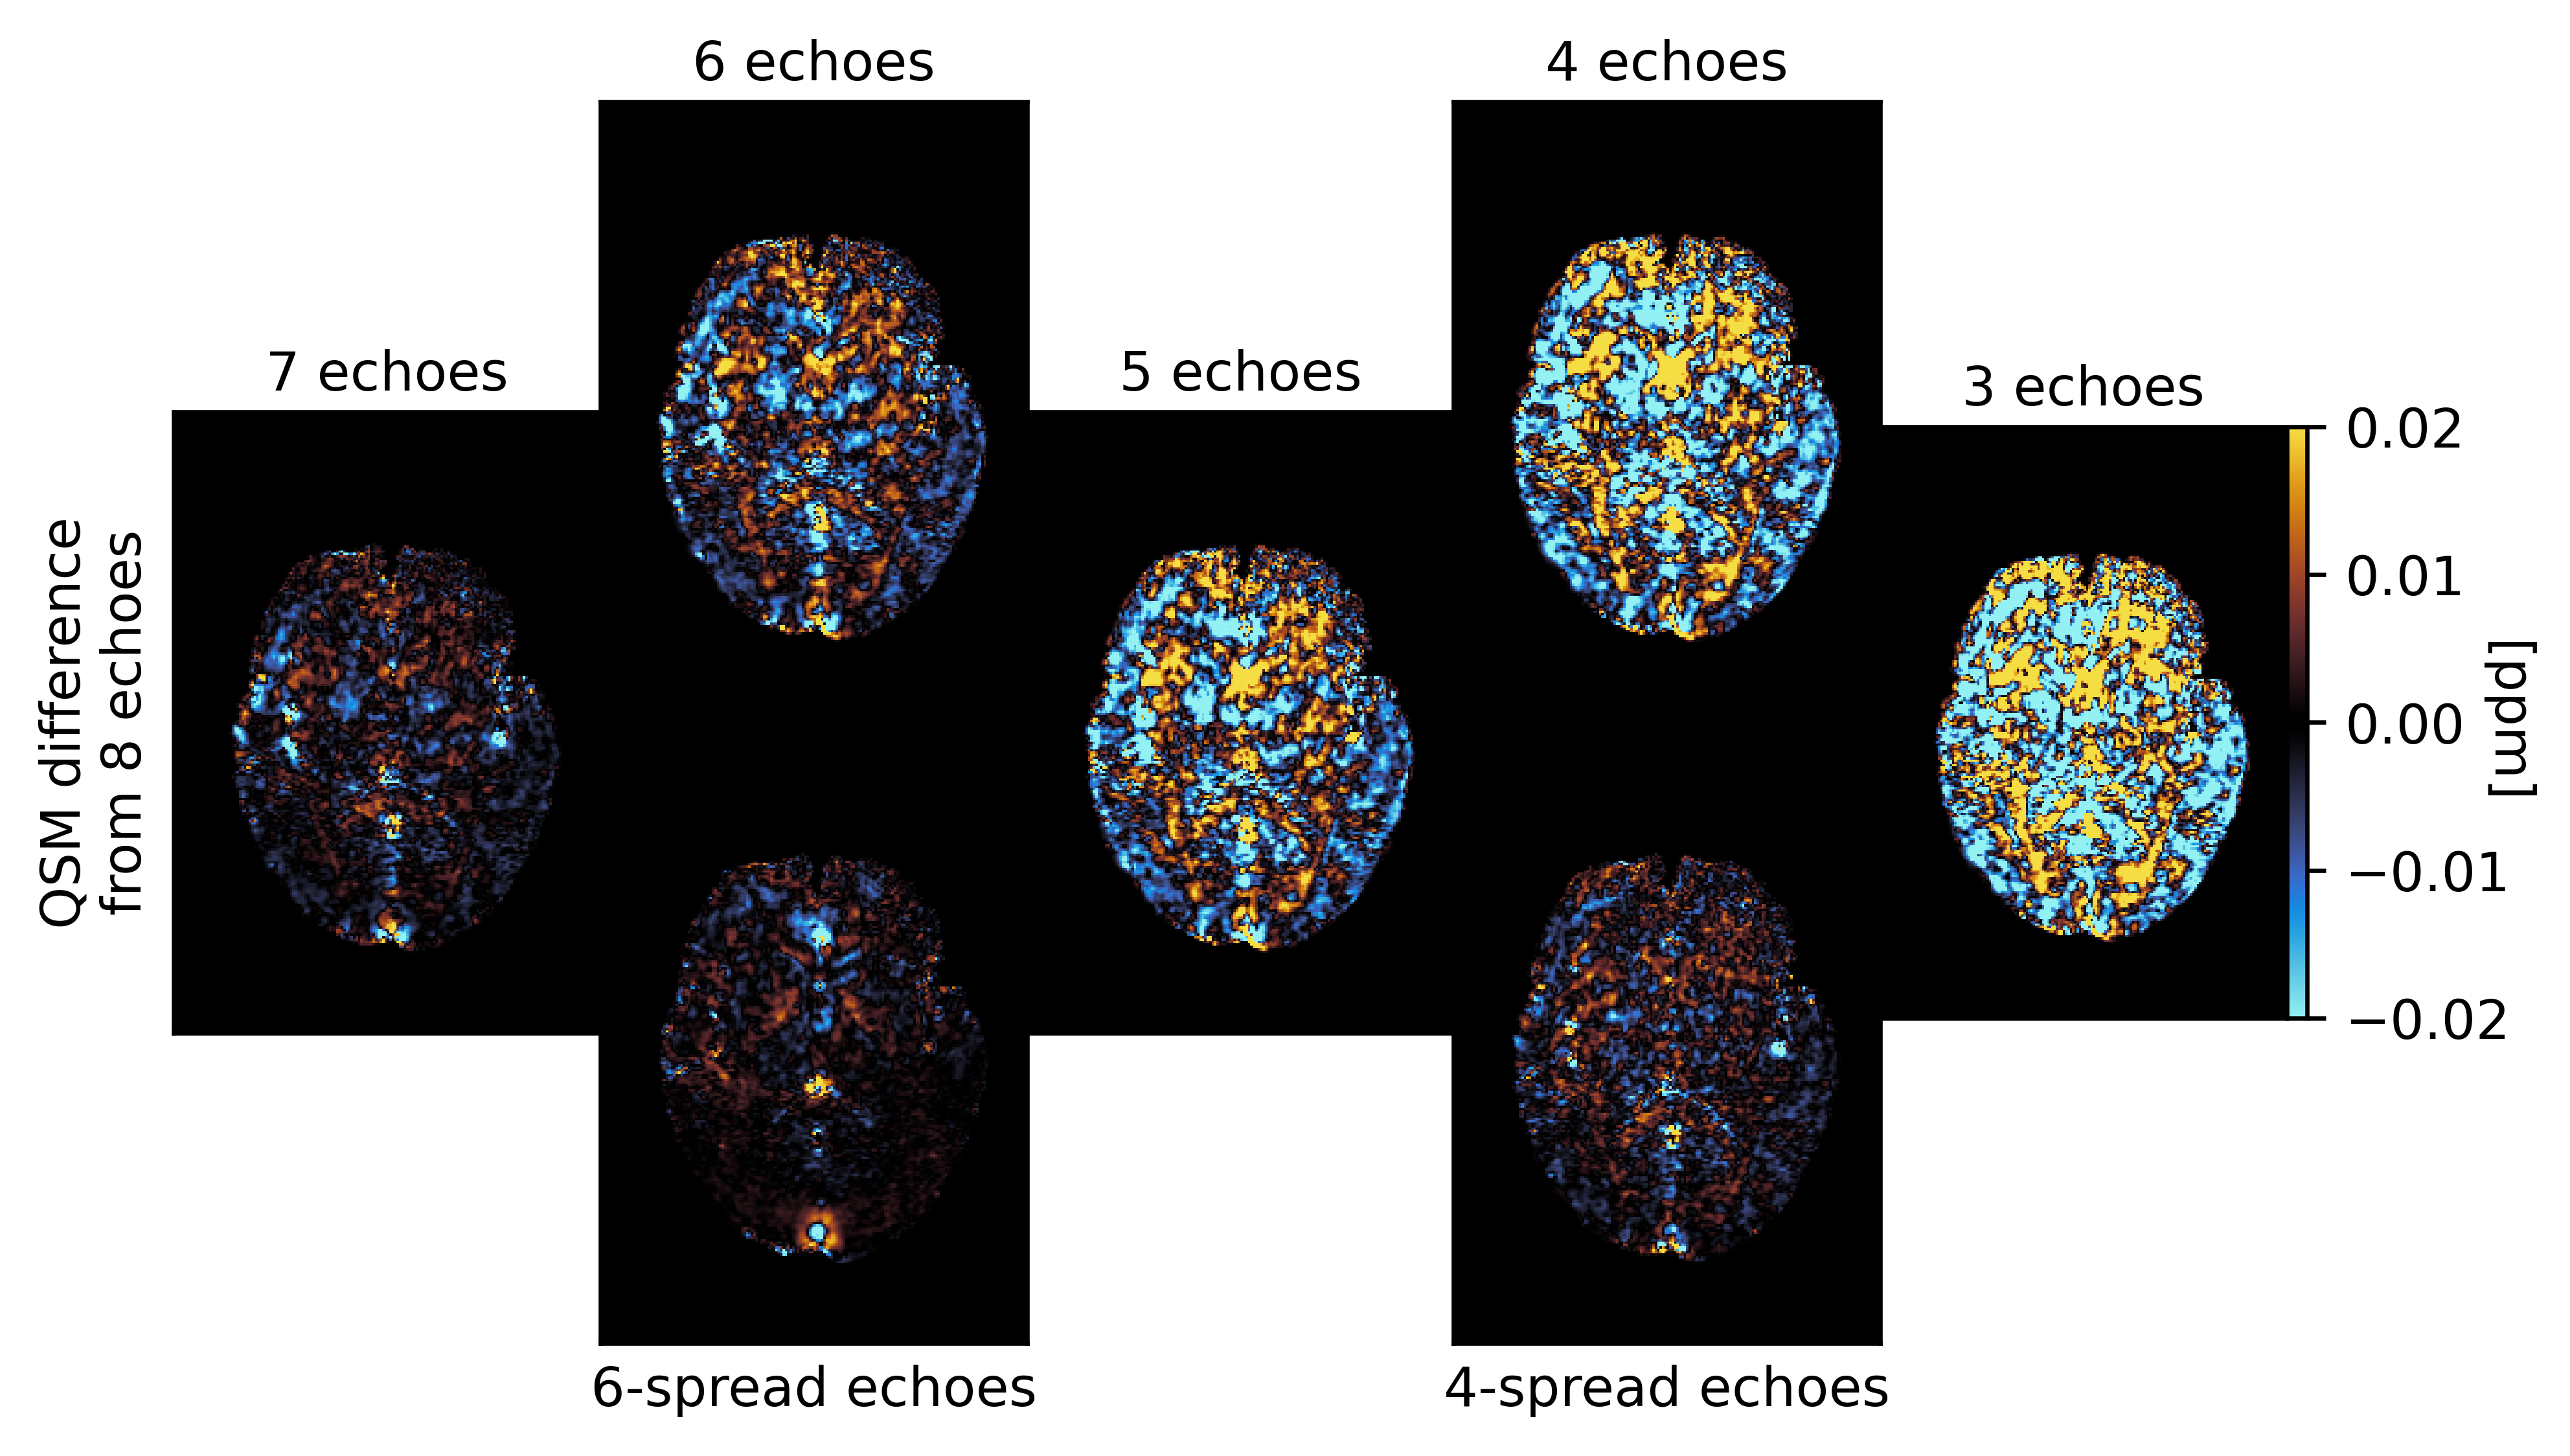
QSM artifacts due to echo-to-echo phase inconsistencies20 accrued during acquisition can be resolved by dropping the latest echoes (Figure 1). This work, on 20 good quality data, confirmed that dropping later echoes caused the QSM maps to visibly deteriorate when fewer early echoes were used (Figure 2), with mean regional QSM values varying proportionally to the number of dropped echoes: linear regression over the average values across the cohort showed statistically significant (p<0.05) linear dependency with the echo train length (Figure 3). In contrast, almost no change was observed in regional mean susceptibilities when using 6 and 4 echoes spread across the total TE range compared to the reference. nRMSE and SSIM showed progressive divergence between the reference and QSM maps calculated upon dropping the later echoes, but not when using fewer echoes covering the full TE-range (Figures 4, 5).Discussion and Conclusion
The presence of artefacts in a few subjects in which QSM is calculated using a multi-echo GRE approach could be resolved by truncating the echo train length. This raised the question of whether this may introduce significant measurement biases. Similarly, we also aimed to investigate whether it would be suitable to mix QSM data from multi-centre studies, with different centres employing a variety of echo times.Here, in agreement with previous work showing how single-echo QSM accuracy varies with TE6 and with phase contrast-to-noise being optimised at T2*21, we showed that QSM values depend on the TE range sampled. Therefore, it is not advisable to mix QSM data generated with different maximum TE values, or covering a different TE range. Regarding echo-to-echo phase inconsistencies, dropping up to two of the latest echoes for this whole dataset avoided the need for discarding subjects exhibiting artifacts, hence increasing the cohort statistical power, at the expense of a degradation in QSM accuracy. For multi-centre studies with heterogeneous settings, our results indicate that covering the same total TE range is preferable to simply matching the echo train length.
Acknowledgements
This project was funded by the MS Society (#77) and was performed on the MRI scanner of the NMR Research Unit at the Queen Square Multiple Sclerosis Centre supported by the National Institute for Health Research University College London Hospitals Biomedical Research Centre. CGWK receives grant funding from Wings for Life (#169111), BRC (#BRC704/CAP/CGW), MRC (#MR/S026088/1), Ataxia UK. CGWK is a shareholder in Queen Square Analytics Ltd.
FG is supported by an investigator-initiated study at the Vall d'Hebron Institute of Oncology (Barcelona, Spain), funded by AstraZeneca (PREdICT study). AstraZeneca did not influence data acquisition and analysis, result interpretation and the decision to submit this work in its present form. KS and AK are supported by European Research Council Consolidator Grant DiSCo MRI SFN 770939.
CT is currently being funded by a Junior Leader La Caixa Fellowship. The project that gave rise to these results received the support of a fellowship from ”la Caixa” Foundation (ID 100010434). The fellowship code is LCF/BQ/PI20/11760008. She has also received the 2021 Merck’s Award for the Investigation in Multiple Sclerosis (Spain). In 2015, she received an ECTRIMS Post-doctoral Research Fellowship and has received funding from the UK MS Society (grant number 77). She is part of the extended advisory board of the International Consensus group on Follow-on DMTs and is a member of the O'Hand Steering Committee. She has also received speaker honoraria from Roche and Novartis.
AC is supported by the UK MS Society PhD studentship (2020), received in 2019 a Guarantors of Brain “Entry” clinical fellowship and in 2018 an ECTRIMS-MAGNIMS fellowship.
References
- Langkammer, C., Liu, T., Khalil, M., Enzinger, C., Jehna, M., Fuchs, S., ... & Ropele, S. (2013). Quantitative susceptibility mapping in multiple sclerosis. Radiology, 267(2), 551-559.
- Langkammer, C., Schweser, F., Shmueli, K., Kames, C., Li, X., Guo, L., ... & Bilgic, B. (2018). Quantitative susceptibility mapping: Report from the 2016 reconstruction challenge. Magnetic resonance in medicine, 79(3), 1661-1673.QSM Challenge 2.0 Organization Committee,
- Bilgic, B., Langkammer, C., Marques, J. P., Meineke, J., Milovic, C., & Schweser, F. (2021). QSM reconstruction challenge 2.0: Design and report of results. Magnetic Resonance in Medicine.
- Berg, R. C., Preibisch, C., Thomas, D. L., Shmueli, K., & Biondetti, E. (2021). Investigating the Effect of Flow Compensation and Quantitative Susceptibility Mapping Method on the Accuracy of Venous Susceptibility Measurement. bioRxiv.
- Karsa, A., Punwani, S., & Shmueli, K. (2019). The effect of low resolution and coverage on the accuracy of susceptibility mapping. Magnetic resonance in medicine, 81(3), 1833-1848.
- Biondetti, E., Karsa, A., Thomas, D. L., & Shmueli, K. (2020). Investigating the accuracy and precision of TE‐dependent versus multi‐echo QSM using Laplacian‐based methods at 3 T. Magnetic Resonance in Medicine, 84(6), 3040-3053.
- Jenkinson, M., Beckmann, C. F., Behrens, T. E., Woolrich, M. W., & Smith, S. M. (2012). Fsl. Neuroimage, 62(2), 782-790.
- Valverde, S., Salem, M., Cabezas, M., Pareto, D., Vilanova, J. C., Ramió-Torrentà, L., ... & Lladó, X. (2019). One-shot domain adaptation in multiple sclerosis lesion segmentation using convolutional neural networks. NeuroImage: Clinical, 21, 101638.
- Prados, F., Cardoso, M. J., Kanber, B., Ciccarelli, O., Kapoor, R., Wheeler-Kingshott, C. A. G., & Ourselin, S. (2016). A multi-time-point modality-agnostic patch-based method for lesion filling in multiple sclerosis. Neuroimage, 139, 376-384.
- Cardoso, M. J., Modat, M., Wolz, R., Melbourne, A., Cash, D., Rueckert, D., & Ourselin, S. (2015). Geodesic information flows: spatially-variant graphs and their application to segmentation and fusion. IEEE transactions on medical imaging, 34(9), 1976-1988.
- http://pre.weill.cornell.edu/mri/pages/qsm.html
- Dymerska, B., Eckstein, K., Bachrata, B., Siow, B., Trattnig, S., Shmueli, K., & Robinson, S. D. (2021). Phase unwrapping with a rapid opensource minimum spanning tree algorithm (ROMEO). Magnetic Resonance in Medicine, 85(4), 2294-2308.
- MATLAB. (2010). version 9.8.0.1359463 (R2020a) Update 1. Natick, Massachusetts: The MathWorks Inc.
- Liu, T., Wisnieff, C., Lou, M., Chen, W., Spincemaille, P., & Wang, Y. (2013). Nonlinear formulation of the magnetic field to source relationship for robust quantitative susceptibility mapping. Magnetic resonance in medicine, 69(2), 467-476.
- Schweser, F., Deistung, A., Sommer, K., & Reichenbach, J. R. (2013). Toward online reconstruction of quantitative susceptibility maps: superfast dipole inversion. Magnetic resonance in medicine, 69(6), 1581-1593.
- Liu, T., Khalidov, I., de Rochefort, L., Spincemaille, P., Liu, J., Tsiouris, A. J., & Wang, Y. (2011). A novel background field removal method for MRI using projection onto dipole fields. NMR in Biomedicine, 24(9), 1129-1136.
- Karsa, A., Punwani, S., & Shmueli, K. (2020). An optimized and highly repeatable MRI acquisition and processing pipeline for quantitative susceptibility mapping in the head‐and‐neck region. Magnetic Resonance in Medicine, 84(6), 3206-3222.
- Karsa, A., Punwani, S., & Shmueli, K. (2019). The effect of low resolution and coverage on the accuracy of susceptibility mapping. Magnetic resonance in medicine, 81(3), 1833-1848.
- Kiersnowski, O. C., Karsa, A., Thornton, J. S., & Shmueli, K. (2021). The Effect of Oblique Image Slices on the Accuracy of Quantitative Susceptibility Mapping and a Robust Tilt Correction Method. ISMRM & SMRT Annual Meeting & Exhibition.
- Biondetti E. Optimising MRI magnetic susceptibility mapping for the study of brain arteriovenous malformations (Doctoral dissertation, UCL (University College London)).
- Wu, B., Li, W., Avram, A. V., Gho, S. M., & Liu, C. (2012). Fast and tissue-optimized mapping of magnetic susceptibility and T2* with multi-echo and multi-shot spirals. Neuroimage, 59(1), 297-305.
Figures