2367
XSIM, a Susceptibility-Optimised Similarity Index Metric: Validation with 2016 and 2019 QSM Reconstruction Challenge Datasets1Department of Medical Physics and Biomedical Engineering, University College London, London, United Kingdom, 2Department of Electrical Engineering, Pontificia Universidad Catolica de Chile, Santiago, Chile, 3Biomedical Imaging Center, Pontificia Universidad Catolica de Chile, Santiago, Chile, 4Millennium Nucleus for Cardiovascular Magnetic Resonance, Santiago, Chile, 5Institute for Biological and Medical Engineering, Pontificia Universidad Catolica de Chile, Santiago, Chile
Synopsis
The Structural Similarity Index (SSIM) has become a popular quality metric to evaluate Quantitative Susceptibility Mapping (QSM) in a way that is closer to human perception than the Root-Mean-Squared-Error (RMSE). However, SSIM may over-penalize errors in diamagnetic tissues and under-penalize them in paramagnetic tissues. Extreme susceptibility artifacts may also compress the dynamic-range, resulting in unrealistically high SSIM scores (hacking). To overcome these problems we propose XSIM: SSIM implemented in the native QSM ppm range with new susceptibility-optimized internal parameters. We validated XSIM using data from both QSM challenges. XSIM avoids bias and metric-hacking, promoting sharp susceptibility maps and preventing over-regularization.
INTRODUCTION
Quantitative Susceptibility Mapping (QSM) solves an ill-posed inverse problem, where tissue susceptibilities are derived from the phase of gradient-echo acquisitions1. Since this is a complex process prone to errors and artifacts, numerous QSM algorithms have been proposed. To compare the performance of these algorithms, two QSM Reconstruction Challenges have been organized (2016, announced in Graz, Austria: RC12, and 2019, announced in Seoul, Korea: RC23,4). The Structural Similarity Index Metric (SSIM)5,6 was first used in the RC1 as an alternative to the Root Mean Squared Error (RMSE) to measure the quality of the QSM reconstructions. As it is based on a perceptual cost, SSIM should reflect the human visual perception of QSM reconstruction quality more closely than RMSE. Optimizing SSIM tended to produce sharper susceptibility maps than using RMSE2. However, concerns were raised about the validity of this metric for QSM since maps with obvious artifacts achieved higher SSIM scores than artifact-free solutions. Here, we present the Susceptibility Similarity Index Metric (XSIM): a robust implementation of the SSIM metric specifically tuned for QSM, that avoids these problems.METHODS
SSIM produces values between 0 and 1, with 1 indicating an image identical to the ground truth. It is defined as the pixel-wise multiplication of three loss functions (luminance, variance, and structural), simplified as follows5,6:$$SSIM(x,y)=\sum_{ROI}\frac{(2μ_xμ_y+c_1)(2σ_{xy}+c_2)}{(μ_x^2+μ_y^2+c_1)(σ_x^2+σ_y^2+c_2)}$$
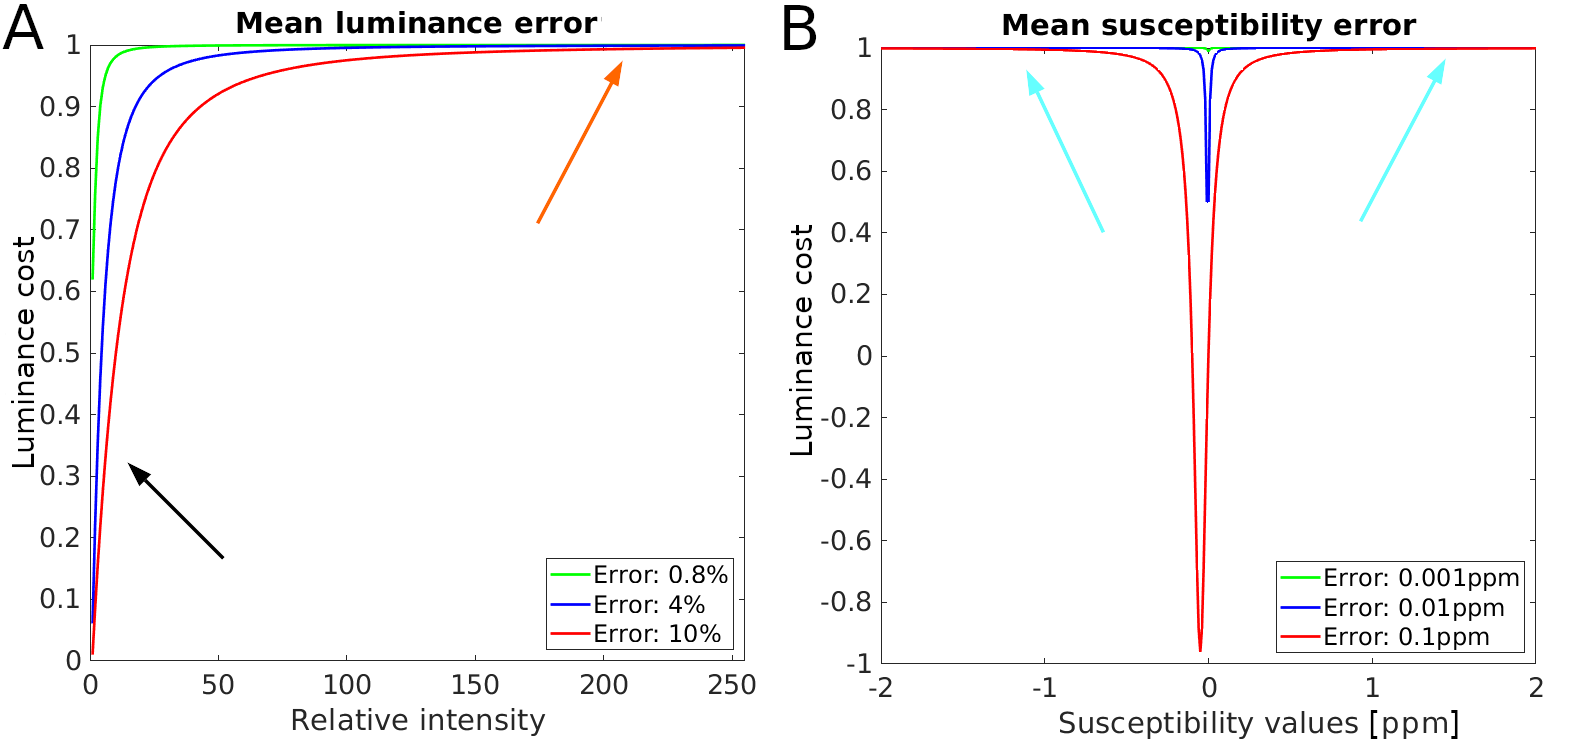
where x and y are the two images being compared inside 3x3x3 moving windows, μ is the window mean value, σ2 the window variance, and σxy the covariance between corresponding windows. Parameters c1 and c2 are used to stabilize the cost functions: large values make the functions insensitive to errors, whereas small values may lead to excessive sensitivity to noise. Typically, these parameters are defined as: $$$c_i = K_iL$$$ with standard values $$$K_1=0.01$$$, $$$K_2=0.03$$$, and $$$L=255$$$. The implementation of SSIM for RC12 required rescaling QSM images to range between 0 and 255 and was evaluated using default parameters. As shown in Figure 1A, this results in a bias that over-penalizes errors in the diamagnetic range, whereas paramagnetic errors are largely ignored. In XSIM, we propose to keep the susceptibility maps in their native ppm range, allowing negative and positive values for both the susceptibility maps and the costs within XSIM. This change requires fine-tuning the internal parameters. We chose $$$K_1=0.01$$$, $$$K_2=0.001$$$, and $$$L=1.0$$$, to have a larger sensitivity to structural and local variance errors than to absolute deviations from zero values. This is shown in Figure 1B: errors that turn diamagnetic sources into paramagnetic sources are highly penalized.
A side benefit of keeping the original QSM dynamic range is that it avoids SSIM-hacking. In SSIM, both target and ground-truth are scaled into the [0,255] range, so extremely high or low outlying or artifactual susceptibility values can compress all the meaningful data into a very small range, leading to unusually high SSIM scores. This is represented in Figure 2, where streaking artifacts “hack” the SSIM metric. XSIM and RMSE correctly penalize these errors.
We evaluated the performance of SSIM and XSIM on FANSI7 QSM reconstructions of local field maps from the RC1 in-vivo single-orientation acquisition2, using χ33 as a ground-truth. Further validation of both metrics was performed by analyzing reconstructions of simulated local field maps4 submitted to RC2 and comparing the performance of XSIM and SSIM against the RMSE, Correlation Coefficient, and Mutual Information metrics. RC2:SIM2 contained a strong calcification that led to severe streaking in most submissions4, making this a candidate for SSIM-hacking. Source code for calculating XSIM is openly available in the FANSI Toolbox repository8.
RESULTS
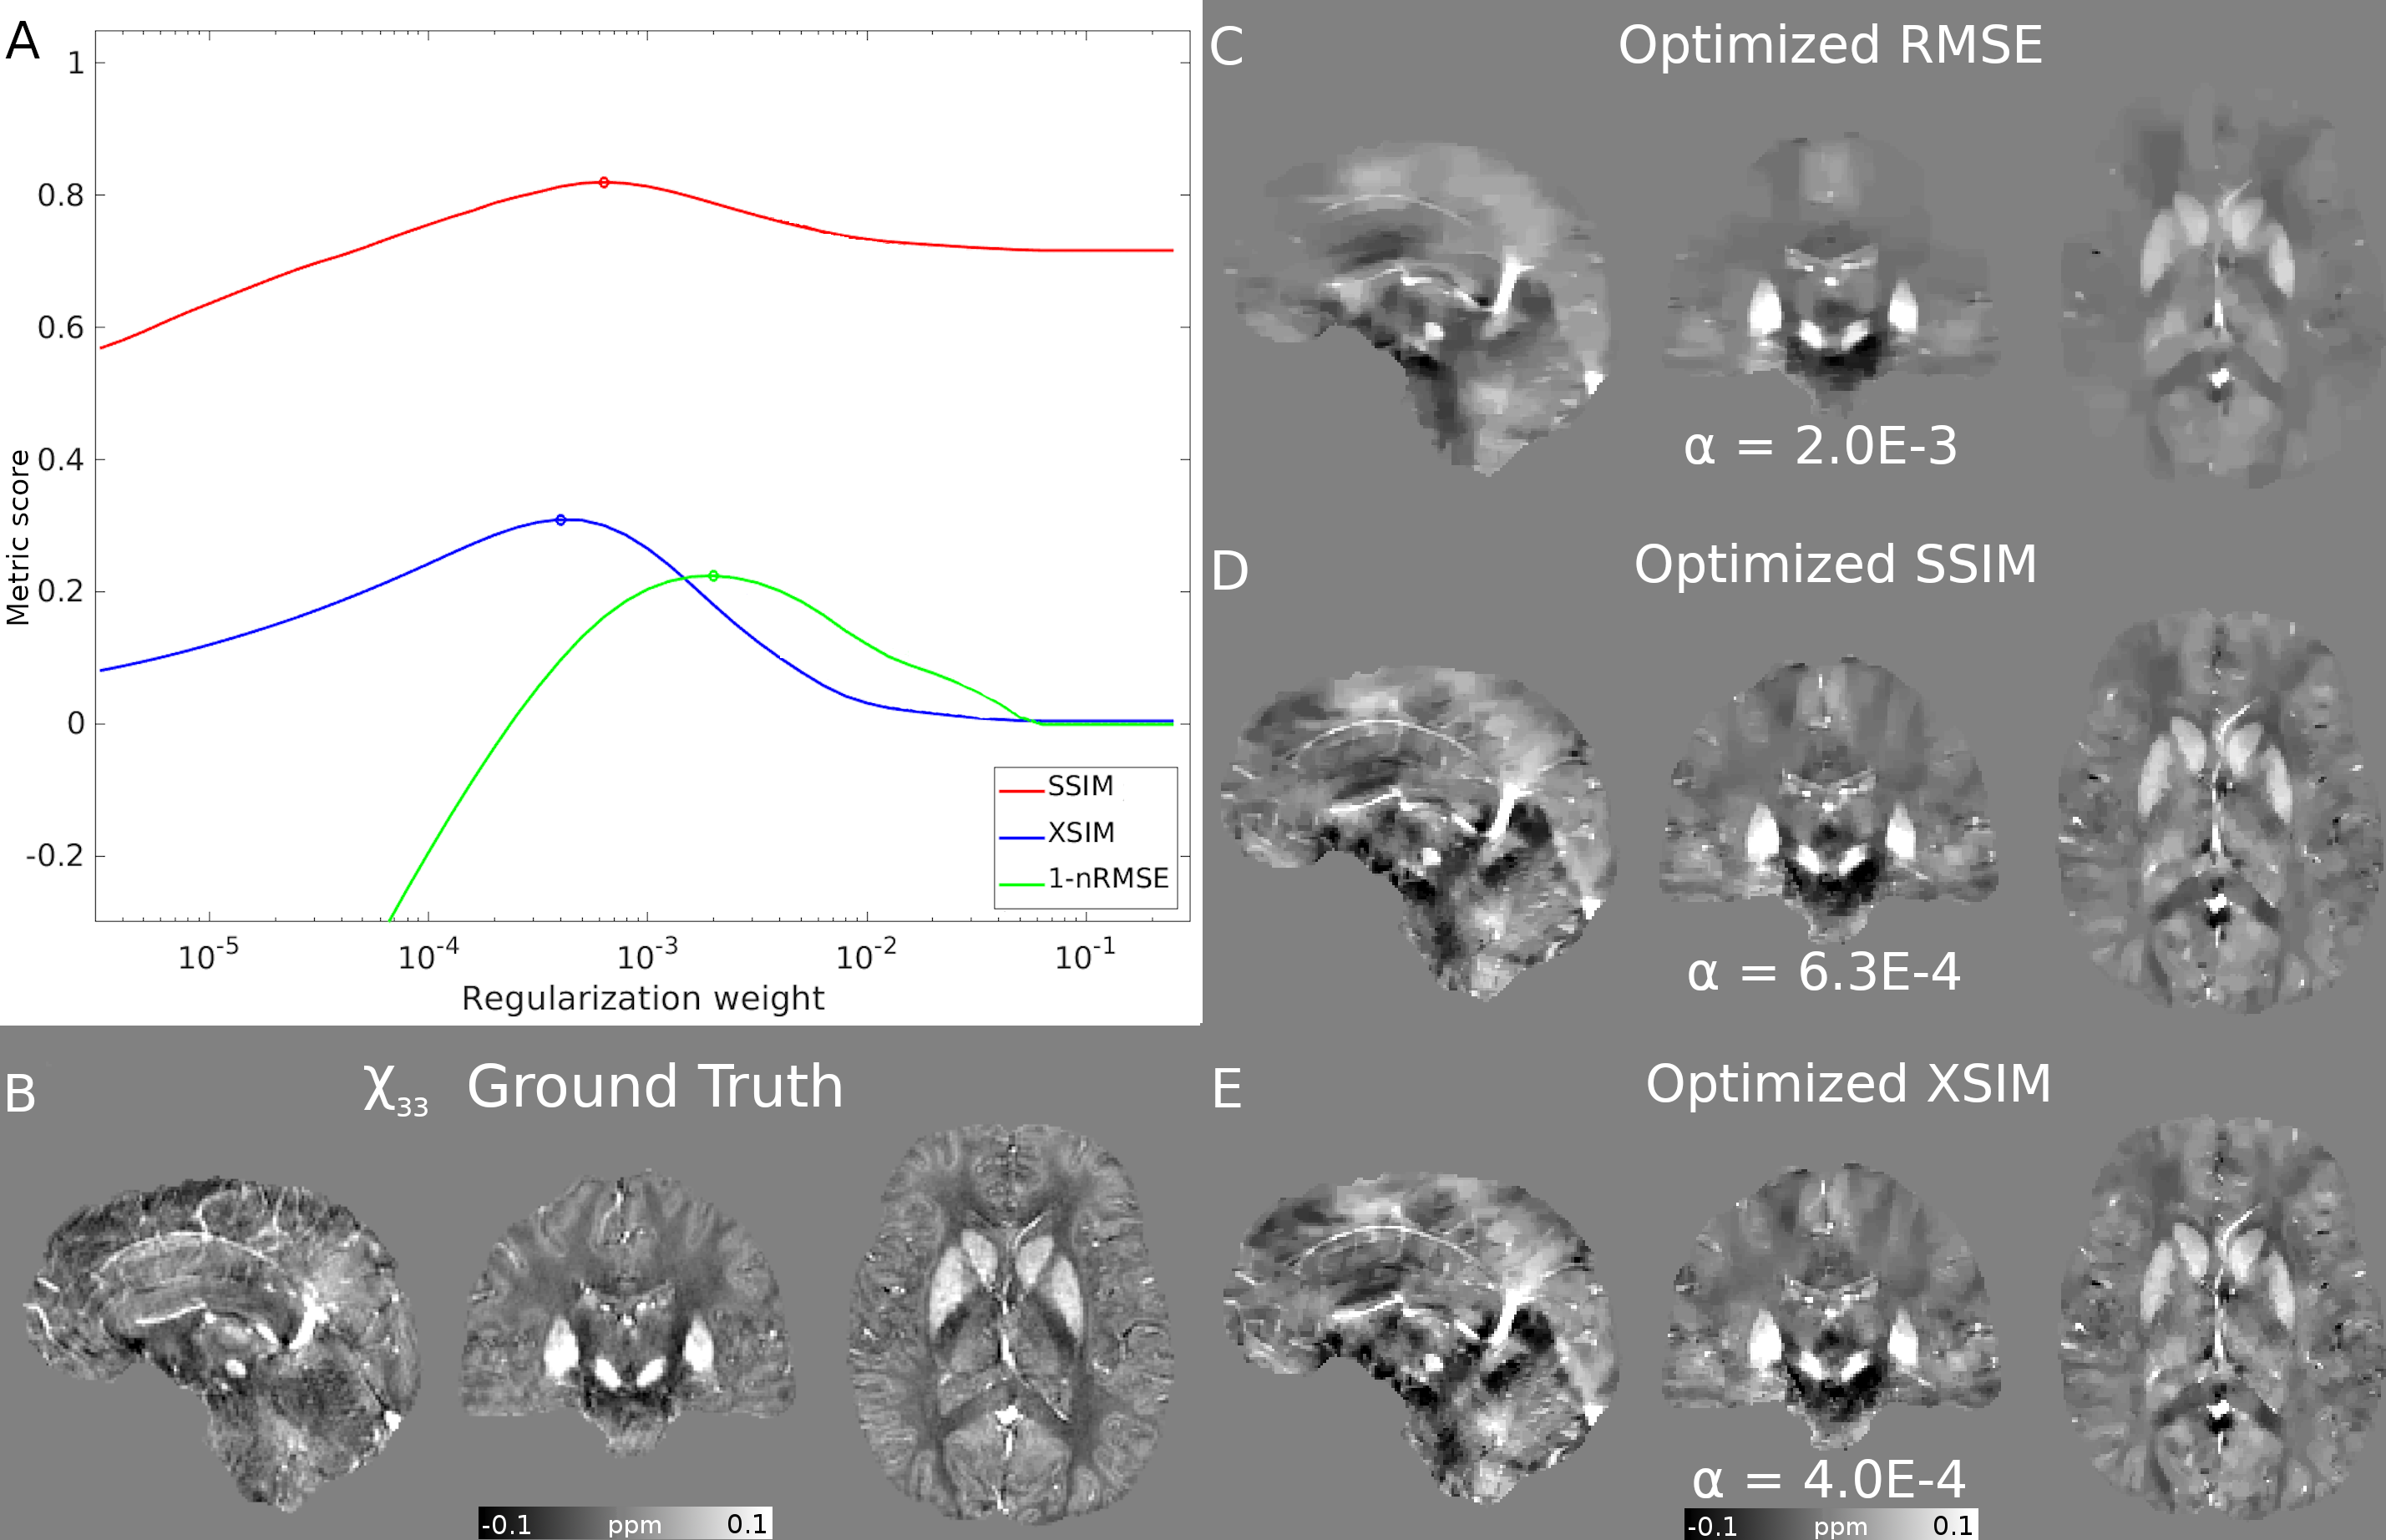
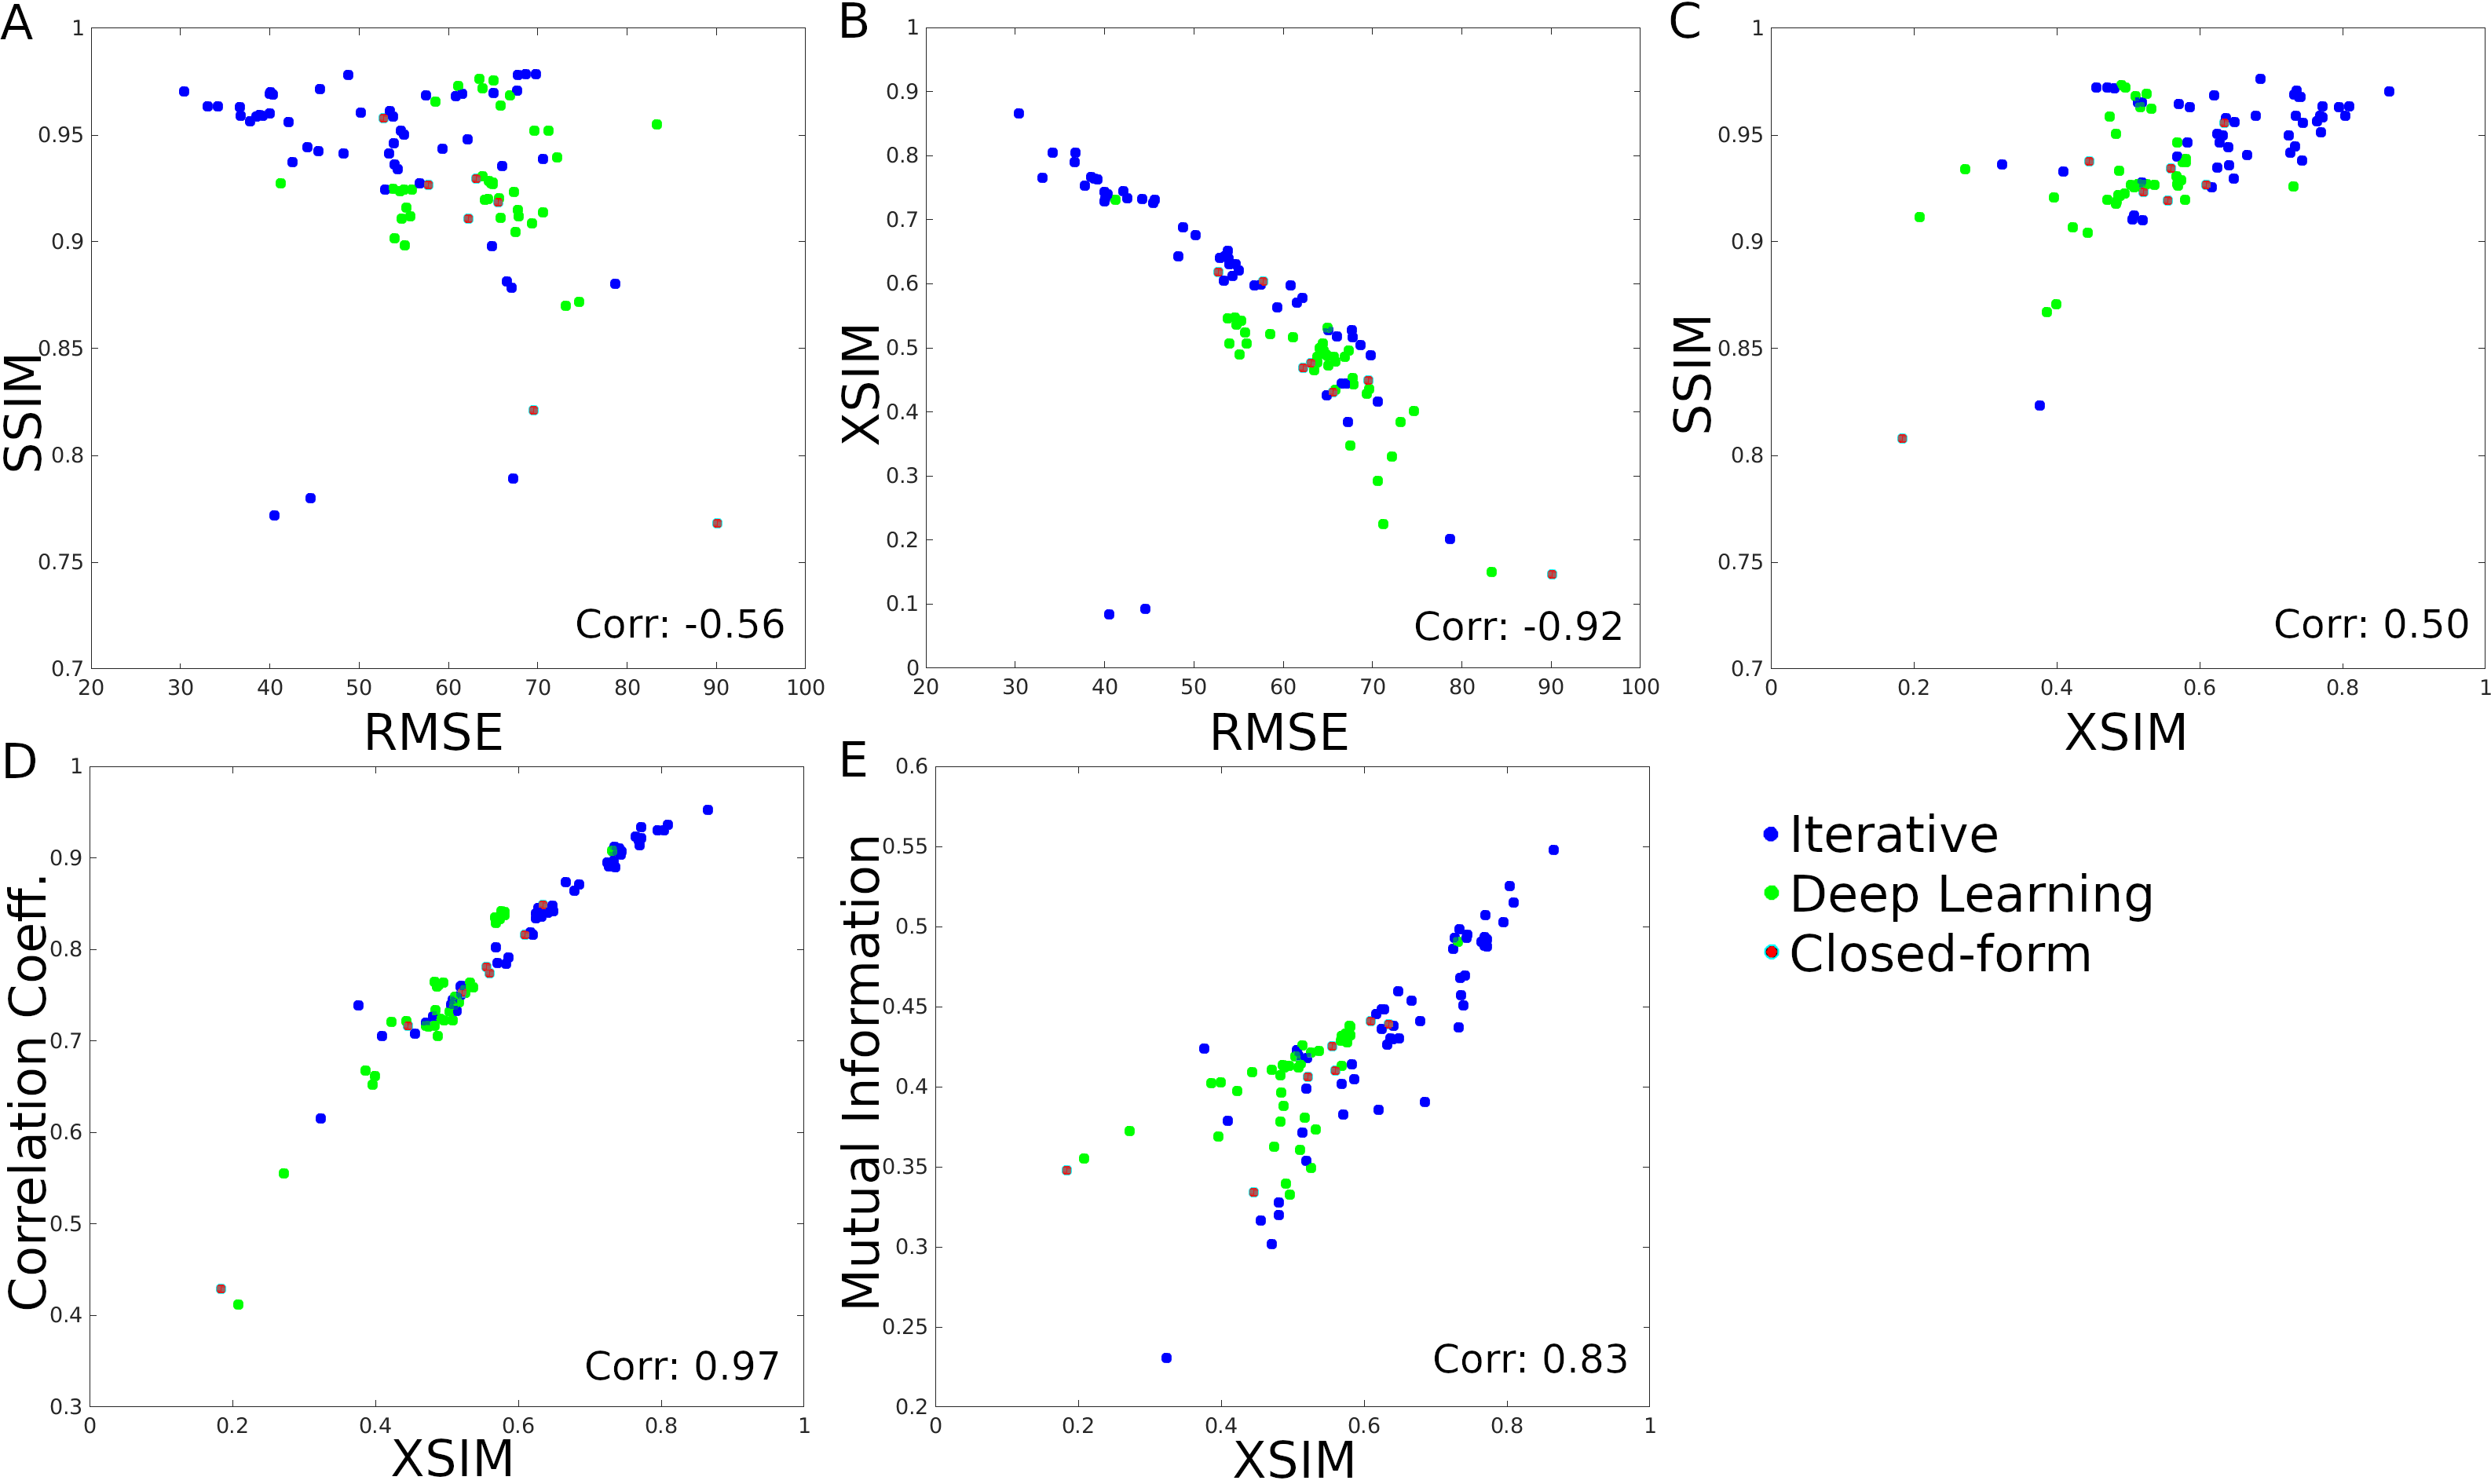
Figure 3 shows the metric scores as a function of regularization weight and optimal reconstructions for each metric. XSIM achieved the sharpest results, and the lowest regularization weights. Comparisons between global metrics for the RC2 submissions are shown in Figure 4. XSIM shows a strong correlation with RMSE and the Correlation Coefficient, fixing SSIM-hacking issues. This is also shown in Figure 5, where SSIM showed a strong bias to higher scores in RC2:SIM2 than SIM1. This bias was stronger for submissions with larger streaking artifacts (Fig 5A) and is absent with XSIM (Fig. 5B).DISCUSSION
XSIM-optimized reconstructions look closer to the ground truth than reconstructions optimizing SSIM and RMSE. XSIM also provides greater sensitivity to changes in the regularization weight (Figure 3), making it more suitable for QSM parameter optimization. Highly localized errors are penalized less than for RMSE (Figure 2). Blurred and low-intensity reconstructions are heavily penalized (Figure 3) demonstrating that the XSIM quickly falls to zero for over-regularized solutions. Both factors lead to smaller regularization weights when optimizing using XSIM and mean that XSIM promotes a more similar global appearance to the ground truth since it does not over-penalize localized strong errors (i.e. streaking).CONCLUSION
The SSIM metric for image comparison can correlate well with human perception of visual similarity for natural images. However, it must be properly tuned for specific imaging applications. Our XSIM implementation provides a set of parameters optimized for robust application to QSM, preventing bias and metric-hacking, and promoting sharp results.Acknowledgements
We thank Cancer Research UK Multidisciplinary Award C53545/A24348, Fondecyt 1191710, PIA-ACT192064, and the Millennium Science Initiative Program – NCN17_129, of the National Agency for Research and Development, ANID for their funding support. Karin Shmueli is supported by European Research Council Consolidator Grant DiSCo MRI SFN 770939.References
1. Shmueli K. Chapter 31 - Quantitative Susceptibility Mapping. Advances in Magnetic Resonance Technology and Applications, Academic Press, 2020(1):819-838. doi:10.1016/B978-0-12-817057-1.00033-0
2. Langkammer C, Schweser F, Shmueli K, Kames C, Li X, Guo L, Milovic C, Kim J, Wei H, Bredies K, Buch S, Guo Y, Liu Z, Meineke J, Rauscher A, Marques JP, Bilgic B; Quantitative Susceptibility Mapping: Report from the 2016 Reconstruction Challenge; Magnetic Resonance in Medicine, 2017 Jul 31. doi: 10.1002/mrm.26830.
3. Marques JP, Meineke J, Milovic C, Bilgic B, Chan K-S, Hedouin R, van der Zwaag W, Langkammer C, and Schweser F. QSM Reconstruction Challenge 2.0: A Realistic in silico Head Phantom for MRI data simulation and evaluation of susceptibility mapping procedures. Magn Reson Med. 2021;86: 526– 542 doi:10.1002/mrm.28716
4. QSM Challenge Committee: Bilgic B, Langkammer C, Marques JP, Meineke J, Milovic C, Schweser F. QSM Reconstruction Challenge 2.0: Design and Report of Results. Magn Reson Med. 2021;86:1241-1255 doi:10.1002/MRM.28754 *all authors contributed equally
5. Wang Z, Bovik AC, Sheikh HR, Simoncelli EP. Image Quality Assessment: From Error Visibility to Structural Similarity. IEEE Trans Image Process. 2004;13(4):600-612. doi:10.1109/TIP.2003.819861
6. Horé A, Ziou D. Image quality metrics: PSNR vs. SSIM. In: Proceedings - International Conference on Pattern Recognition. IEEE; 2010:2366-2369. doi:10.1109/ICPR.2010.579
7. Milovic C, Bilgic B, Zhao B, Acosta-Cabronero J, Tejos C. Fast nonlinear susceptibility inversion with variational regularization. Magn Reson Med. 2018;80(2):814-821. doi:10.1002/mrm.27073
8. FANSI Toolbox. Available at http://gitlab.com/cmilovic/FANSI-Toolbox
Figures