2364
Application of susceptibility source separation (chi-separation) to UK Biobank protocol and clinical protocol using deep neural network1Department of Electrical and Computer Engineering, Seoul National University, Seoul, Korea, Republic of, 2Medical Device Development Center, K-MEDI hub, Daegu, Korea, Republic of
Synopsis
We develop pipelines for reconstructing susceptibility source separation (χ-separation) maps, which requires a T2 map, from UK Biobank protocol and routine clinical protocol data that have no T2 map but have various T2-weighted contrasts (e.g., FLAIR and T2-weighted images). Using these and additional contrast-weighted images, we propose a deep neural network framework that generates an R2 (=1/T2) map, with which χ-separation is conducted. The proposed pipelines successfully generated positive and negative susceptibility maps that are highly similar to gold standard results. The results suggest that χ-separation is applicable to various clinical routine protocols and open-source data.
Introduction
Susceptibility source separation methods (χ-separation,1 DECOMPOSE-QSM,2 and Emmerich et al.3) have recently been proposed for estimating the individual concentrations of positive susceptibility (χpos) and negative susceptibility (χneg), which illustrate the distribution of two dominant susceptibility contributors (i.e., iron and myelin) in the brain. Among them, χ-separation utilizes R2’ (= R2*-R2) information that requires the acquisition of R2* and R2 maps. Despite its utility, however, this requirement for an R2 map hampers a wide application of χ-separation due to the lack of an R2 map in routine clinical imaging or public dataset including UK Biobank (UKB).4 Recently, deep learning-based relaxometry that translates contrast-weighted images to relaxometric maps has been suggested.5 In this study, we propose two pipelines that allow us to apply χ-separation to UKB data and a routine clinical protocol using R2 maps from deep neural networks. The performance of the proposed pipelines is evaluated by comparing the results with those using a reference R2 map.Methods
[In-vivo data acquisition] UKB data include MPRAGE, T2-FLAIR, and GRE3mm (TR/TE1/TE2=27/9.4/19.7ms, resolution=0.8×0.8×3mm3). We scanned 20 subjects (train/validation/test: 10/1/9) using the same parameter as the UKB protocol (IRB-approved). Additionally, 2D multi-echo spin-echo (MESE; TR/TE=6530/20:20:100ms, FOV=208×256×120mm3, resolution=1×1×2mm3) and GRE1mm (TR/TE1/TE2/TE3/TE4=27/4.3/9.4/14.6/19.7ms, resolution=0.8×0.8×1mm3) were acquired for reference R2 and R2* maps.6[χ-separation for UKB protocol] The R2* map of the UKB protocol datasets (2 echoes, 3mm thickness) suffered from errors and B0-field inhomogeneity artifacts,7 which resulted in inaccurate χ-separation results. Hence, we developed an additional network (R2* denoising network) that infers R2* values of GRE1mm (4 echoes, 1mm thickness) from GRE3mm data (2 echoes, 3mm thickness). A local field map is generated from GRE3mm data using the same protocol as the UKB QSM protocol.8 For R2 mapping, two neural networks were trained to generate R2 maps for two different input types (Fig. 1). The first network (UKBT1w+FLAIR) was trained using the input of MPRAGE+T2-FLAIR. The second network (UKBFLAIR) utilized only T2-FLAIR as an input. Lastly, the R2 map can be assumed to have a constant value of mean R29 (15.5 Hz; UKBConstant). Using local field and R2’ maps, iLSQR10-style χ-separation1 was conducted to reconstruct χpos and χneg. For a reference χ-separation map (ReferenceUKB), the same χ-separation processing is conducted with the reference R2 from MESE, R2* from GRE1mm, and local frequency maps from GRE3mm (resampled to 1.05×1×3mm3 resolution if necessary).
[χ-separation for routine clinical protocol] To demonstrate the feasibility of χ-separation application to a routine clinical scan that contains T2-weighted images and multi-echo GRE images, we utilized MESE and GRE1mm from our scan. Using the MESE data, T2-weighted images were synthesized by considering the turbo spin-echo phase encoding. GRE1mm was resampled to 2mm thickness and used for the generation of local field and R2* maps. R2* denoising network was not used. R2 mapping network with the input of a T2-weighted image (CLT2w) was trained to produce a reference R2 map. Similar to the UKB application, an additional reconstruction with constant R2 (15.5 Hz; CLConstant) was performed. The χ-separation with reference R2 from MESE was also conducted to generate reference χ-separation maps (ReferenceCL).
[Deep neural network] All deep neural networks share the same structure of Unet5 with fully connected layers on the backend. Training was conducted with an L1 loss between output and reference.
[Evaluation] Nine subjects were utilized for the validation of the proposed methods. The χpos and χneg maps from UKBT1w+FLAIR, UKBFLAIR, and UKBConstant were compared to those of ReferenceUKB, and normalized root-mean-squared error (NRMSE), peak signal-to-noise ratio (PSNR), and structural similarity (SSIM) were calculated within a brain mask while masking out CSF. Similarly, the χ-separation results from CLT2w and CLConstant are compared to ReferenceCL. We also generated group-averaged χ-separation maps from UKBT1w+FLAIR and ReferenceUKB by normalizing them to the MNI space.11
Results
The χ-separation maps of UKBT1w+FLAIR, UKBFLAIR, and UKBConstant (Fig. 2) demonstrate consistent results when compared with those of ReferenceUKB. As expected, UKBT1w+FLAIR shows the best performance (NRMSE = 54.4±4.7% vs 56.3±5.7% for UKBFLAIR and 60.6±4.3% for UKBConstant; see Fig. 2b for PSNR and SSIM, same trend) in the reconstruction of χpos and χneg maps. When the χ-separation results from the clinical routine are evaluated (Fig. 3), CLT2w shows great reconstruction accuracy when compared to that of ReferenceCL (NRMSE = 25.5±3.0% vs 36.0±1.9% for CLConstant; see Fig. 3b for PSNR and SSIM, same trend). The zoomed-in χpos and χneg maps (Fig. 4) confirm that UKBT1w+FLAIR and CLT2w results show similar structures to those of the references, revealing details of iron and myelin distribution in the brain. Figure 5 demonstrates the χ-separation-averaged templates of ReferenceUKB and UKBT1w+FLAIR, revealing similar susceptibility distribution.Conclusion and Discussion
In this study, we developed a pipeline for reconstructing χ-separation maps from the UK Biobank protocol dataset and a routine clinical scan dataset by leveraging a deep neural network. For the UKB application, a network using both MPRAGE and T2-FLAIR demonstrated the best correspondence to the reference data. Moreover, even data with the constant R2 reported a good match to the reference χ-separation maps. Our results suggest that χ-separation can be applied to existing large-scale data including UKB dataset. Using this method, we will explore full UKB data, potentially benefiting from the large population dataset.Acknowledgements
This work was supported by the BK21 FOUR program of the Education and Research Program for Future ICT Pioneers, Seoul National University in 2021, and also supported by National Research Foundation of Korea (NRF) grant funded by the Korea government(MSIT) (No. NRF-2021R1A2B5B03002783).
References
- Shin, Hyeong-Geol, et al. "𝜒-separation: Magnetic susceptibility source separation toward iron and myelin mapping in the brain." NeuroImage 240 (2021): 118371.
- Chen, Jingjia, et al. "Decompose quantitative susceptibility mapping (QSM) to sub-voxel diamagnetic and paramagnetic components based on gradient-echo MRI data." NeuroImage 242 (2021): 118477.
- Emmerich, Julian, et al. "On the separation of susceptibility sources in quantitative susceptibility mapping: Theory and phantom validation with an in vivo application to multiple sclerosis lesions of different age." Journal of Magnetic Resonance 330 (2021): 107033.
- Miller, Karla L., et al. "Multimodal population brain imaging in the UK Biobank prospective epidemiological study." Nature neuroscience 19.11 (2016): 1523-1536.
- Jeong, Hwihun, et al. “DeepTSE-T2: Deep learning-powered T2 mapping with B1+ estimation using a product double-echo Turbo Spin Echo sequence” ISMRM 2021
- Lebel, R. Marc, and Alan H. Wilman. "Transverse relaxometry with stimulated echo compensation." Magnetic resonance in medicine 64.4 (2010): 1005-1014.
- Han, Dongyeob, et al. "Volumetric R2* mapping using z‐shim multi‐echo gradient echo imaging." Magnetic resonance in medicine 73.3 (2015): 1164-1170.10.
- Wang, Chaoyue, et al. "Phenotypic and genetic associations of quantitative magnetic susceptibility in UK Biobank brain imaging." bioRxiv (2021).
- McPhee, Kelly C., and Alan H. Wilman. "T1 and T2 quantification from standard turbo spin echo images." Magnetic resonance in medicine 81.3 (2019): 2052-2063.
- Li, Wei, et al. "A method for estimating and removing streaking artifacts in quantitative susceptibility mapping." Neuroimage 108 (2015): 111-122.
- Ashburner, John, and Karl J. Friston. "Unified segmentation." Neuroimage 26.3 (2005): 839-851.
Figures
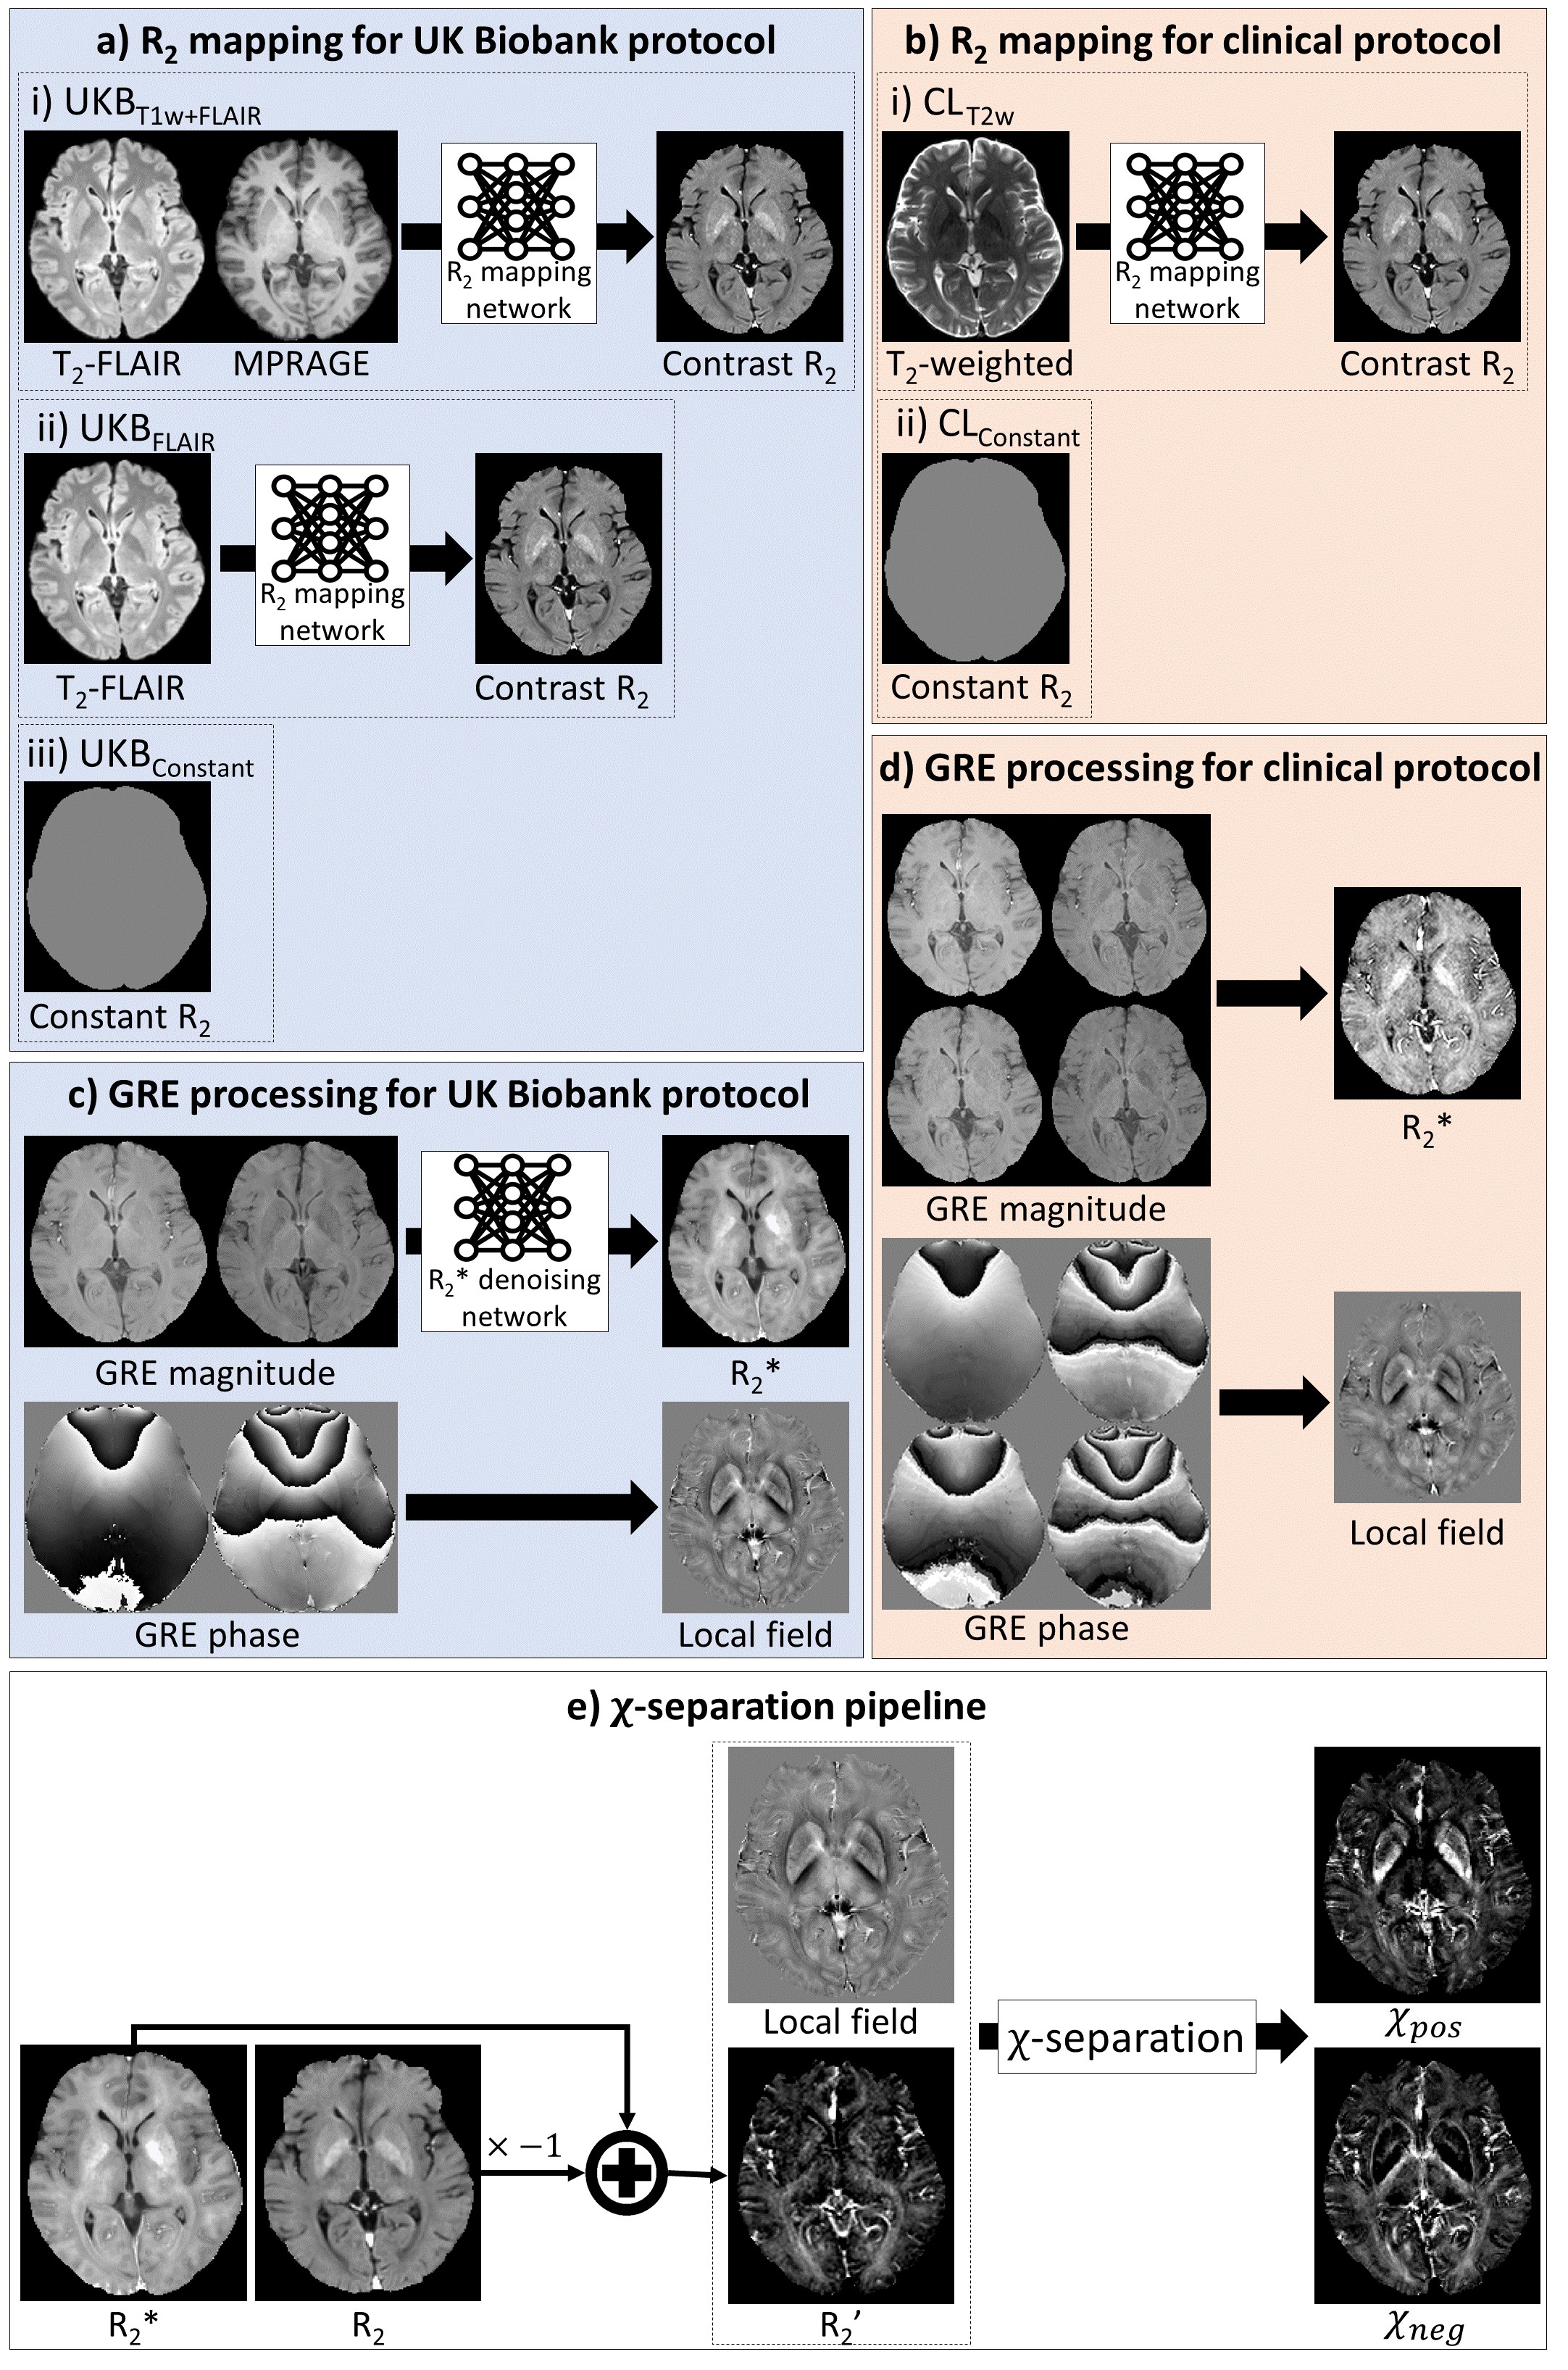
Figure 1. Methods for generating R2, R2*, and local field maps. (a) For the UKB, three methods were tested: (i) R2 mapping network using MPRAGE and T2-FLAIR (UKBT1w+FLAIR), (ii) R2 mapping network using T2-FLAIR (UKBFLAIR), and (iii) constant R2 (UKBConstant). (b) For the clinical routine, methods were tested: (i) R2 mapping network using T2-weighted image (CLT2w), (ii) constant R2 (CLConstant). (c) For the R2* map of UKB, neural network was used. (d) For the clinical protocol, conventional processing is utilized. (e) Using R2, R2* and local field maps, χ-separation is performed.
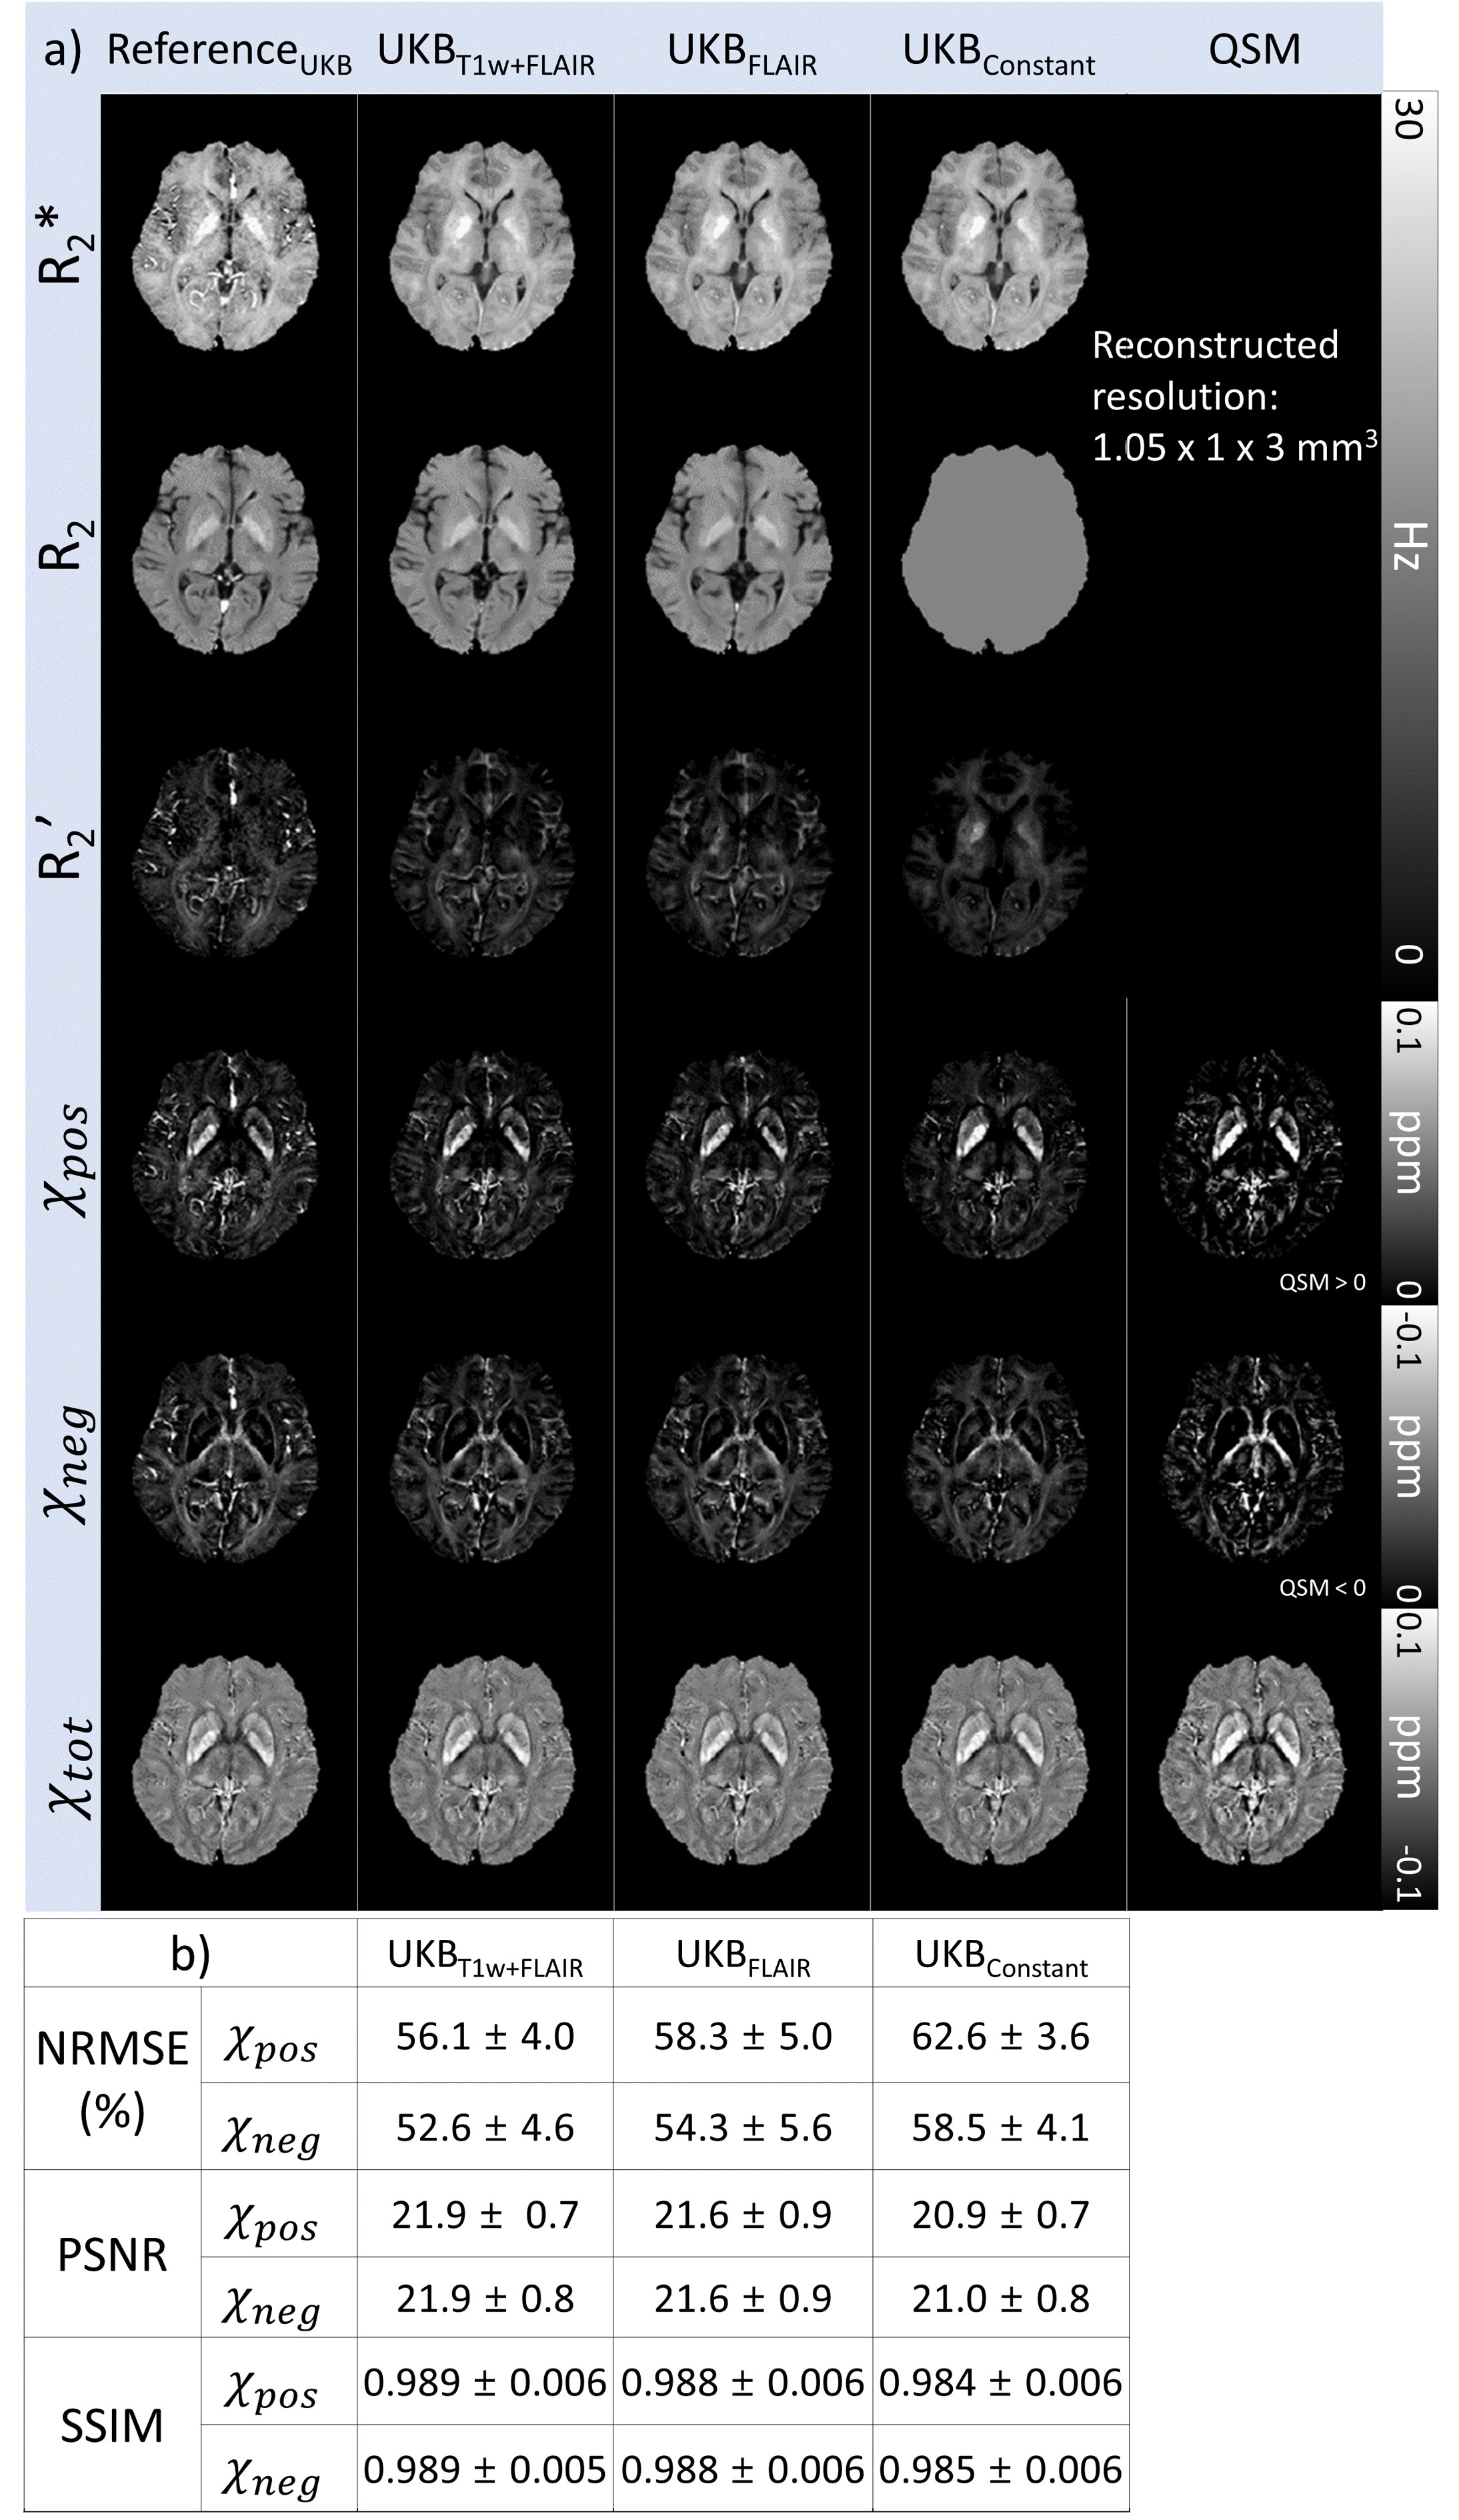
Figure 2. (a) Results of R2*, R2, R2’, χpos, χneg, and χtot (= χpos + χneg) maps of the UK Biobank protocol data. (b) NRMSEs, PSNRs, and SSIMs between ReferenceUKB and the other methods. The UKBT1w+FLAIR results show the best metric values among all the R2 mapping methods.
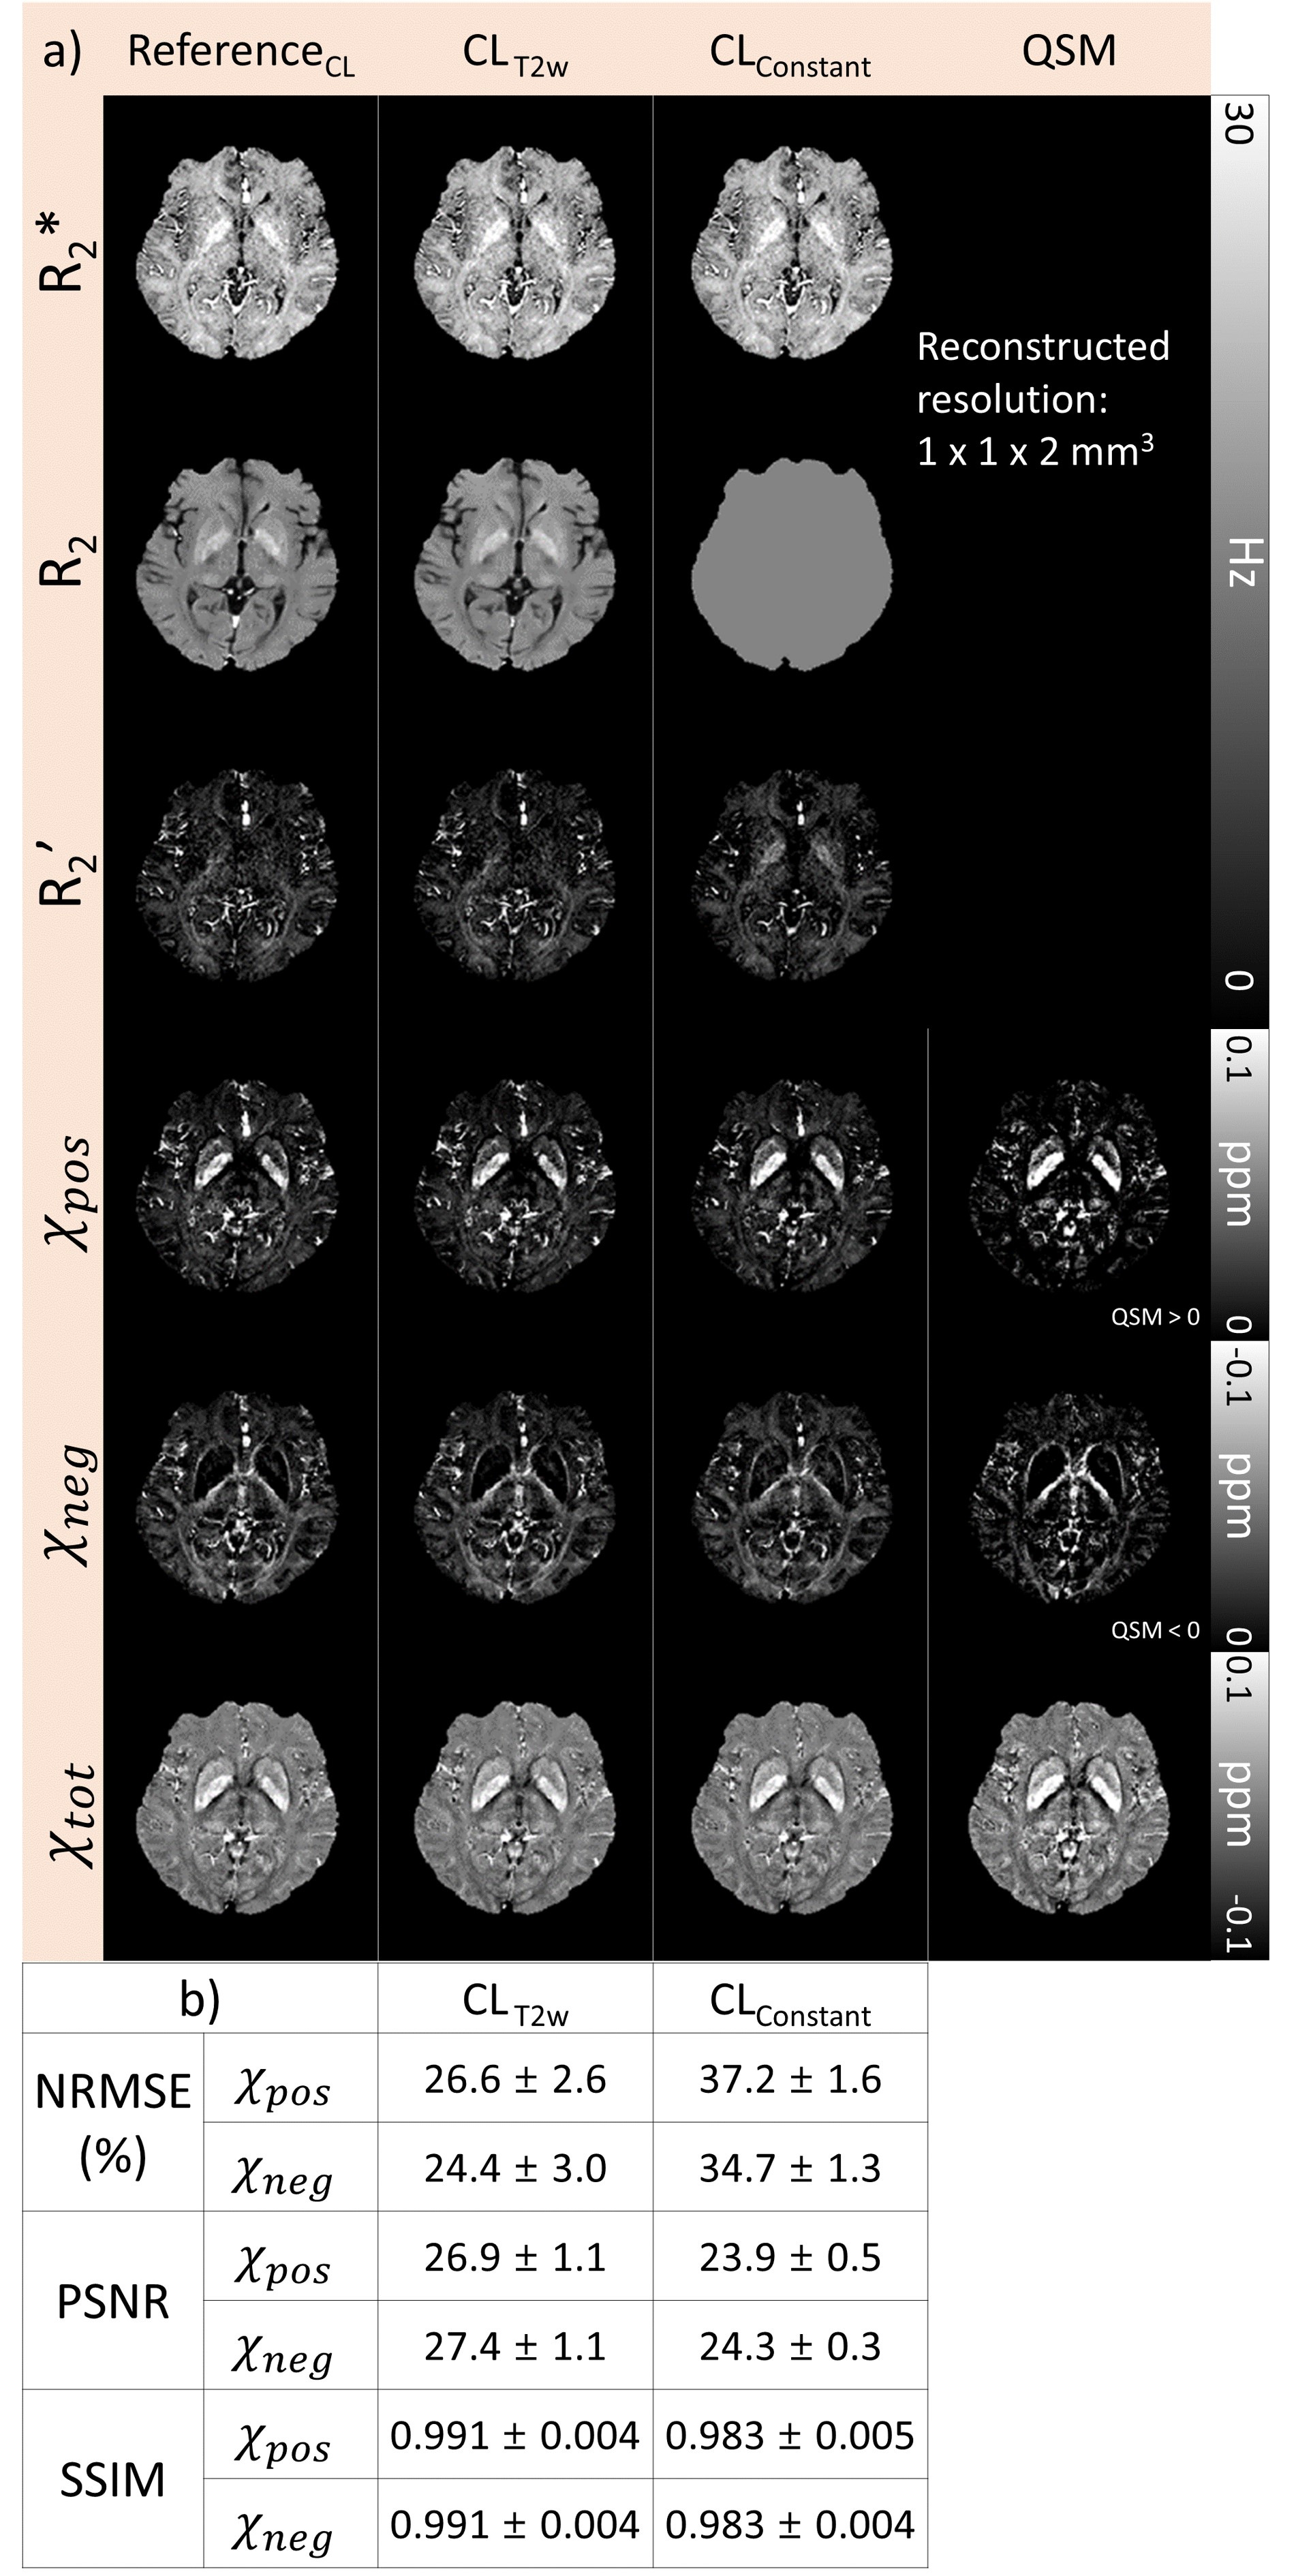
Figure 3. (a) Results of R2*, R2, R2’, and χpos, χneg, and χtot (= χpos + χneg) maps of the clinical routine data. (b) NRMSEs, PSNRs, and SSIMs between the reference and other methods. The χ-separation results from CLT2w report lower NRMSE, and higher PSNR and SSIM than those from CLConstant.
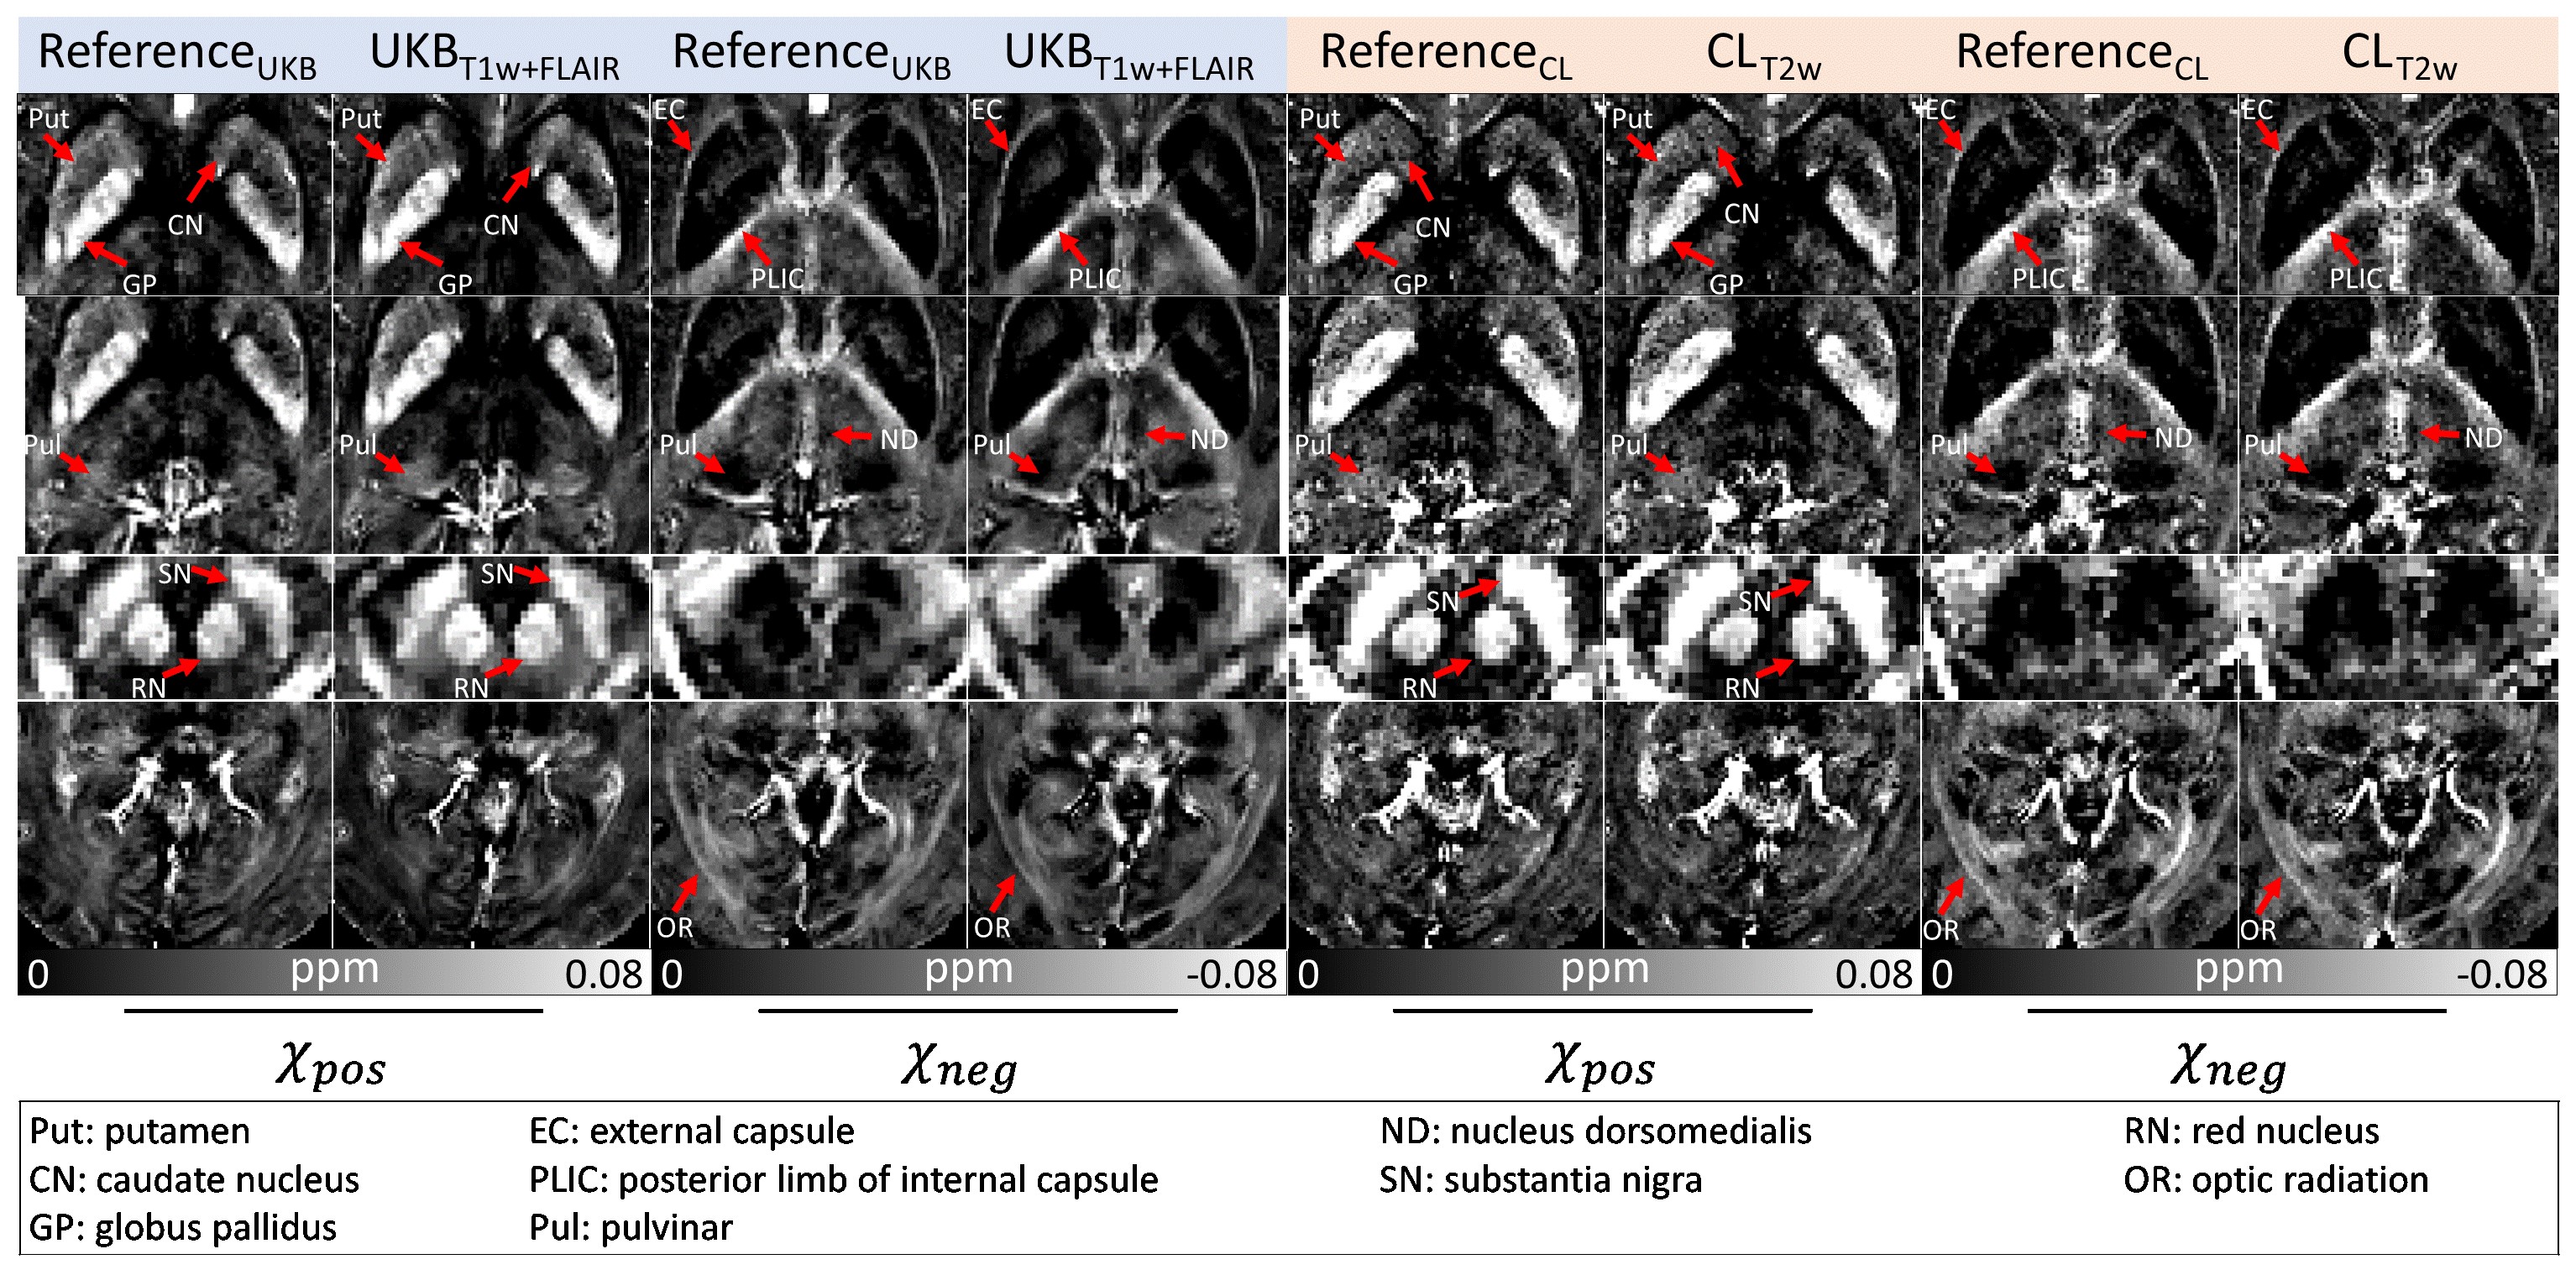
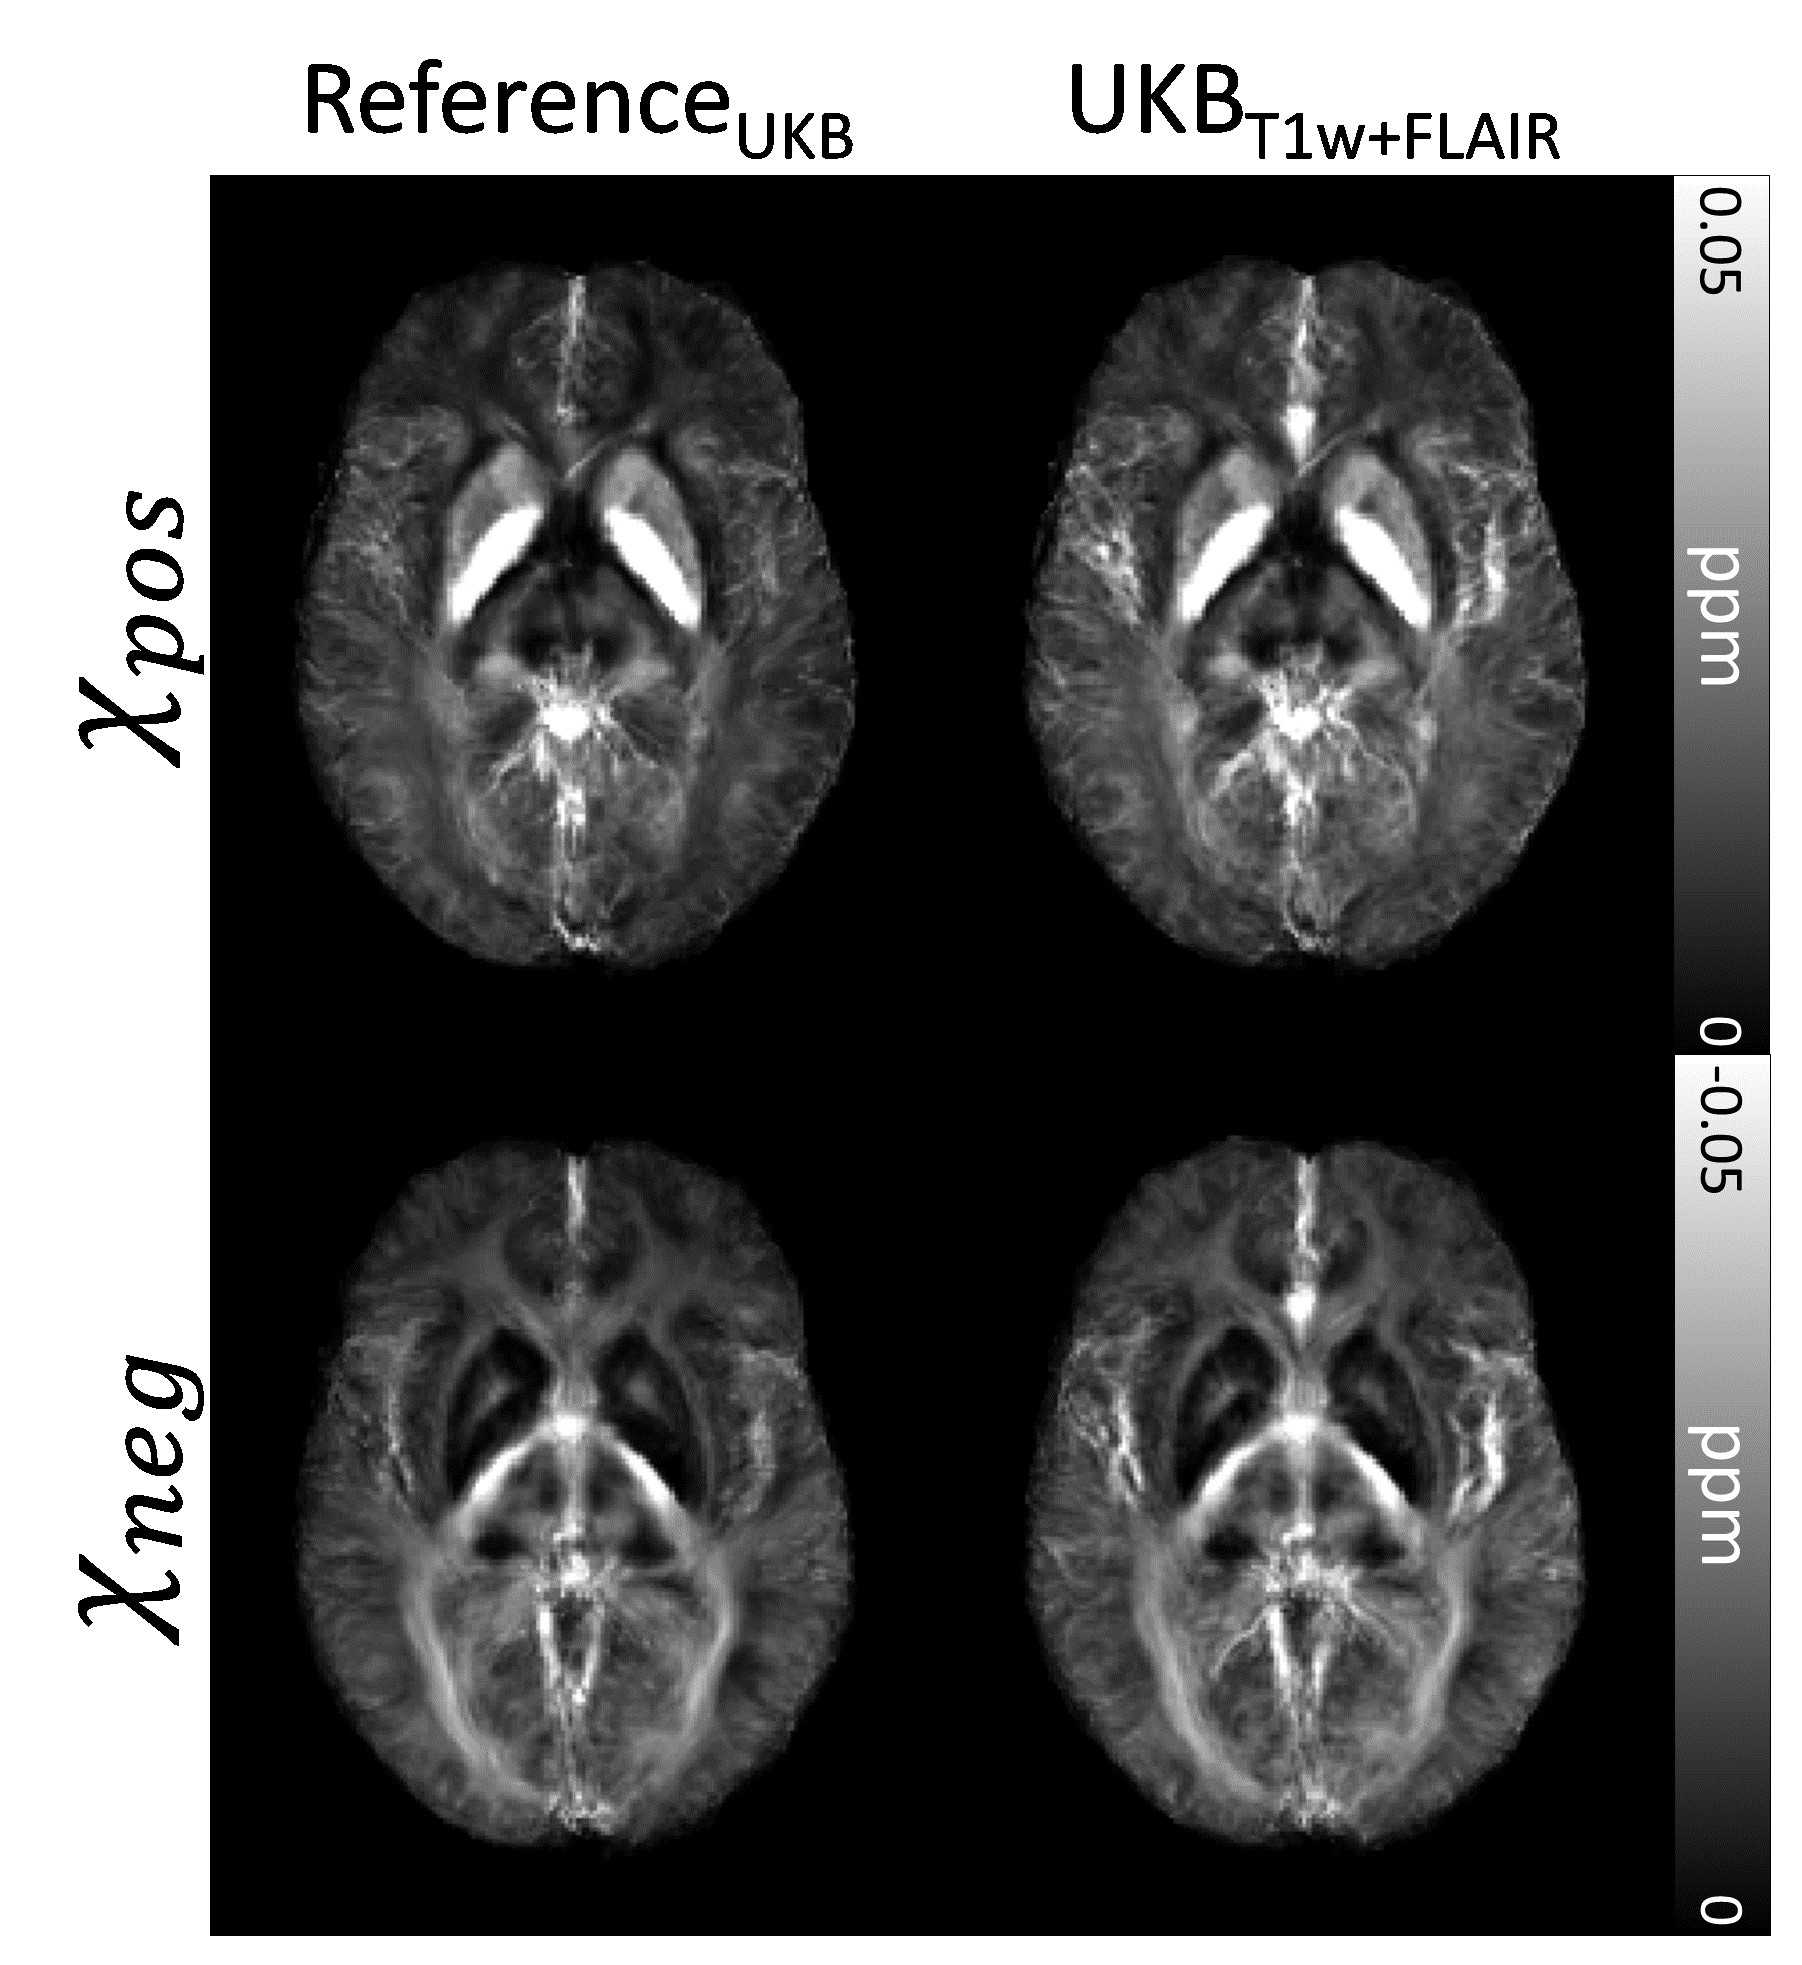
Figure 5. MNI-template registered and averaged χ-separation maps of the nine test subjects. The averaged maps from UKBT1w+FLAIR demonstrate a similar contrast to those of ReferenceUKB.