2363
Phase filtering methods significantly impact the quality of susceptibility tensor reconstruction1Electrical Engineering and Computer Sciences, University of California, Berkeley, Berkeley, CA, United States, 2Helen Wills Neuroscience Institute, University of California, Berkeley, Berkeley, CA, United States
Synopsis
Phase filtering is a very important step in obtaining a good susceptibility tensor. We compare and illustrate the effects of different phase processing methods on the quality of susceptibility tensor reconstruction with different numbers of orientations. In general, tensor reconstructed from variations of the SHARP phase filtering methods show the most robustness against the large field inhomogeneity and produce tensor elements that are spatially and anatomically more consistent. Compared to the original STI reconstruction, asymmetric STI reduces some of the variations induced by phase filtering methods.
Introduction
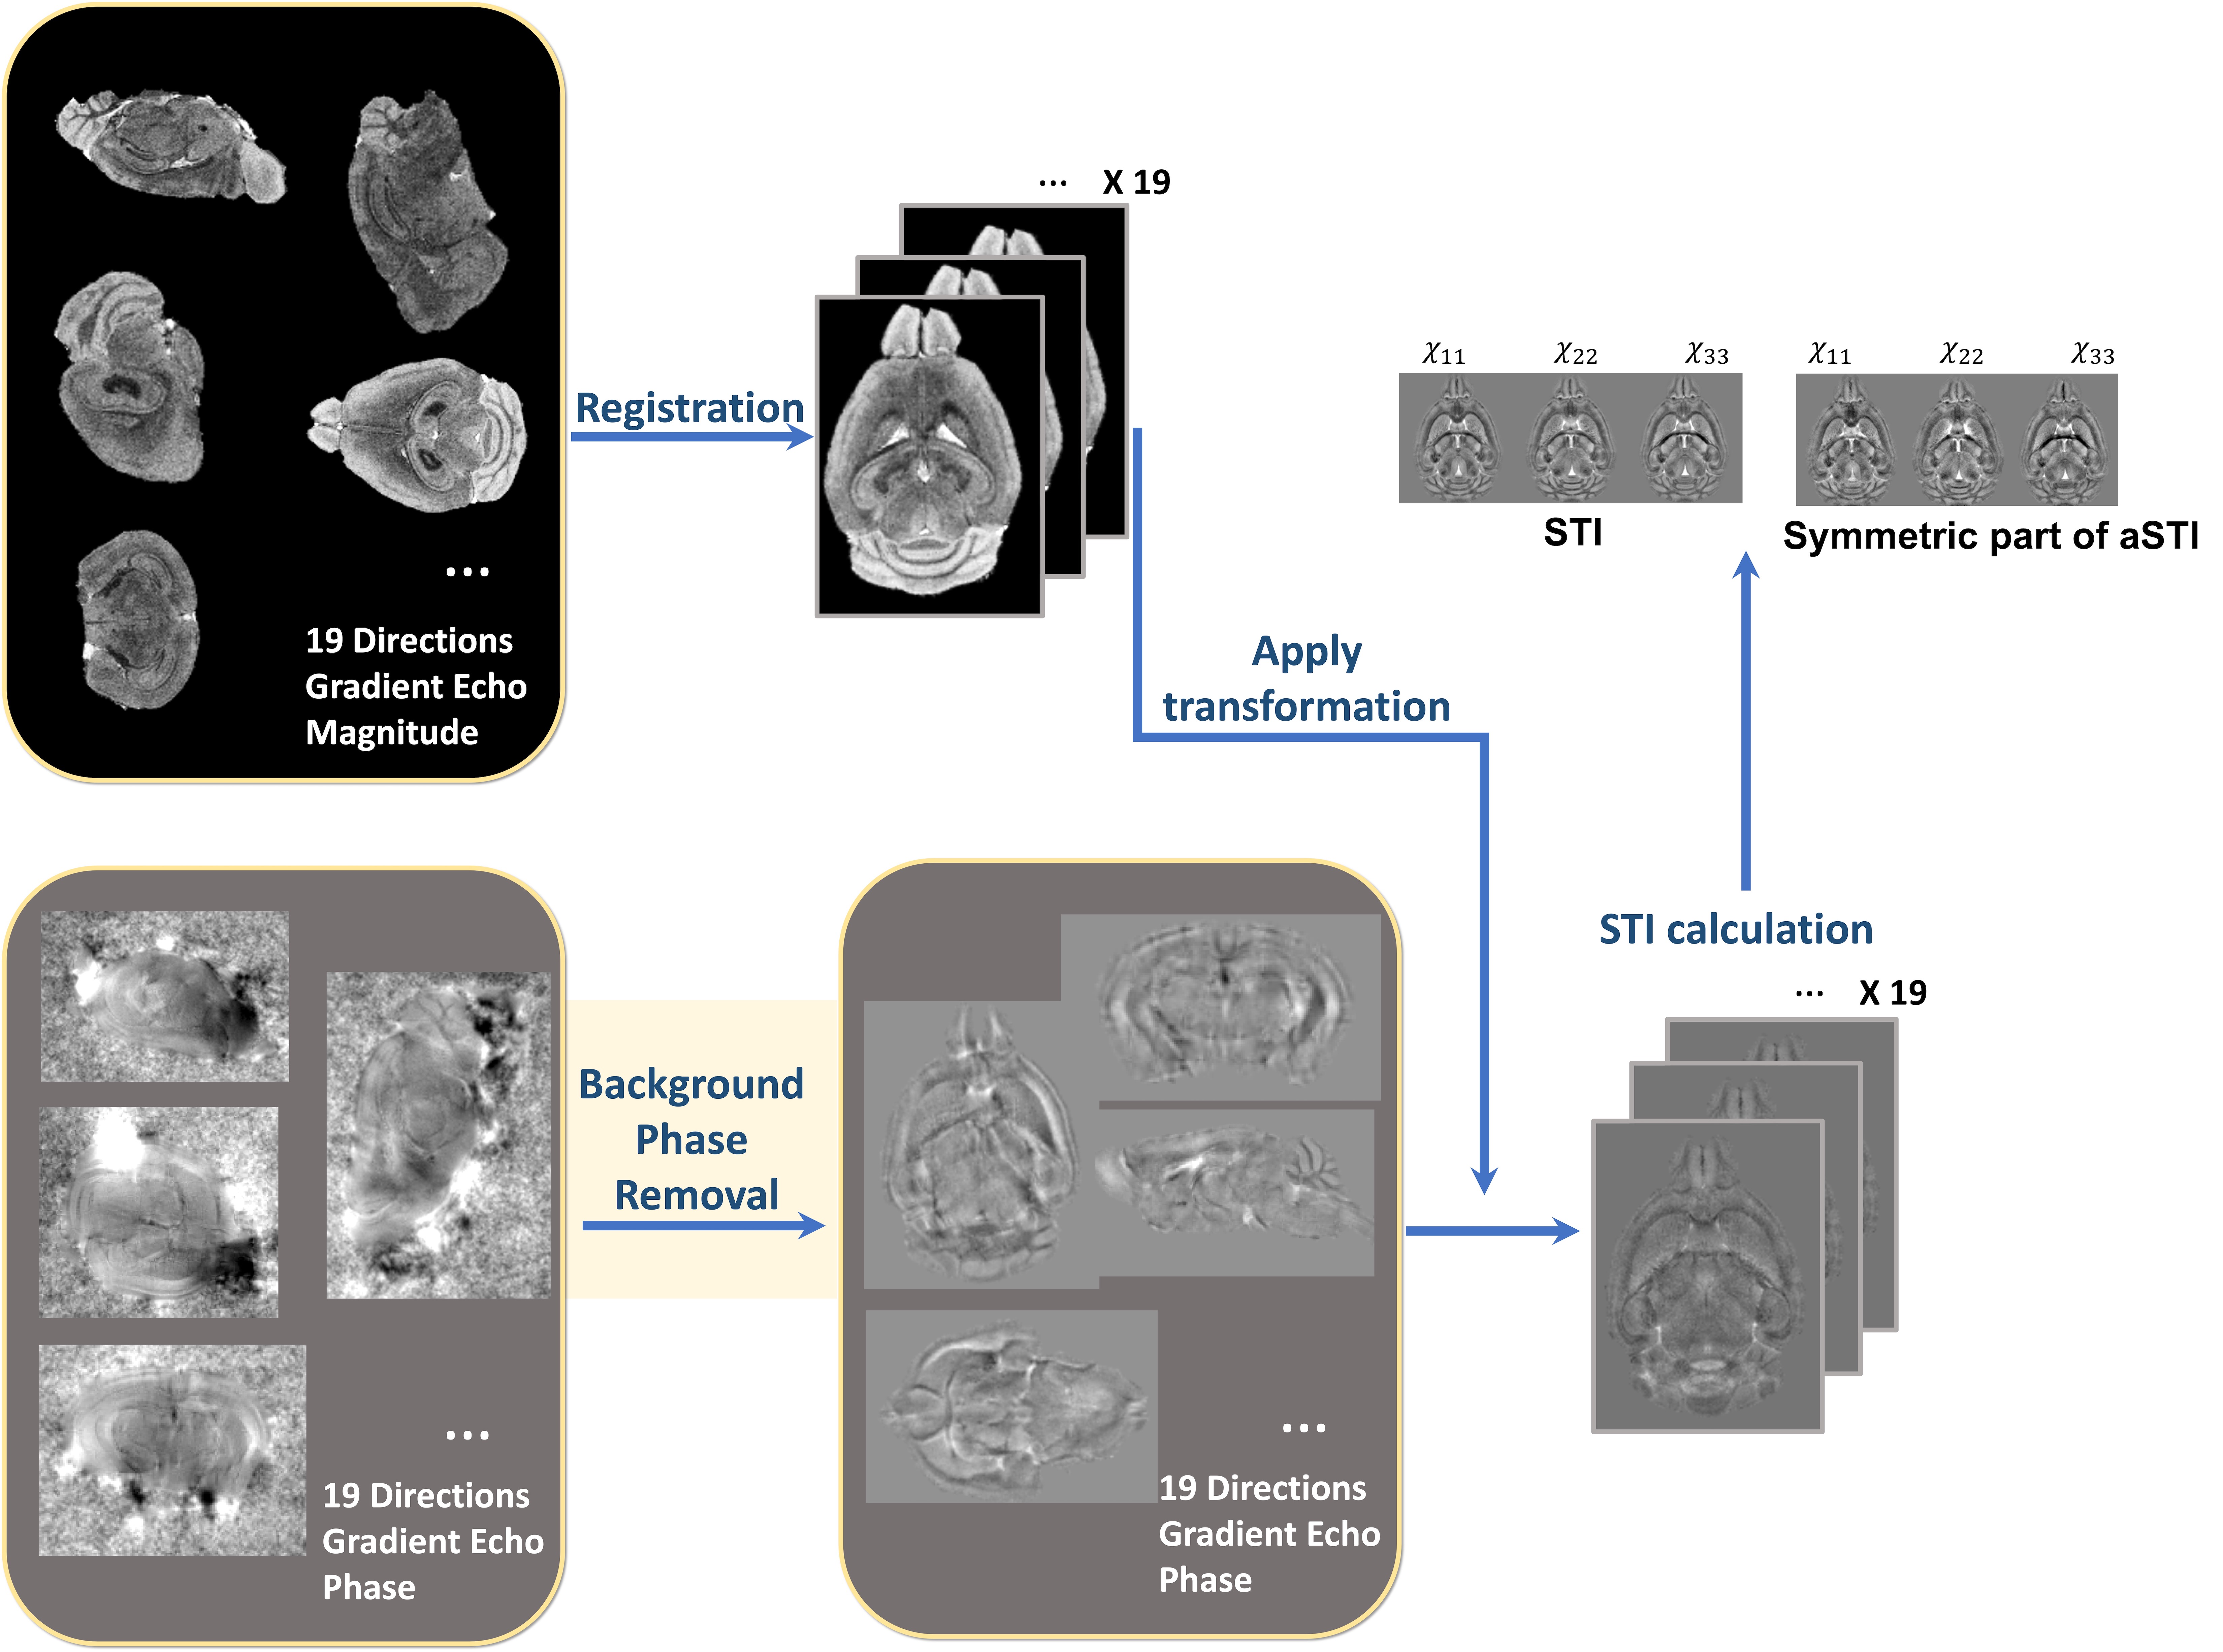
Biological tissue’s magnetic susceptibility perturbs the magnetic field inside the MRI scanner. The phase of gradient echo (GRE) signals captures this perturbation1. Quantitative susceptibility mapping (QSM)2 measures the scalar magnetic susceptibility. On the other hand, susceptibility tensor imaging (STI) measures the anisotropic susceptibility via a second-order tensor. Along with diffusion tensor imaging (DTI), STI provides complimentary information on the structure anisotropy of biological tissue3. STI reconstruction generally follows the pipeline shown in Figure1: phase of the GRE signal is unwrapped and filtered to remove the background field, followed by aligning measurements from all angles to one reference orientation. Several background phase removal algorithms exist and they have a significant impact on the accuracy of QSM maps4,5. Since STI measures susceptibility variations across different orientations, variations due to phase processing will introduce errors in the tensor estimation. Here, we compare six commonly used methods of phase filtering in two tensor reconstruction methods to investigate the effects of background phase removal methods on the quality of STI.Methods
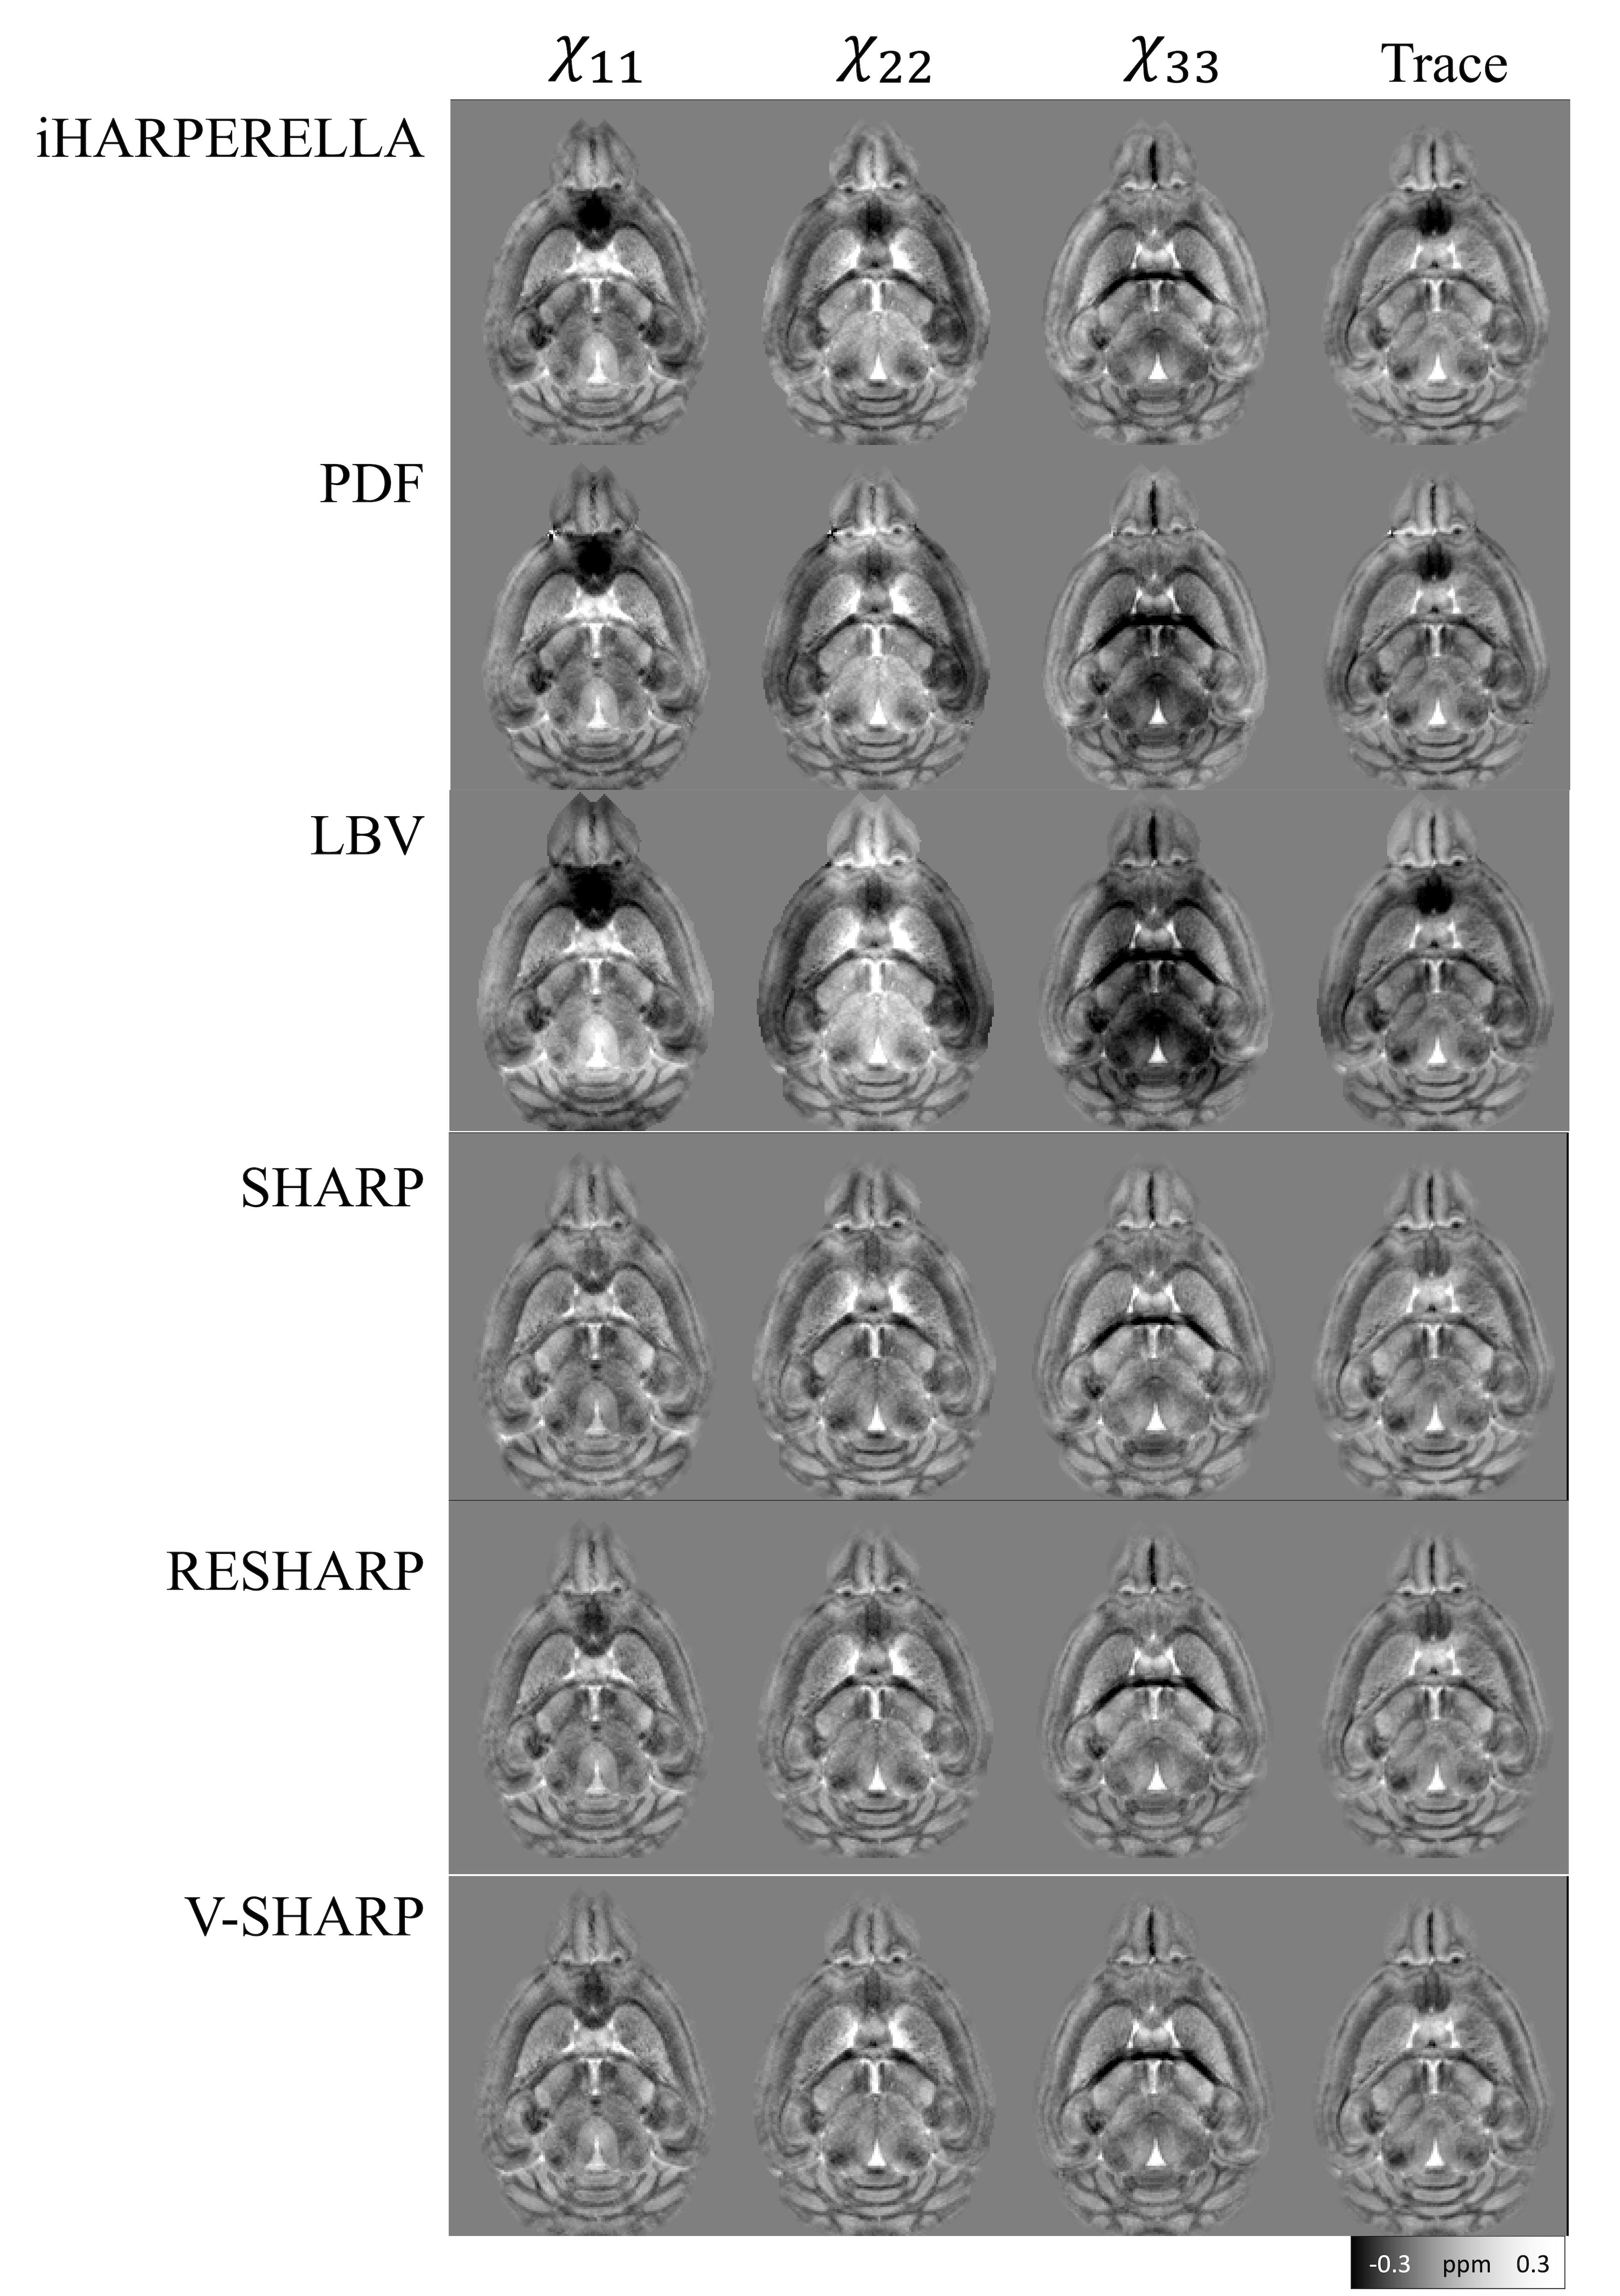
GRE data of a postmortem mouse brain were collected at 19 orientations6. Briefly, the imaging parameters were: B0=7T, TE/TR=8.0/50ms, voxel-size=0.08mm isotropic.The phase was unwrapped with the Laplacian-based phase unwrapping method2. Afterwards, six major phase filtering methods were included in the test. Sources of MATLAB scripts are as follows: Sophisticated Harmonic Artifact Reduction for Phase7 (SHARP), Laplacian Boundary Value8 (LBV) and Regularization-enabled SHARP9 (RESHARP) ware obtained from online resources10, Projection onto dipole fields11 (PDF) was obtained from MEDI toolbox12,13, improved HARmonic (background) PhasE REmovaL using the Laplacian operator14 (iHARPERELLA) and Variable-radius SHARP15 (VSHARP) were obtained from STISuite16. All methods were used with masks with potential boundary erosion size considered, ensuring the output tissue phase are in the same shape and size. Parameters used for each method are iHARPERELLA: padsize=12; RESHARP: kernel_size=3, tolerance=0.001; LBV: tolerance=0.01; SHARP: kernel_size=3; tolerance=0.05; V-SHARP: smvsize=12.
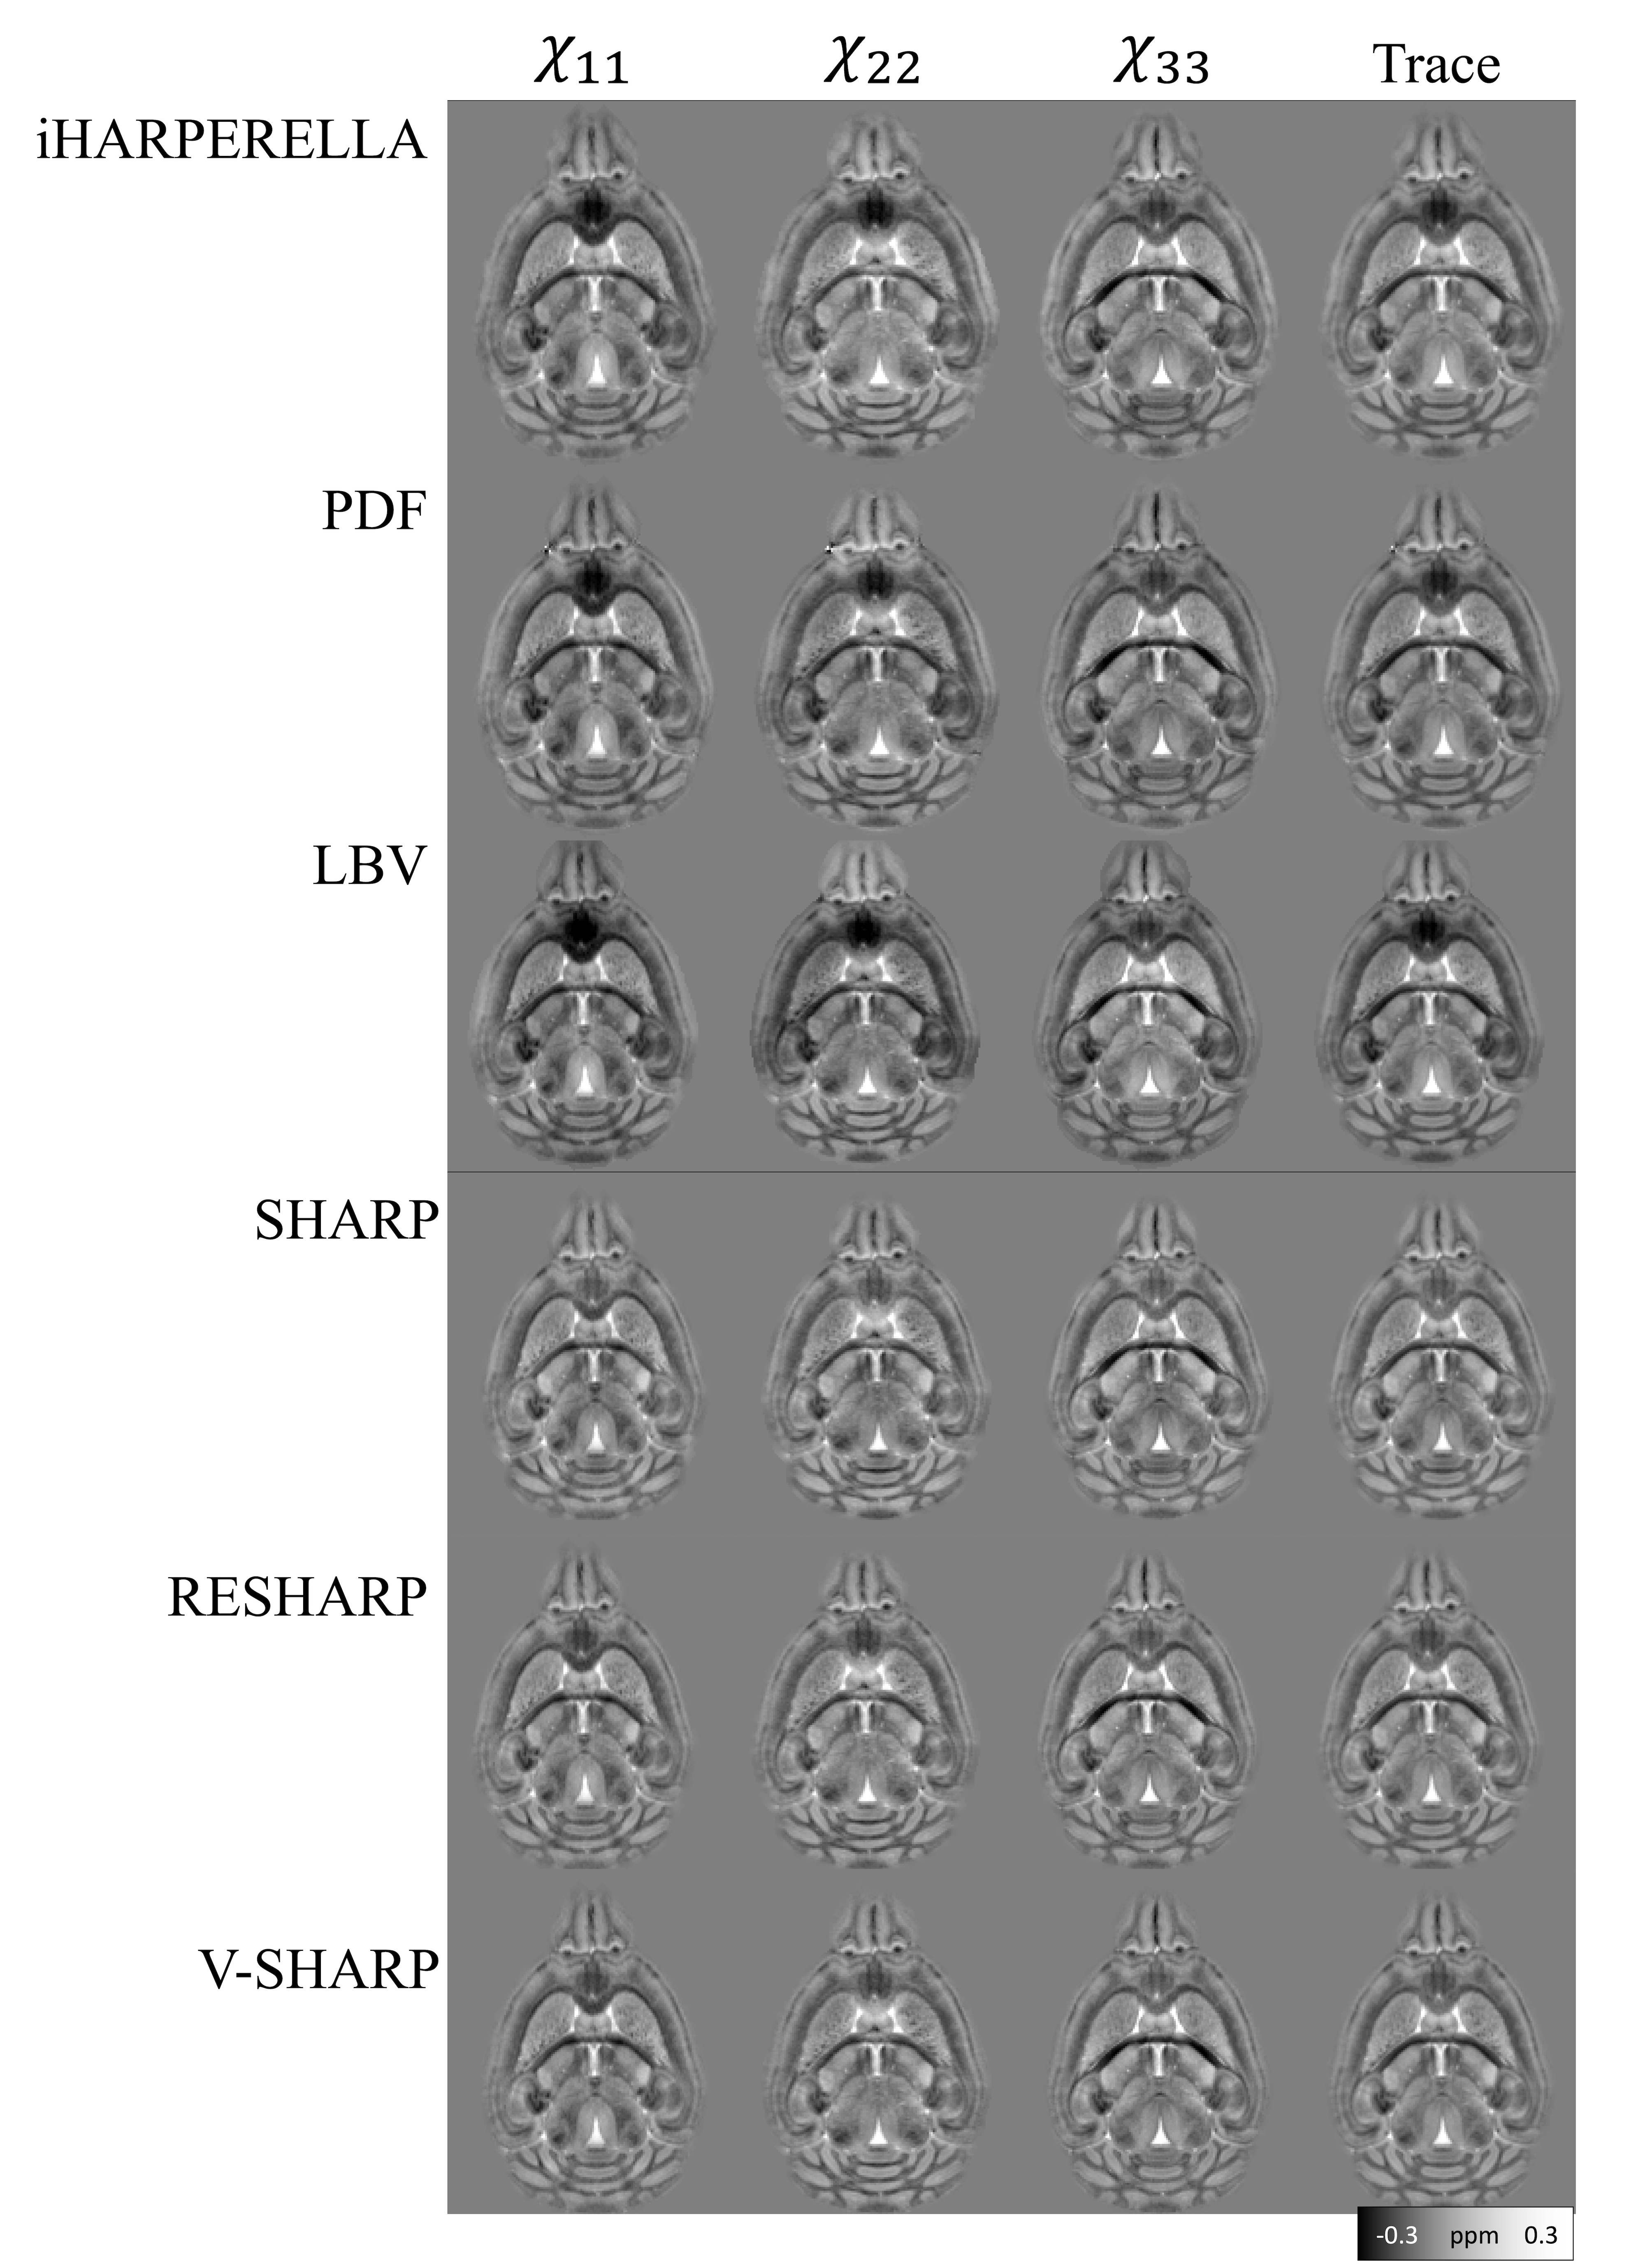
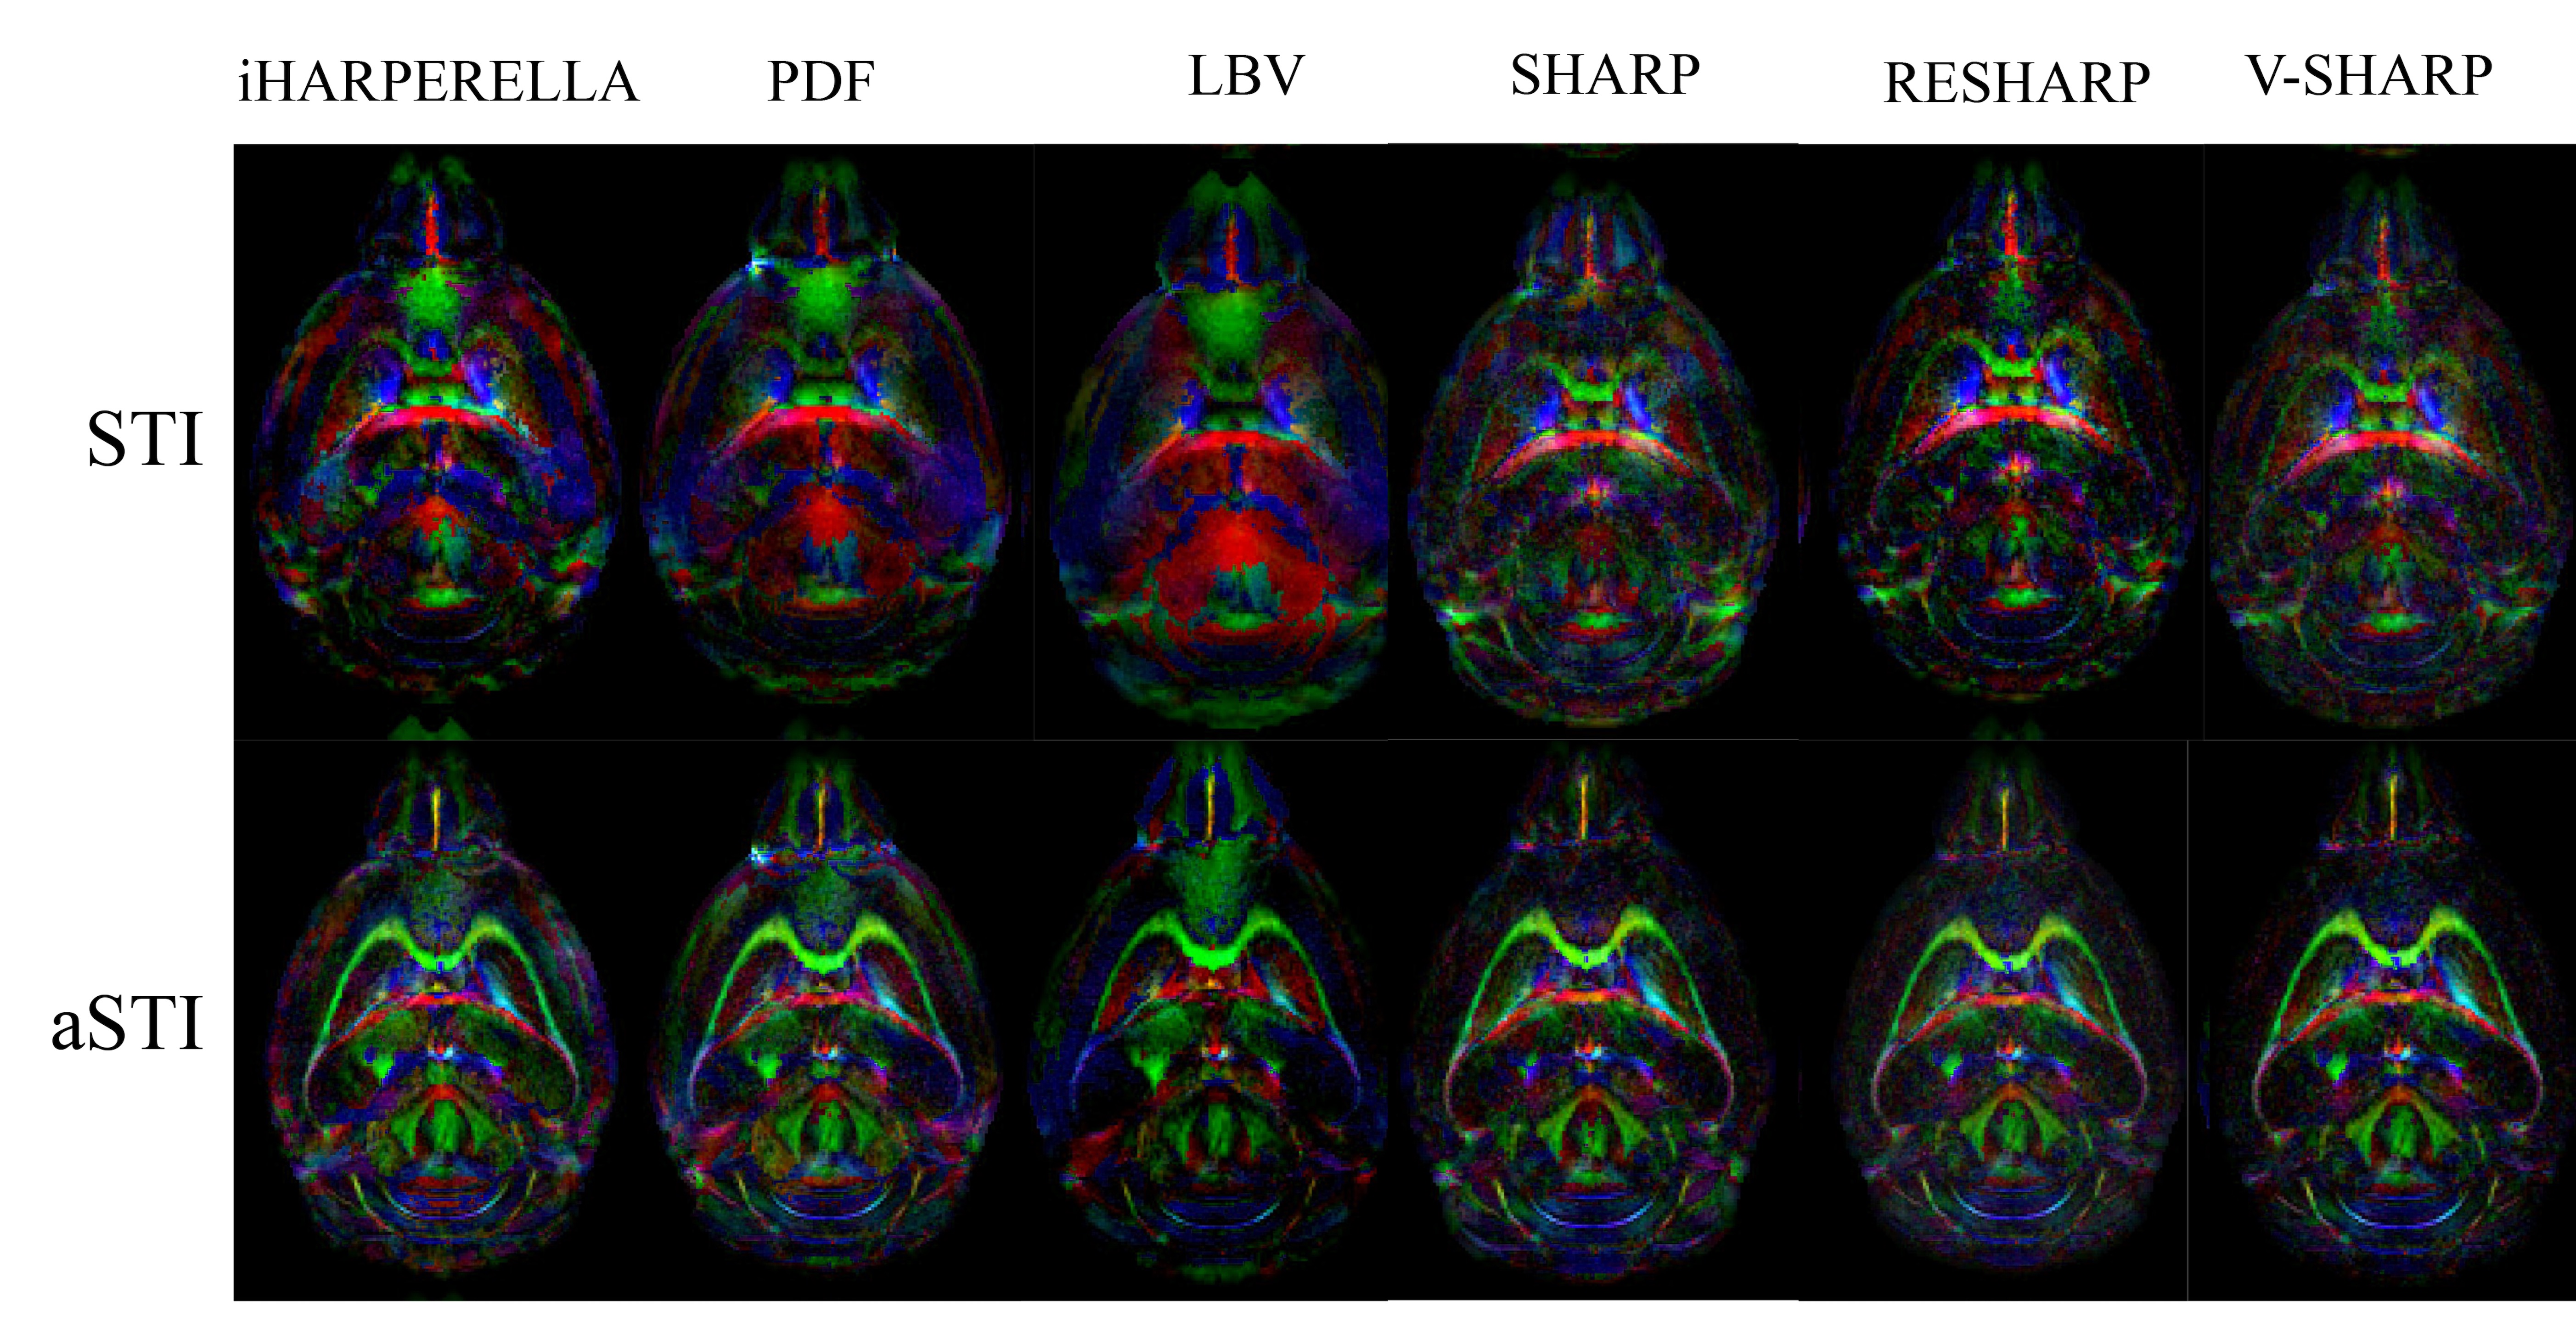
Registration was performed using ITKsnap17 on each orientation’s magnitude image. After manual alignment with the reference volume, a mutual information metric was used to obtain affine transformations, which were then applied to the filtered phase. Regular symmetric STI16 reconstruction and the recently introduced asymmetric STI18 (aSTI) were used to reconstruct the tensor. Susceptibility anisotropy (SA) defined as $$$\text{SA}=\text{eigVal}(1) - (\text{eigVal}(2)+\text{eigVal}(3))/2$$$ was calculated from eigen-decomposition of the tensor (the first eigenvalue is the largest). This SA quantity was used to weigh the primary eigenvector in color-coded maps.
Results
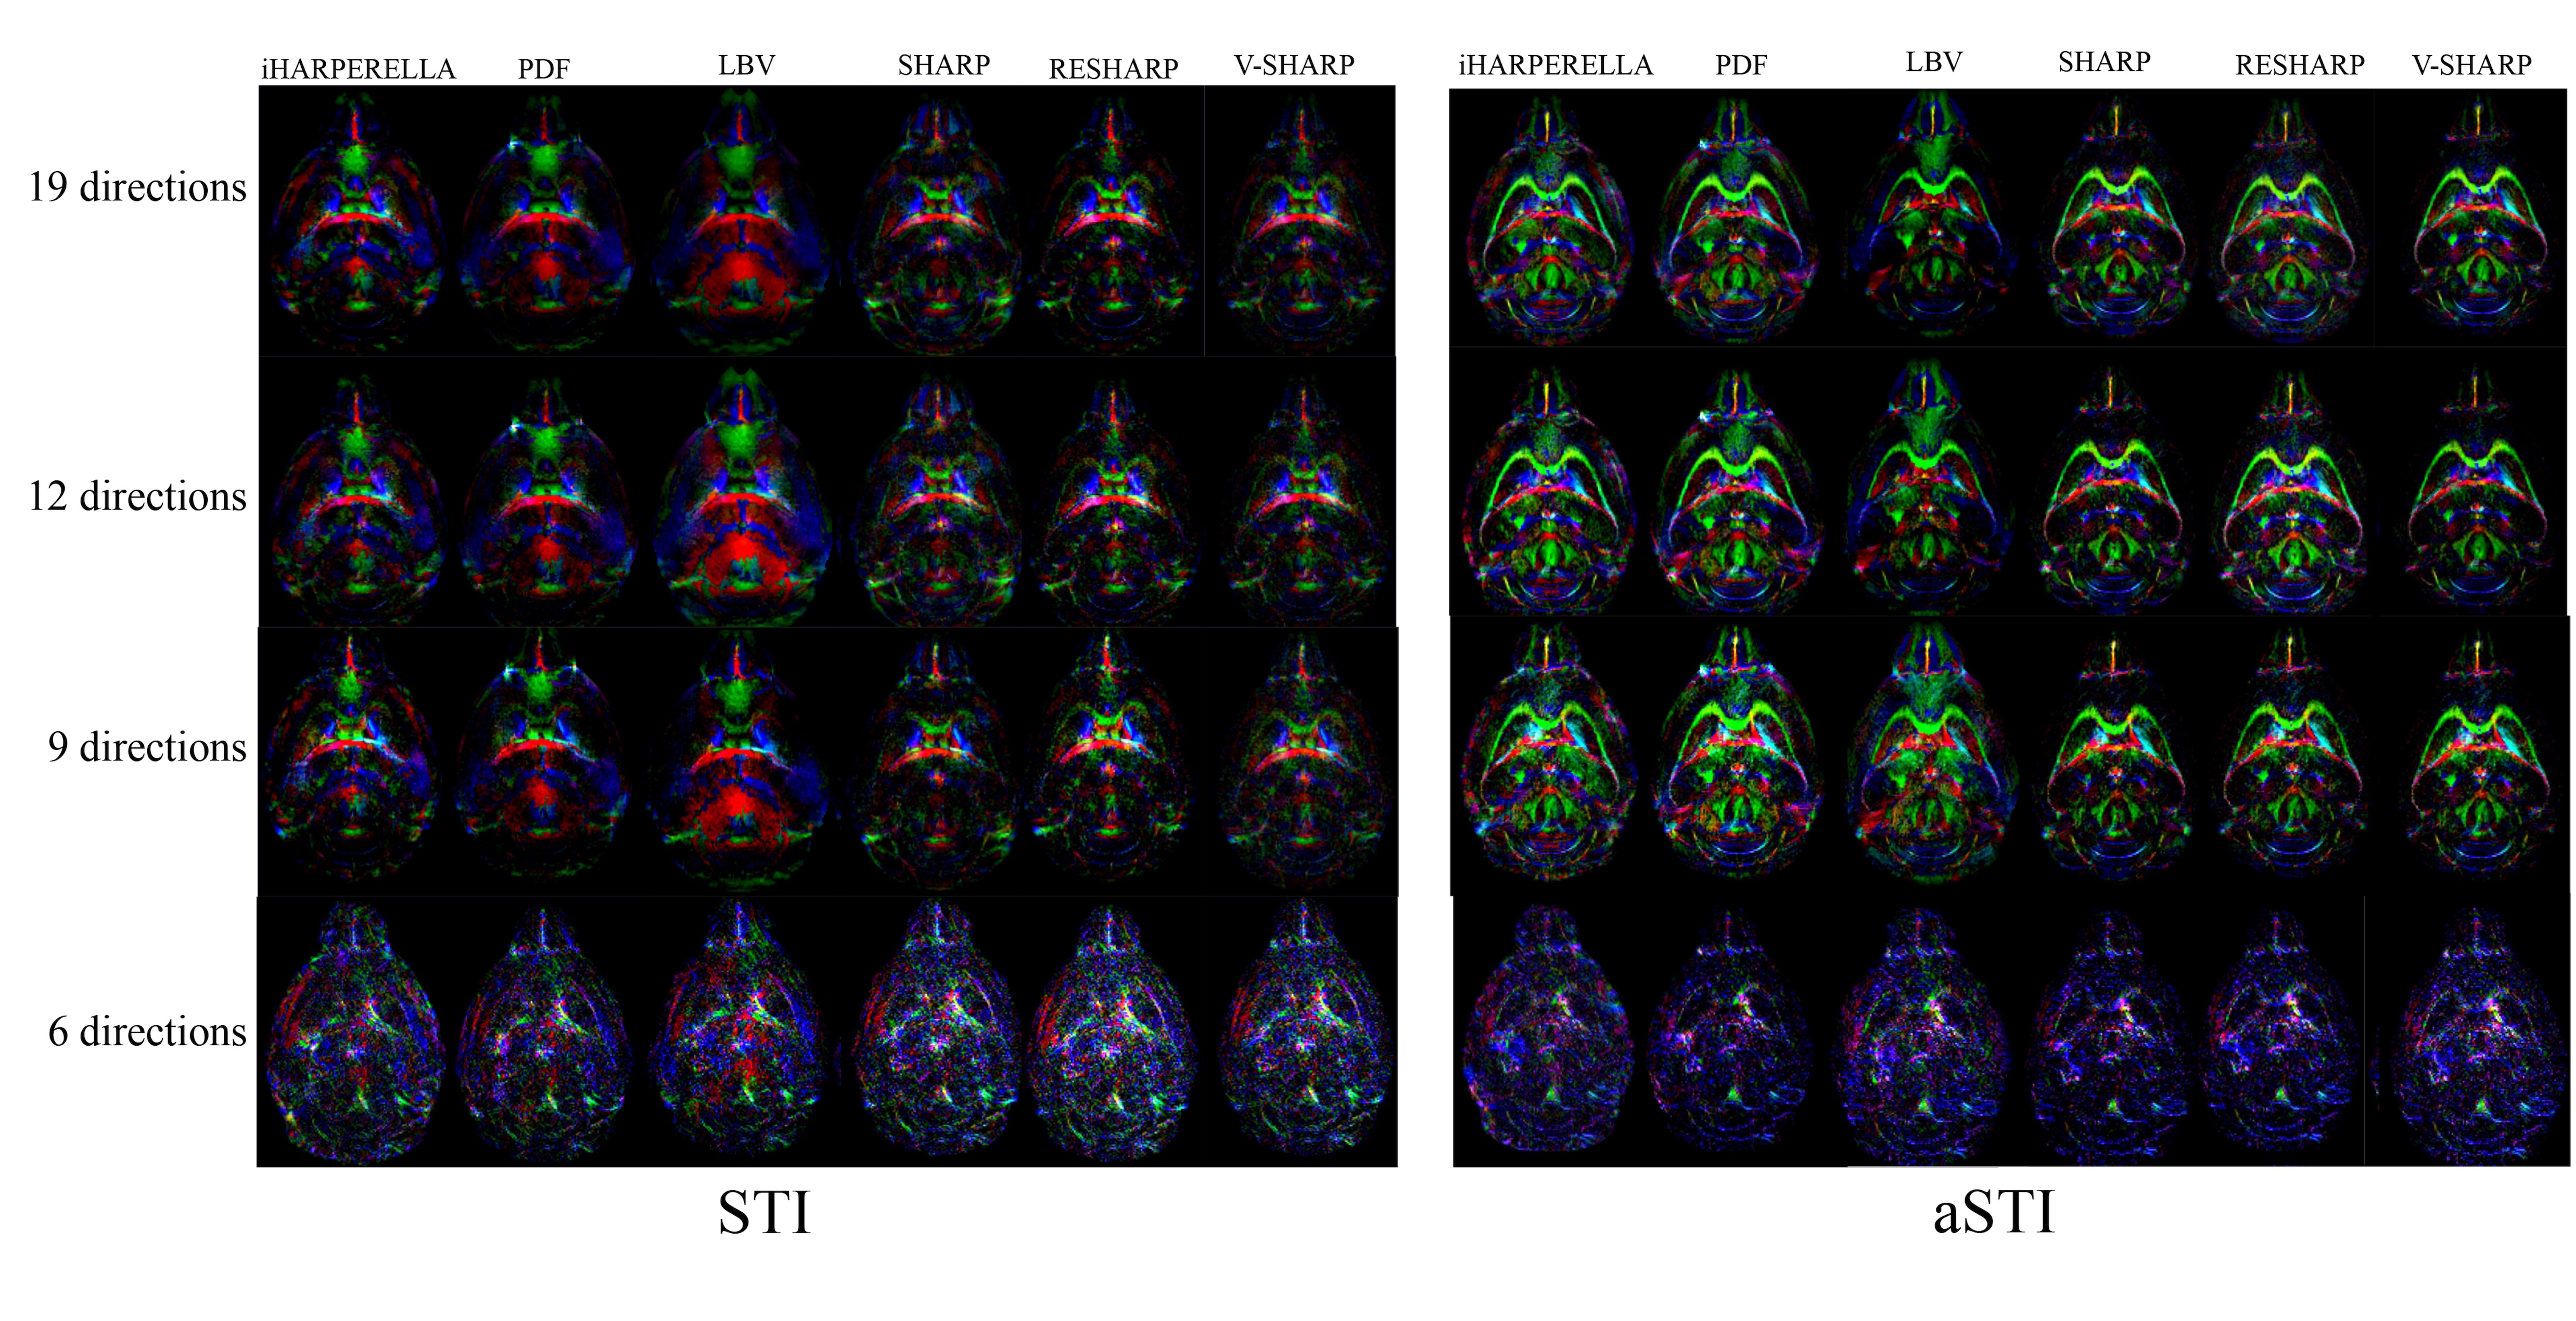
The iHARPERELLA, PDF and LBV methods result in tensor maps with significant variations that appear artificial as seen from the “dark” patches (Figure2). On the other hand, the SHARP, RESHARP and V-SHARP methods produce relatively consistent tensor maps that are free of such large “dark” patches (Figure2). Interestingly, regardless of the phase processing method, the artifacts seen in Figure2 are significantly reduced by using aSTI reconstruction (Figure3). The corresponding SA weighted primary eigenvector RGB map also shows similar results: variations of SHARP give vector maps that are more spatially coherent and aSTI is more robust to phase artifacts (Figure4). All methods, regardless of reconstruction algorithm used, have increased noise with decreasing orientation number and fail to produce meaningful results at 6 measurement orientations (Figure5).Discussion
It was previously reported5 that LBV and PDF are more accurate for noiseless data in simulations, however, for in vivo cases, where there exist large frequency shifts caused by air-water boundaries (e.g. sinus), SHARP based methods outperform LBV and PDF. We have observed similar effects. The artifacts from large air bubbles on the boundary of the ex vivo sample were successfully filtered by RESHARP, SHARP, and V-SHARP (Figures 2 and 3). More importantly, the phase filtering errors associated with iHARPERELLA, PDF and LBV vary significantly between orientations, resulting in significant errors in the tensor estimation and subsequently in the eigenvectors and eigenvalues. While these errors are prominent in the original symmetric STI reconstruction, aSTI is known18 to be more robust by absorbing artifacts into the antisymmetric part of the tensor. With both STI and aSTI, it’s consistently observed that variations of the SHARP (SHARP, RESHARP, V-SHARP) methods and iHARPERELLA return more coherent eigenvectors.As expected, tensors computed from all filtering methods become noisier with fewer directions. All methods failed when only 6 orientations of measurements were used, which suggests the minimum number of orientations needed for STI is 6 due to the lack of precise a priori control of the orientations.
Note that every method included here contains some level of flexibility of parameters tuning, while PDF requires pre-estimated noise level map for better performance. The parameters used in this study were chosen to achieve the reasonable results by visual inspections. The proper parameter choice may vary depending on the quality of raw unwrapped phase, which requires further systematic investigation.
Conclusion
V-SHARP, RESHARP and SHARP showed the most robustness towards large field perturbations close to the boundary, resulting in the most consistent tensor estimations. The aSTI method outperforms the conventional STI method in reducing phase filtering artifacts. With the same phase data, different phase filtering methods (or parameter choices) may yield informative or nearly useless STI anisotropy information. It is therefore critical to ensure that the background phase removal process was done properly and consistently across different orientations.Acknowledgements
The authors thank Victor Han for proofreading.References
(1) Wang, Y.; Liu, T. Quantitative Susceptibility Mapping (QSM): Decoding MRI Data for a Tissue Magnetic Biomarker. Magn. Reson. Med. 2015, 73 (1), 82–101. https://doi.org/10.1002/mrm.25358.
(2) Li, W.; Wu, B.; Liu, C. Quantitative Susceptibility Mapping of Human Brain Reflects Spatial Variation in Tissue Composition. NeuroImage 2011, 55 (4), 1645–1656. https://doi.org/10.1016/j.neuroimage.2010.11.088.
(3) Liu, C.; Murphy, N.; Li, W. Probing White-Matter Microstructure with Higher-Order Diffusion Tensors and Susceptibility Tensor MRI. Front. Integr. Neurosci. 2013, 7. https://doi.org/10.3389/fnint.2013.00011.
(4) Robinson, S. D.; Bredies, K.; Khabipova, D.; Dymerska, B.; Marques, J. P.; Schweser, F. An Illustrated Comparison of Processing Methods for MR Phase Imaging and QSM: Combining Array Coil Signals and Phase Unwrapping. Nmr Biomed. 2017, 30 (4). https://doi.org/10.1002/nbm.3601.
(5) Fortier, V.; Levesque, I. R. Phase Processing for Quantitative Susceptibility Mapping of Regions with Large Susceptibility and Lack of Signal. Magn. Reson. Med. 2018, 79 (6), 3103–3113. https://doi.org/10.1002/mrm.26989.(6) Liu, C.; Li, W.; Wu, B.; Jiang, Y.; Johnson, G. A. 3D Fiber Tractography with Susceptibility Tensor Imaging. NeuroImage 2012, 59 (2), 1290–1298. https://doi.org/10.1016/j.neuroimage.2011.07.096.
(7) Schweser, F.; Deistung, A.; Lehr, B. W.; Reichenbach, J. R. Quantitative Imaging of Intrinsic Magnetic Tissue Properties Using MRI Signal Phase: An Approach to in Vivo Brain Iron Metabolism? NeuroImage 2011, 54 (4), 2789–2807. https://doi.org/10.1016/j.neuroimage.2010.10.070.
(8) Zhou, D.; Liu, T.; Spincemaille, P.; Wang, Y. Background Field Removal by Solving the Laplacian Boundary Value Problem. NMR Biomed. 2014, 27 (3), 312–319. https://doi.org/10.1002/nbm.3064.
(9) Sun, H.; Wilman, A. H. Background Field Removal Using Spherical Mean Value Filtering and Tikhonov Regularization. Magn. Reson. Med. 2014, 71 (3), 1151–1157. https://doi.org/10.1002/mrm.24765.
(10) Hongfu, S. QSM GitHub Repo; https://github.com/sunhongfu/QSM.
(11) Liu, T.; Khalidov, I.; de Rochefort, L.; Spincemaille, P.; Liu, J.; Tsiouris, A. J.; Wang, Y. A Novel Background Field Removal Method for MRI Using Projection onto Dipole Fields (PDF). NMR Biomed. 2011, 24 (9), 1129–1136. https://doi.org/10.1002/nbm.1670.
(12) MEDI Toolbox; http://pre.weill.cornell.edu/mri/pages/qsm.html.
(13) Liu, T.; Liu, J.; Rochefort, L. de; Spincemaille, P.; Khalidov, I.; Ledoux, J. R.; Wang, Y. Morphology Enabled Dipole Inversion (MEDI) from a Single-Angle Acquisition: Comparison with COSMOS in Human Brain Imaging. Magn. Reson. Med. 2011, 66 (3), 777–783. https://doi.org/10.1002/mrm.22816.
(14) Li, W.; Wu, B.; Liu, C. An Improved Method for Integrated 3D Phase Unwrapping and Background Phase Removal. Proc Intl Soc Mag Reson Med 2015, 3313.
(15) Wu, B.; Li, W.; Guidon, A.; Liu, C. Whole Brain Susceptibility Mapping Using Compressed Sensing. Magn. Reson. Med. 2012, 67 (1), 137–147. https://doi.org/10.1002/mrm.23000.
(16) STISuite; https://people.eecs.berkeley.edu/~chunlei.liu/software.html.
(17) Yushkevich, P. A.; Piven, J.; Hazlett, H. C.; Smith, R. G.; Ho, S.; Gee, J. C.; Gerig, G. User-Guided 3D Active Contour Segmentation of Anatomical Structures: Significantly Improved Efficiency and Reliability. NeuroImage 2006, 31(3), 1116–1128. https://doi.org/10.1016/j.neuroimage.2006.01.015.
(18) Cao, S.; Wei, H.; Chen, J.; Liu, C. Asymmetric Susceptibility Tensor Imaging. Magn. Reson. Med. 2021, 86 (4), 2266–2275. https://doi.org/10.1002/mrm.28823.
Figures