2362
Isotropic QSM in seconds using super-resolution 2D EPI imaging in 3 orthogonal planes1High Field Magnetic Resonance Centre, Department of Biomedical Imaging and Image-guided Therapy, Medical University Of Vienna, Vienna, Austria, 2Karl Landsteiner Institute for Clinical Molecular MR in Musculoskeletal Imaging, Vienna, Austria, 3Centre of Advanced Imaging, University of Queensland, Brisbane, Australia, 4University of Queensland, Centre for Innovation in Biomedical Imaging Technology, Brisbane, Australia, 5School of Information Technology and Electrical Engineering, University of Queensland, Brisbane, Australia, 6Department of Medical Engineering, Carinthia University of Applied Sciences, Klagenfurt, Austria, 7Department of Neurology, Medical University Of Vienna, Vienna, Austria, 8Department of Neurology, Medical University of Graz, Graz, Austria
Synopsis
We propose a method to generate a super-resolution QSM from three orthogonal 2D EPI acquisitions with anisotropic voxels. Using distortion correction and non-linear co-registration of the individual EPI images with thick slices, a super-resolution EPI image with isotropic voxels was generated and used to compute a QSM. The super-resolution 2D EPI susceptibility maps, as well as the susceptibility values within deep grey matter structures, showed close correspondence to a standard GRE QSM. The net acquisition time was, however, reduced from several minutes to several seconds, allowing QSM in problematic patient cohorts and clinical routine.
Introduction
Excellent contrast between grey matter, white matter and myelin in Quantitative Susceptibility Mapping (QSM) allows the identification of deep grey matter structures1 and the possibility to quantify brain iron2, making QSM a valuable tool for the assessment and monitoring of neurodegenerative diseases such as Alzheimer’s and Parkinson's disease3.Conventionally, a high-resolution 5-10 minute 3D GRE acquisition is used, which is problematic in clinical applications and often corrupted by motion. The use of EPI can speed up QSM significantly4,5, opening the door for clinical applications. The high-resolution isotropic data required for accurate susceptibility mapping6 can be acquired using 3D EPI7,8, but this sequence is not available on most clinical systems and scans still take 30s-2min, which is too long for some patients. 2D EPI is, on the other hand, a standard sequence that takes only 1-5s per volume, but at high slice-resolution suffers from poor slice profile, cross-talk and low SNR, requiring anisotropic acquisitions for best results.
Super-resolution (SR) imaging9,10 offers a means to generate a high-resolution high-SNR image from several low-resolution (LR) acquisitions, as demonstrated with 2D EPI for DTI11 and fMRI12, but not yet for QSM. Previous EPI-based SR methods have used several volumes shifted along the slice-selection direction which obviates the need to correct for EPI distortions, but acquiring the LR images with rotation increments allows the high-spatial frequencies in all dimensions to be captured, leading to superior results13,14.
We propose to use SR 2D EPI, with three orthogonal LR acquisitions, for QSM. This has the potential to drastically reduce acquisition time. As the distortion correction with field mapping does not generally remove distortions fully, we propose using an iterative nonlinear image registration15–17 to correct for residual discrepancies between the orthogonal EPI images.
Methods
One healthy volunteer was scanned using a 3T Siemens Prisma scanner and a 64-channel head-neck coil. To generate an isotropic, super-resolution EPI image for QSM, three low-resolution orthogonal 2D EPI scans were acquired; sagittal and transversal with posterior-anterior phase-encoding (PE) direction and coronal with head-foot PE direction, all with TE/TR=28ms/2.8s, in-plane resolution=1.2x1.2mm, slice-thickness=3.0mm, 20% slice-gap, matrix=192x192x192, rBW/pixel=1445Hz, FA=80°, multi-band factor of 2, parallel imaging acceleration of R=2 and PF=6/8. For comparison, one isotropic sagittal 2D EPI scan with slice-thickness=1.0mm, TR=10.5s and other parameters as the low-resolution EPIs was acquired. Additionally, a 2D GRE image was acquired with TE={4,8,12,16,18,20,24,28,32,36,40}ms, TR=43ms, resolution=1.2x1.2x1.2mm, matrix=192x192x128, rBW/pixel=350Hz, FA=88°, posterior-anterior phase-encoding, R=3 and PF=6/8, resulting in TA=5min13s. Additionally, a low-resolution dual-echo GRE prescan was acquired for distortion correction of the EPIs.To reconstruct an SR image from the orthogonal, low-resolution 2D EPIs, the LR images were distortion-corrected using voxel-shift map approach18, resampled to isotropic using minctools19 and sinc interpolation and motion-corrected using FSL Flirt20. Finally, the images were co-registered using iterative non-linear registration with volgenmodel17 and averaged to a super-resolution image. The same processing was applied to phase, previously unwrapped using ROMEO21,22. The same processing was applied in a second analysis using linear co-registration to assess the need for non-linear co-registration.
To explore the effects of the SR processing without the potential confound of discrepancies between orthogonal acquisitions (distortions, slice profile, etc.), the acquired high-resolution GRE image was downsampled to three orthogonal images, and the same SR processing was performed.
Susceptibility maps were generated using background-field removal with SHARP23 and susceptibility calculation with STAR24 using the Sepia toolbox25. The resulting QSMs were compared by visual inspection and quantification within 14 ROIs.
Results
The reconstructed super-resolution images, both magnitude and QSMs, showed a greatly improved definition of structures compared to the low-resolution images, with clearly removed slice partial volume effects, and a generally close correspondence to the high-resolution reference images.The simulation on GRE data showed, as expected, that the SR reconstruction cannot fully recover the original data, resulting in residual blurring compared to the reference HR image (Figure 1). This was also observed in EPI, however, the SR EPI showed generally much higher SNR and structure delineation than the reference HR EPI (Figure 2).
Figure 3 demonstrates that the non-linear registration of the orthogonal LR EPI images with a prior distortion correction is required to generate a distortion-free SR image, without excessive blurring.
The reference high-resolution GRE and the super-resolution EPI susceptibility maps were in good agreement (Figures 4 and 5). Although some blurring was observed with SR, the differences between susceptibility estimates were not statistically significant in most of the ROIs.
Discussion and Conclusion
We propose super-resolution 2D EPI for ultra-fast QSM, opening up the possibility of performing isotropic QSM in under 10s. We show that a super-resolution, isotropic EPI image can be generated from three orthogonal 2D EPI scans with thick slices, but that this requires distortion correction and non-linear co-registration of the contributing images. Although the SR reconstruction introduced some blurring, the SR EPI-based susceptibility maps and the susceptibility values within deep grey matter structures showed close correspondence to a standard GRE QSM and the net acquisition time was reduced from several minutes to several seconds. The proposed three orthogonal images could replace the dummy scans used in fMRI acquisitions, allowing high-resolution QSM in no additional measurement time.Acknowledgements
This study was funded by the Austrian Science Fund (FWF 31452). SR was supported by the Marie Skłodowska-Curie Action (MS-fMRI-QSM 794298). The financial support by the Austrian Federal Ministry for Digital and Economic Affairs and the National Foundation for Research, Technology and Development is also gratefully acknowledged.References
1. Shmueli K, de Zwart JA, van Gelderen P, Li TQ, Dodd SJ, Duyn JH. Magnetic susceptibility mapping of brain tissue in vivo using MRI phase data. Magn Reson Med. 2009;62(6):1510-1522.
2. Langkammer C, Schweser F, Krebs N, et al. Quantitative susceptibility mapping (QSM) as a means to measure brain iron? A post mortem validation study. Neuroimage. 2012;62(3):1593-1599. doi:10.1016/j.neuroimage.2012.05.049
3. Ravanfar P, Loi SM, Syeda WT, et al. Systematic Review: Quantitative Susceptibility Mapping (QSM) of Brain Iron Profile in Neurodegenerative Diseases. Front Neurosci. 2021;15. doi:10.3389/fnins.2021.618435
4. Sun H, Wilman AH. Quantitative susceptibility mapping using single-shot echo-planar imaging: Echo-Planar Quantitative Susceptibility Mapping. Magn Reson Med. 2015;73(5):1932-1938. doi:10.1002/mrm.25316
5. Sun H, Seres P, Wilman AH. Structural and functional quantitative susceptibility mapping from standard fMRI studies: QSM from fMRI studies. NMR Biomed. 2017;30(4):e3619. doi:10.1002/nbm.3619
6. Karsa A, Punwani S, Shmueli K. The effect of low resolution and coverage on the accuracy of susceptibility mapping. Magn Reson Med. 2019;81(3):1833-1848. doi:10.1002/mrm.27542
7. Langkammer C, Bredies K, Poser BA, et al. Fast quantitative susceptibility mapping using 3D EPI and total generalized variation. Neuroimage. 2015;111:622-630. doi:10.1016/j.neuroimage.2015.02.041
8. Tourell M, Stewart A, Jin J, et al. Clinical viable QSM using accelerated, segmented 3D EPI with inline, automated QSM post-processing. In: Proceedings of the 28th Annual Meeting of ISMRM. Virtual Conference 2020. #3221
9. Fiat D. Method of enhancing an MRI signal. US patent US 6,294,914 B1. Published online September 25, 2001. Accessed December 27, 2017. http://www.google.com/patents/US6294914
10. Greenspan H, Oz G, Kiryati N, Peled S. MRI inter-slice reconstruction using super-resolution. Magn Reson Imaging. 2002;20(5):437-446.
11. Peled S, Yeshurun Y. Superresolution in MRI: Application to human white matter fiber tract visualization by diffusion tensor imaging. Magn Reson Med. 2001;45(1):29-35. doi:10.1002/1522-2594(200101)45:1<29::AID-MRM1005>3.0.CO;2-Z
12. Peeters RR, Kornprobst P, Nikolova M, et al. The use of super-resolution techniques to reduce slice thickness in functional MRI. Int J Imaging Syst Technol. 2004;14(3):131-138. doi:10.1002/ima.20016
13. Shilling RZ, Robbie TQ, Bailloeul T, Mewes K, Mersereau RM, Brummer ME. A super-resolution framework for 3-D high-resolution and high-contrast imaging using 2-D multislice MRI. IEEE Trans Med Imaging. 2009;28(5):633-644. doi:10.1109/TMI.2008.2007348
14. Plenge E, Poot DHJ, Bernsen M, et al. Super-resolution methods in MRI: Can they improve the trade-off between resolution, signal-to-noise ratio, and acquisition time? Magn Reson Med. 2012;68(6):1983-1993. doi:10.1002/mrm.24187
15. Grabner G, Dal-Bianco A, Hametner S, Lassmann H, Trattnig S. Group specific vein-atlasing: An application for analyzing the venous system under normal and multiple sclerosis conditions. J Magn Reson Imaging. Published online October 22, 2013. doi:10.1002/jmri.24393
16. Bollmann S, Bollmann S, Puckett A, Janke A, Barth M. Non-linear Realignment Using Minimum Deformation Averaging for Single-subject fMRI at Ultra-high Field. In: Proceedings of the 25th Annual Meeting of ISMRM. Hawaii, USA, 2017. #5338
17. https://github.com/CAIsr/volgenmodel-nipype.
18. Dymerska B, Poser BA, Barth M, Trattnig S, Robinson SD. A method for the dynamic correction of B0-related distortions in single-echo EPI at 7T. NeuroImage. 2016;doi:10.1016/j.neuroimage.2016.07.009. doi:10.1016/j.neuroimage.2016.07.009
19. https://github.com/BIC-MNI/minc-tools.
20. Jenkinson M, Bannister P, Brady M, Smith S. Improved optimization for the robust and accurate linear registration and motion correction of brain images. NeuroImage. 2002;17(2):825-841.
21. Dymerska B, Eckstein K, Bachrata B, et al. Phase unwrapping with a rapid opensource minimum spanning tree algorithm (ROMEO). Magn Reson Med. 2021;85(4):2294-2308. doi:https://doi.org/10.1002/mrm.28563
22. https://github.com/korbinian90/ROMEO.
23. Schweser F, Deistung A, Lehr BW, Reichenbach JR. Quantitative imaging of intrinsic magnetic tissue properties using MRI signal phase: an approach to in vivo brain iron metabolism? Neuroimage. 2011;54(4):2789-2807. doi:10.1016/j.neuroimage.2010.10.070
24. Li W, Wang N, Yu F, et al. A method for estimating and removing streaking artifacts in quantitative susceptibility mapping. NeuroImage. 2015;108:111-122. doi:10.1016/j.neuroimage.2014.12.043
25. Chan K-S, Marques JP. SEPIA-Susceptibility mapping pipeline tool for phase images. NeuroImage. 2020;227:117611. doi:10.1016/j.neuroimage.2020.117611
Figures
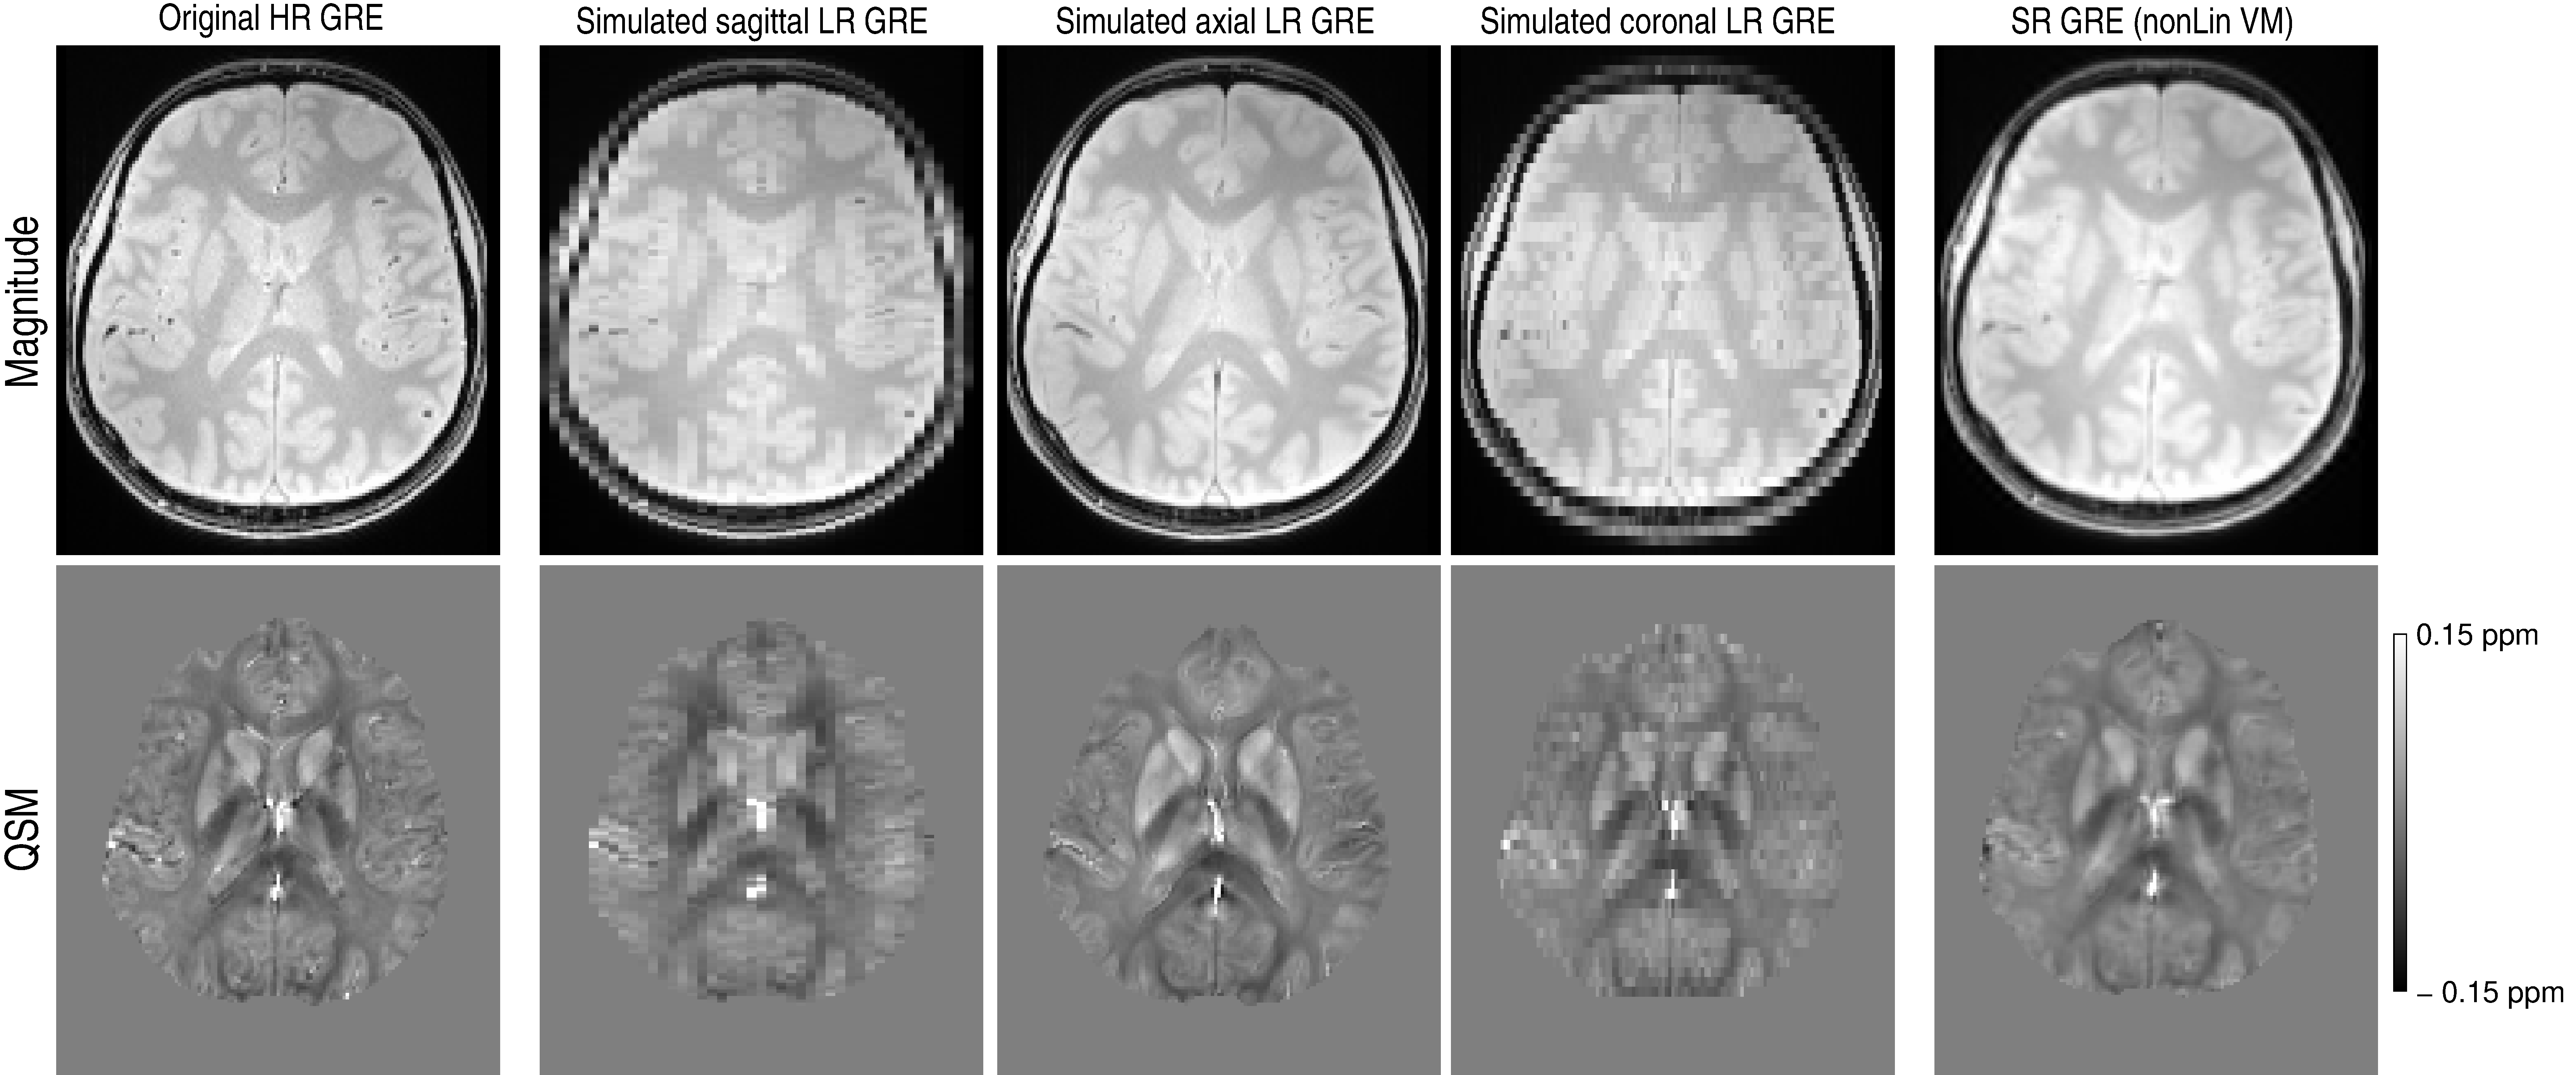
Figure 1: Comparison of magnitude images (upper row) and susceptibility maps (lower row) between the original acquired high-resolution (HR) GRE (column 1), the individual, simulated LR images (columns 2-4), and the reconstructed super-resolution (SR) GRE (column 5) using non-linear co-registration with volgenmodel. Note the improvement in structure delineation in the SR images compared to the LR images, but also some residual blurring compared to the original HR images.
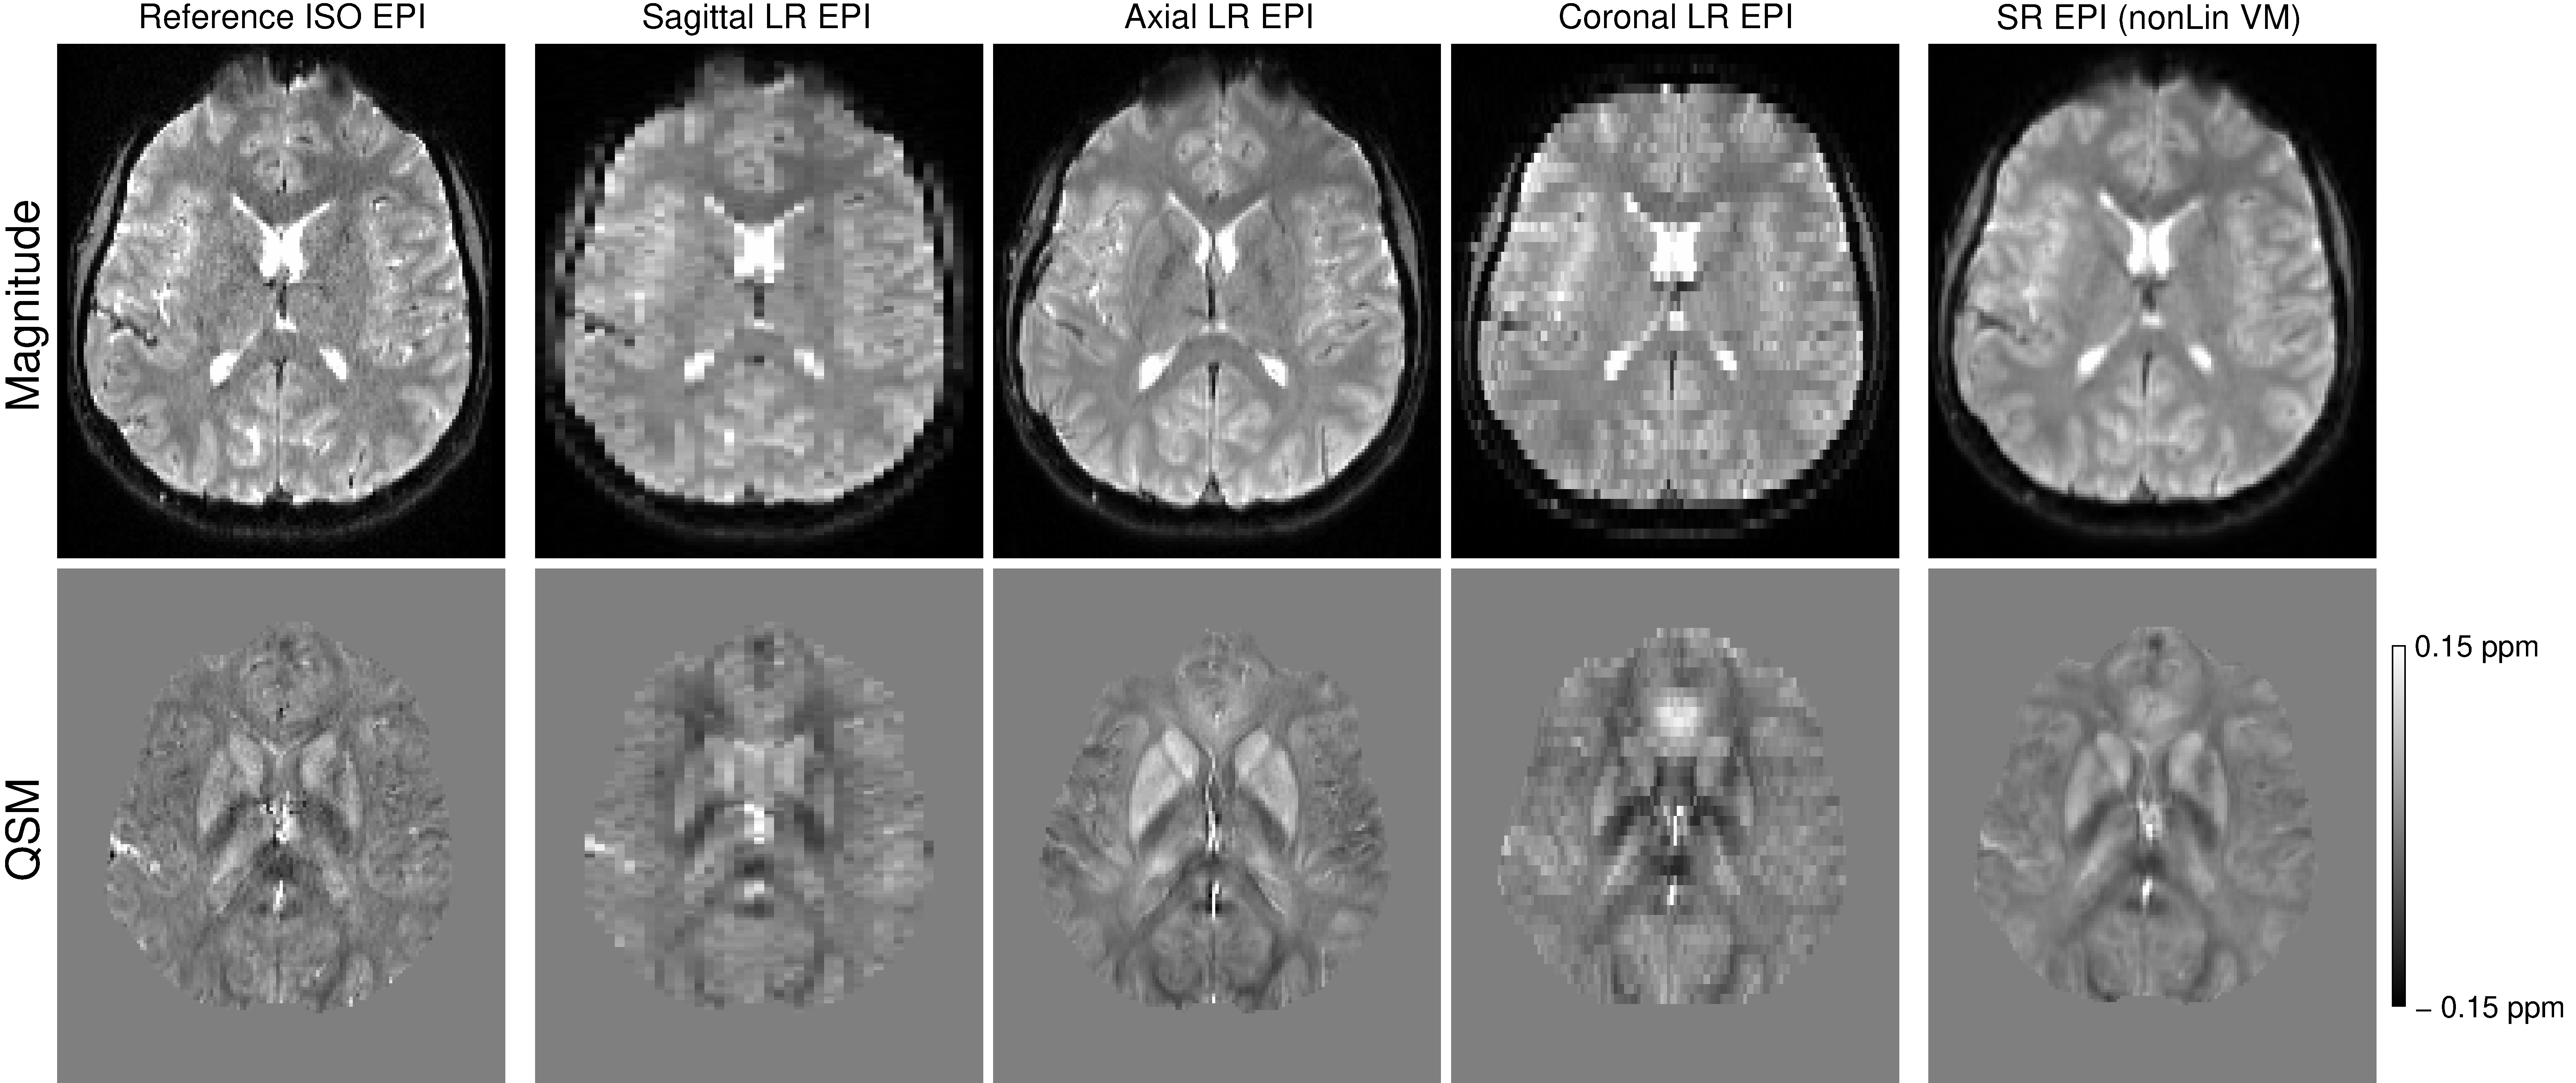
Figure 2: Comparison of magnitude images (upper row) and susceptibility maps (lower row) between the reference acquired high-resolution (HR) EPI (column 1), the individual orthogonal LR images (columns 2-4) and the reconstructed super-resolution (SR) EPI (column 5) using non-linear co-registration with volgenmodel. Note the improvement in structure delineation in the SR images compared to the LR images, the increased SNR of the SR compared to the reference HR image, but also some residual blurring.
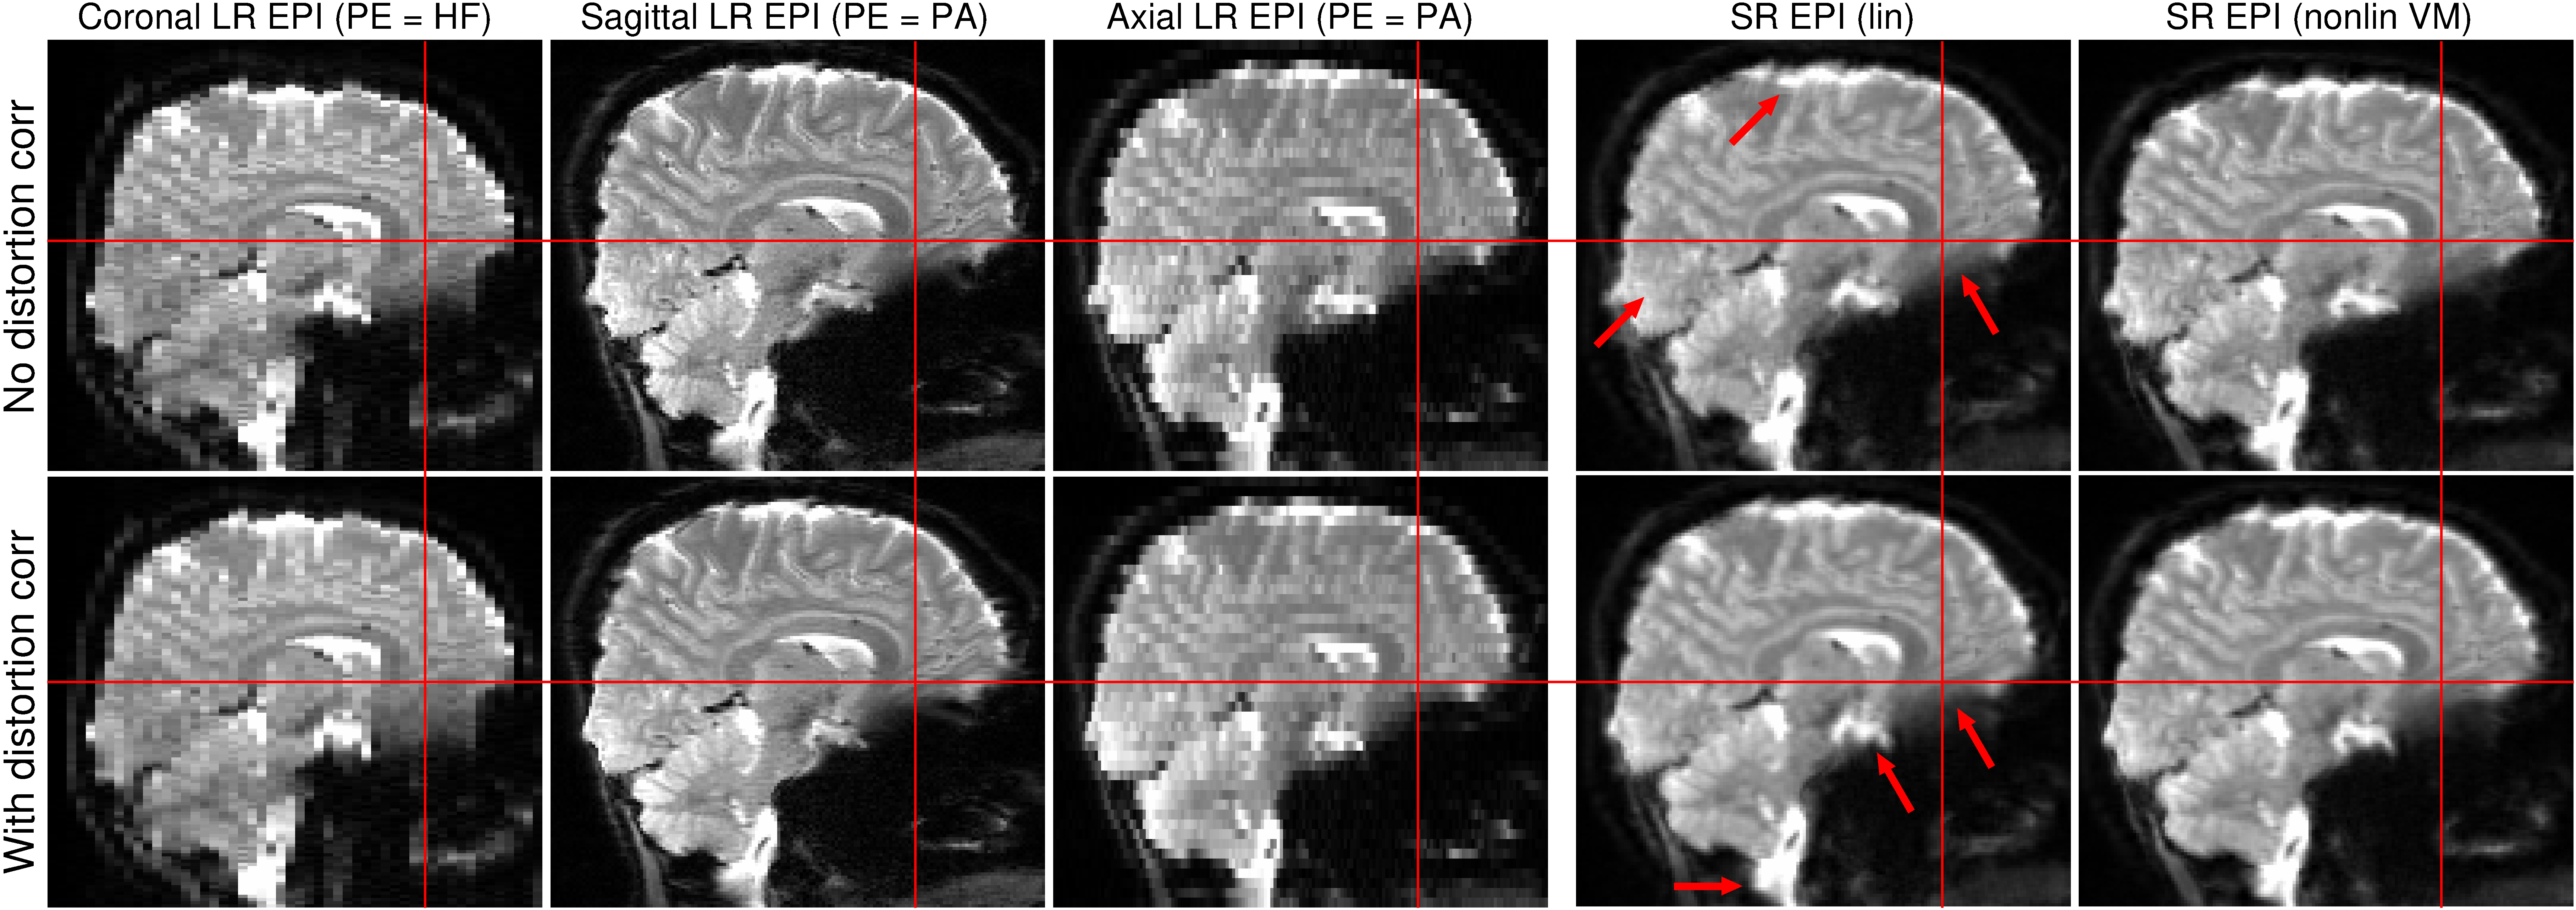
Figure 3: Comparison of super-resolution (SR) EPI images reconstructed using only linear (column 4) or non-linear co-registration with volgenmodel (column 5) without (upper row) and with (lower row) distortion correction (DC). Using a linear approach and no DC results in a significant blurring (red arrows) in the areas of large distortions (see positions w.r.t. reference lines), e.g. frontal areas and brainstem, which is reduced with DC. With non-linear registration, the excessive blurring is eliminated even without DC, but DC allows the generation of a distortion-free SR image.
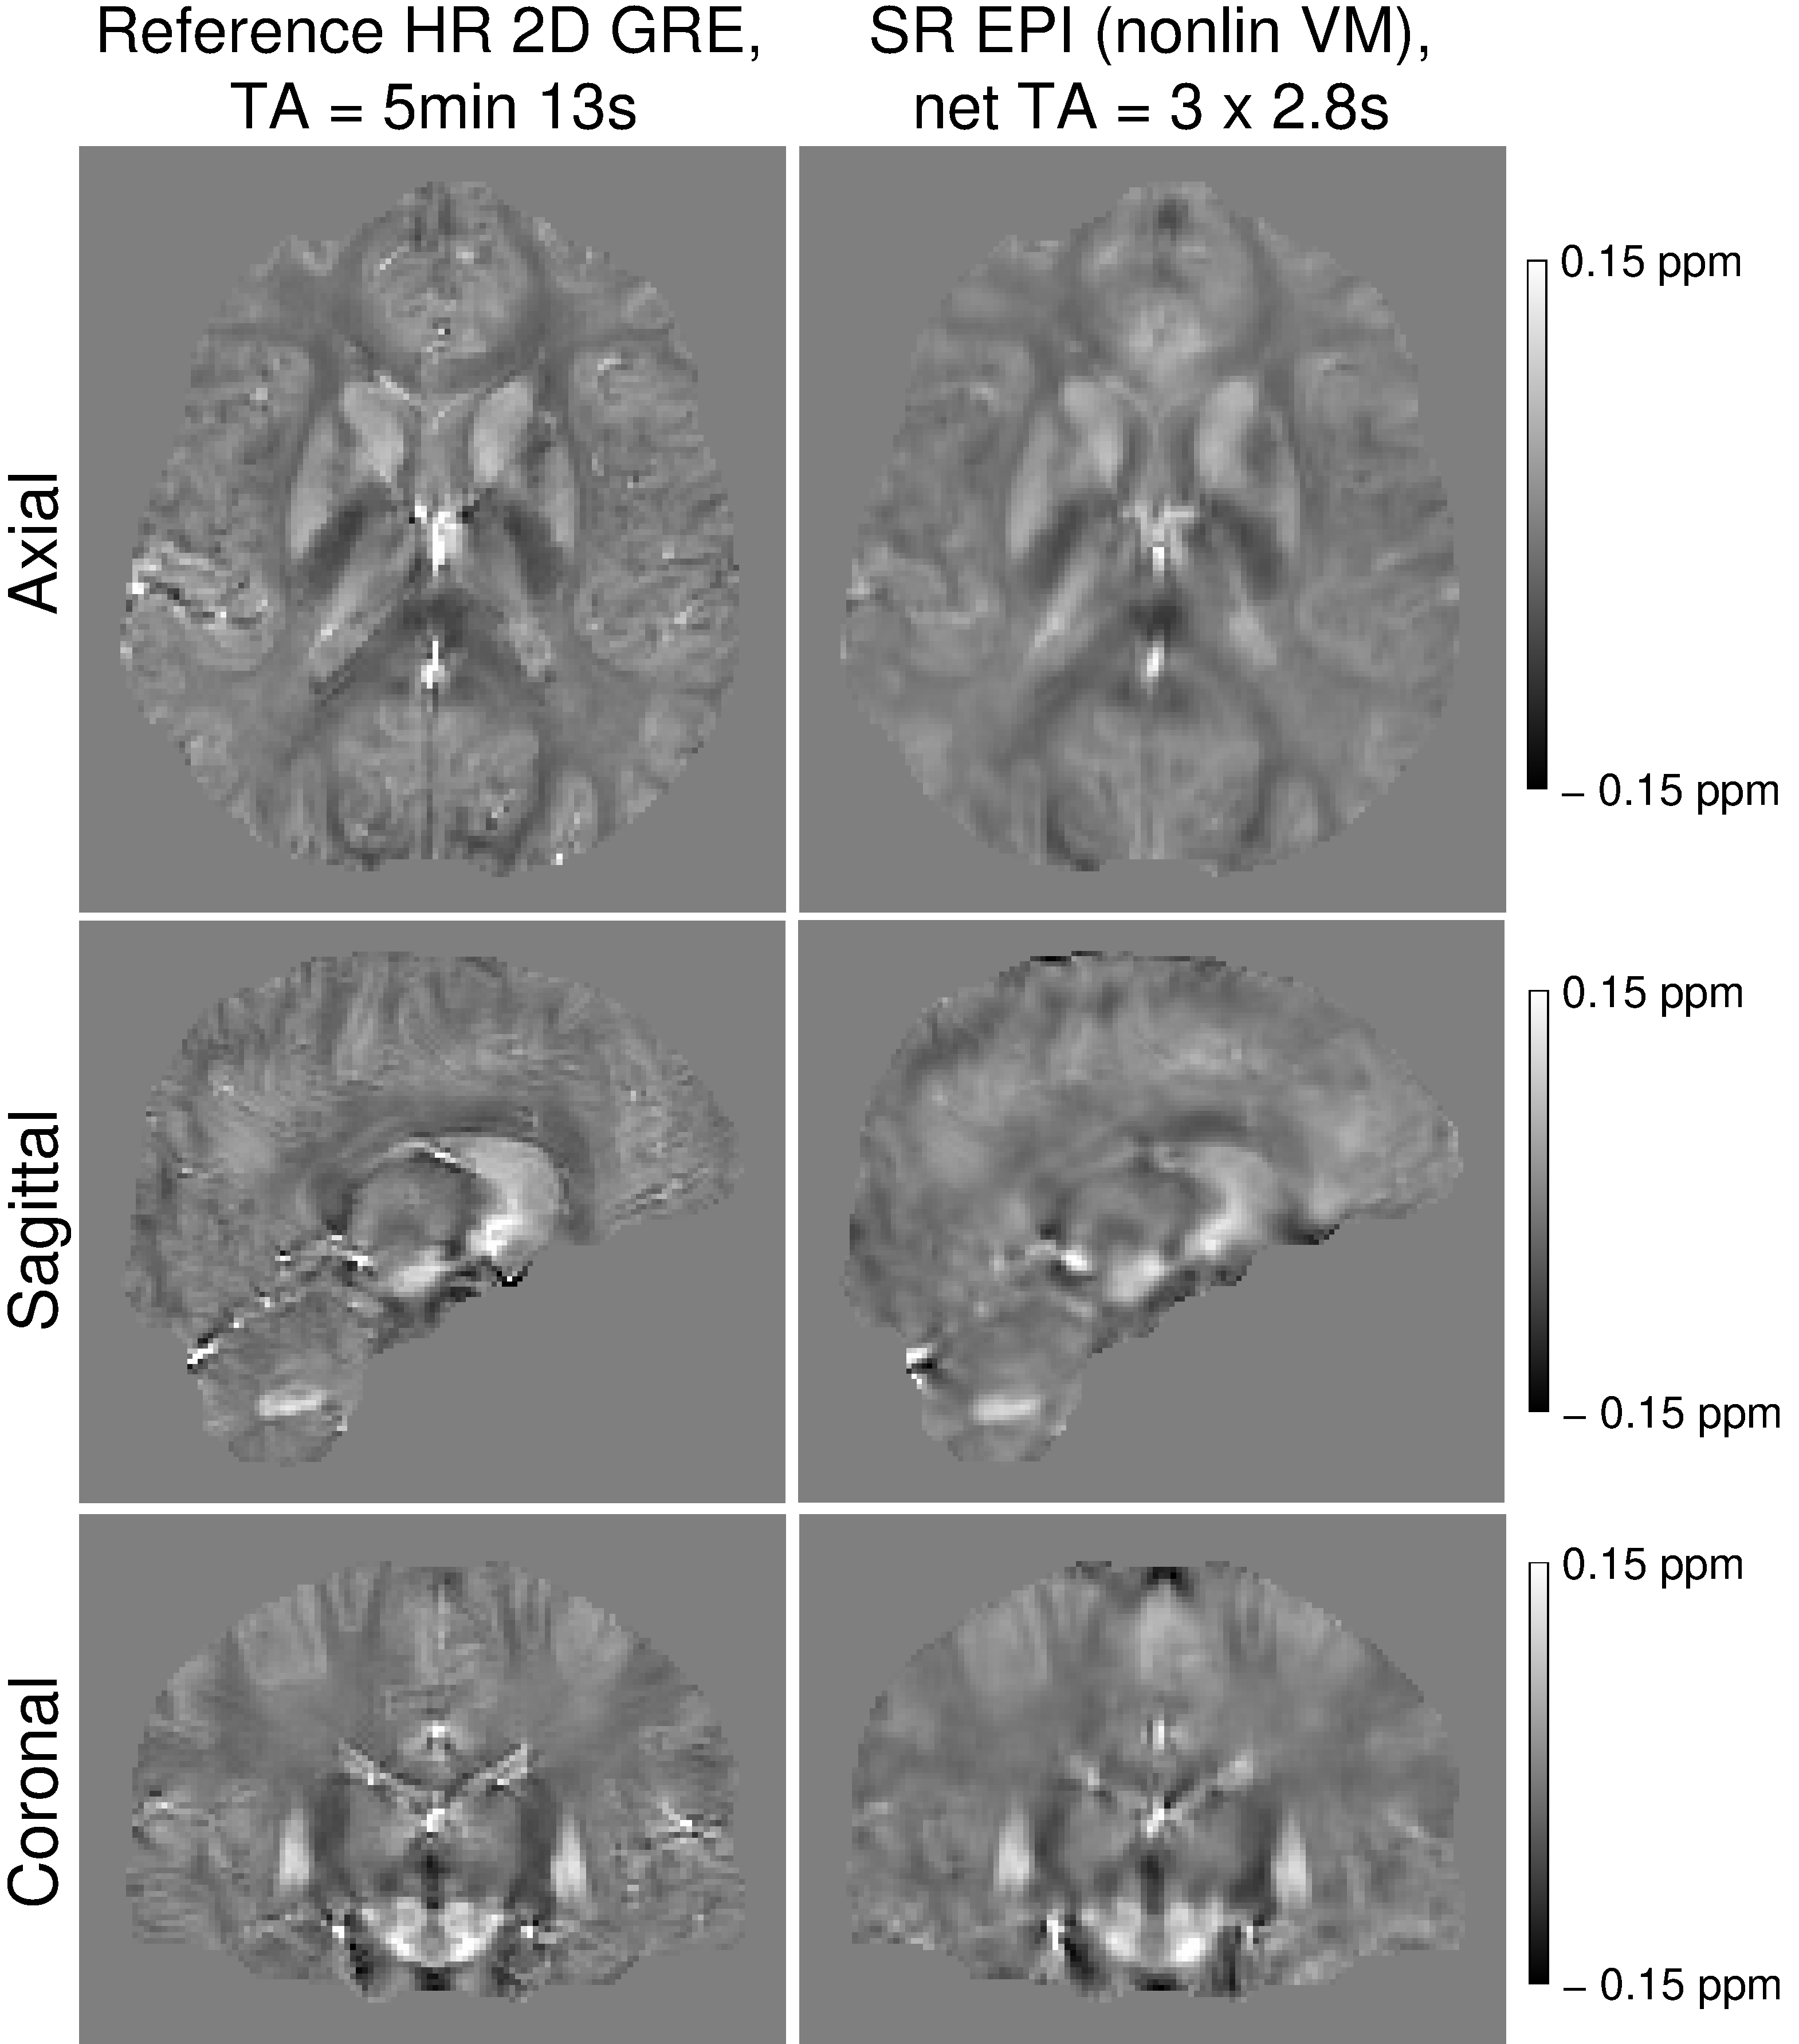
Figure 4: Comparison of susceptibility maps between the reference high-resolution (HR) GRE and the reconstructed super-resolution (SR) EPI using non-linear co-registration with volgenmodel. Note the similarity between the QSMs, but also some residual blurring in the SR EPI susceptibility map.
Figure 5: Comparison of susceptibility values between the reference high-resolution GRE and the reconstructed super-resolution EPI using non-linear co-registration with volgenmodel. The boxplots show the susceptibility values over 14 ROIs localized in deep grey matter structures, and the * marks the statistically significant differences (using Wilcoxon rank-sum test at p = 0.05, corrected for multiple comparisons using Bonferroni correction).