2361
Simultaneous Multi-Slice Acceleration of Multi-Echo EPI Provides Rapid and Accurate Quantitative Susceptibility Mapping
Oliver C. Kiersnowski1, Patrick Fuchs1, Stephen J. Wastling2,3, John S. Thornton2,3, and Karin Shmueli1
1Department of Medical Physics & Biomedical Engineering, University College London, London, United Kingdom, 2UCL Queen Square Institute of Neurology, University College London, London, United Kingdom, 3Lysholm Department of Neuroradiology, National Hospital for Neurology and Neurosurgery, London, United Kingdom
1Department of Medical Physics & Biomedical Engineering, University College London, London, United Kingdom, 2UCL Queen Square Institute of Neurology, University College London, London, United Kingdom, 3Lysholm Department of Neuroradiology, National Hospital for Neurology and Neurosurgery, London, United Kingdom
Synopsis
Simultaneous multi-slice (SMS) acquisition is increasingly used to accelerate echo planar imaging (EPI). EPI acquisitions have been used for quantitative susceptibility mapping (QSM) but, to utilise SMS, an investigation into the effect of SMS on EPI-QSM accuracy is necessary. Here, we show that SMS has no significant effect on magnetic susceptibility maps and values, and can, therefore, provide accurate QSM within a short TR. We also show, for the first time, that multi-echo phase images can be acquired using an EPI sequence (highly) accelerated using SMS and parallel imaging, leading to more accurate QSM reconstruction compared to standard single-echo EPI.
Introduction
Echo-planar imaging (EPI) has been used to acquire data for quantitative susceptibility mapping (QSM)1–3 in good agreement with conventional 3D GRE sequences4. Simultaneous multi-slice (SMS)5–7 acquisition is increasingly used for acceleration in EPI applications such as functional MRI (fMRI)8,9 but not for QSM, although SMS has been used for QSM in 2D GRE sequences10. The effect of SMS on EPI-QSM accuracy has not been investigated. Furthermore, although multi-echo GRE acquisition has been shown to be more accurate than single-echo for QSM11 and fMRI12,13 no studies have been published using multi-echo EPI for QSM.Therefore, we compared the effect of SMS with different multiband (MB) acceleration factors on the accuracy of QSM acquired using multi-echo EPI.
Methods
Acquisition:EPI brain images of a healthy volunteer were acquired on a 3T Siemens Prisma MR System using a 64-channel head coil and a multi-band EPI sequence14 at 2mm isotropic resolution with five echoes; matrix size = 120×120×96; 6/8 partial Fourier; BW=1984 Hz/Px; FA=90°; fat saturation; transverse orientation; interleaved slice acquisition and SENSE coil combination15. We compared MB factors of 1 (no acceleration), 2, 3 and 4 with GRAPPA (R) factors 2 and 4 in the first PE direction, and acquired five volumes per sequence. TEs and sequence-specific parameters are shown in Figure 1. To reduce slice-leakage artefacts, LeakBlock kernel optimisation was used16. Unaliasing of slices was carried out with blipped-CAIPI17.
A T1-weighted structural image for ROI segmentation was acquired using a whole-brain MPRAGE sequence with 1mm isotropic resolution; TR/TE=2000/2.05 ms; matrix size = 256×240×256; R=2; FA=8°.
QSM Pipeline:
For each volume, total field maps and noise maps were obtained from a weighted non-linear fit18,19 of the complex data over echoes. The number of echoes (3-5) for the multi-echo fit was optimised by comparing susceptibility maps for each number. To compare multi-echo v. single-echo EPI-QSM, the following pipeline was also applied to scaled single-echo phase images. Brain masks were calculated using BET19,20 on the magnitude images (first echo for multi-echo), and eroded by three voxels (only for the first echo for single-echo). The masks were multiplied with a (mean-thresholded) inverse noise map from the nonlinear fit to remove noisy voxels in the outer four layers. Residual phase wraps were removed using Laplacian unwrapping19,21, background fields in each slice were removed using 2D V-SHARP22,23 (kernel radius 20mm), and through-slice harmonic background fields were removed using projection onto dipole fields (PDF)19,24. Susceptibility ($$$\chi$$$) was calculated using iterative fitting with Tikhonov regularisation25 ($$$\alpha=0.006$$$).
Analysis:
All first-echo magnitude images were rigidly registered to the first-echo magnitude image of the reference volume (MB=1, R=2) using NiftyReg26. Susceptibility maps were then registered into the same space using the resulting transformation matrices. Eight regions of interest (ROIs) in the deep gray matter (Fig. 4) were obtained by segmenting the T1-weighted image using GIF27–29, and were then non-rigidly registered to the first-echo magnitude image of the reference volume. For each sequence and TE, temporal signal-to-noise ratio (tSNR) maps were calculated as the mean voxel values over the standard deviation of the magnitude images over the five volumes. ROI mean $$$\chi$$$ values were compared in multi-echo susceptibility maps (TE1 to 3, for R=2 and TE1 to 5, for R=4), averaged over the five volumes. Kruskal-Wallis tests were carried out to investigate statistically significant differences in (non-normally distributed) ROI mean values. The post-hoc Dunn’s test30 was used to identify whether $$$\chi$$$ values for specific MB factors differed significantly from the reference. Bland-Altman plots were used to investigate whether MB acceleration introduced any systematic $$$\chi$$$ bias.
Results
As observed previously, higher GRAPPA factors allow the acquisition of more echoes in a shorter time with an associated tSNR cost but MB factors do not reduce tSNR17 (Figure 2).The optimal number of echoes for multi-echo reconstruction was three for R=2 and five for R=4. Similar to 3D-GRE11, multi-echo QSM was found to be more accurate than single-echo QSM with 2D-EPI (Figure 3).
There were no consistent structural differences between susceptibility maps acquired with different MB factors (Figure 4). Overall, for different MB factors, ROI mean susceptibility values were not significantly different (Figures 5a, 5b) and no bias was observed between prescribed limits of agreement of 0.01 ppm11 (Figures 5c, 5d).
Discussion and Conclusion
Although it is well known that MB acceleration reduces TR in EPI without reducing the tSNR, we even observed increased tSNR near the brain edges (e.g., Figure 2, MB = 3), probably due to synergistic interaction between the RF coil arrangement and certain MB factors.As well as reducing distortion and drop-out, higher GRAPPA acceleration factors allow acquisition of more TEs within the same TR, which improved multi-echo QSM reconstruction, as shown by the increased $$$\chi$$$ values in the globus pallidus at R=4 v. R=2 (Figures 4 and 5 b v. a). MB acceleration did not introduce any systematic bias or significantly affect susceptibility estimates, therefore, EPI with SMS acceleration can be used to provide accurate QSM.
As for QSM with 3D-GRE11, we have shown that multi-echo QSM with EPI, with GRAPPA and SMS acceleration, is more accurate than single-echo QSM. EPI with SMS acceleration can be used to provide accurate QSM within a short TR.
Acknowledgements
Oliver Kiersnowski’s work was supported by the EPSRC-funded UCL Centre for Doctoral Training in Intelligent, Integrated Imaging in Healthcare (i4health) (EP/S021930/1). John Thornton received support from the National Institute for Health Research University College London Hospitals Biomedical Research Centre. Karin Shmueli and Patrick Fuchs were supported by European Research Council Consolidator Grant DiSCo MRI SFN 770939.References
- Deistung A, Schweser F, Reichenbach JR. Overview of quantitative susceptibility mapping. NMR Biomed. 2017;30(4). doi:10.1002/nbm.3569
- Wang Y, Liu T. Quantitative susceptibility mapping (QSM): Decoding MRI data for a tissue magnetic biomarker. Magn Reson Med. 2015;73(1):82-101. doi:10.1002/mrm.25358
- Shmueli K. Quantitative Susceptibility Mapping. In: Quantitative Magnetic Resonance Imaging. 1st ed. Elsevier; 2020.
- Sun H, Wilman AH. Quantitative susceptibility mapping using single-shot echo-planar imaging. Magn Reson Med. 2015;73(5):1932-1938. doi:10.1002/mrm.25316
- Larkman DJ, Hajnal J V., Herlihy AH, Coutts GA, Young IR, Ehnholm G. Use of multicoil arrays for separation of signal from multiple slices simultaneously excited. J Magn Reson Imaging. 2001;13(2):313-317. doi:10.1002/1522-2586(200102)13:2<313::aid-jmri1045>3.3.co;2-n
- Moeller S, Yacoub E, Olman CA, et al. Multiband multislice GE-EPI at 7 tesla, with 16-fold acceleration using partial parallel imaging with application to high spatial and temporal whole-brain FMRI. Magn Reson Med. 2010;63(5):1144-1153. doi:10.1002/mrm.22361
- Setsompop K, Feinberg DA, Polimeni JR. Rapid brain MRI acquisition techniques at ultra-high fields. NMR Biomed. 2016;29(9):1198-1221. doi:10.1002/nbm.3478
- Chen L, Vu AT, Xu J, et al. Evaluation of highly accelerated simultaneous multi-slice EPI for fMRI. Neuroimage. 2015;104:452-459. doi:10.1016/j.neuroimage.2014.10.027
- Jahanian H, Holdsworth S, Christen T, et al. Advantages of short repetition time resting-state functional MRI enabled by simultaneous multi-slice imaging. J Neurosci Methods. 2019;311(October 2018):122-132. doi:10.1016/j.jneumeth.2018.09.033
- Bian W, Kerr AB, Tranvinh E, et al. MR susceptibility contrast imaging using a 2D simultaneous multi-slice gradient-echo sequence at 7T. PLoS One. 2019;14(7):1-15. doi:10.1371/journal.pone.0219705
- Biondetti E, Karsa A, Thomas DL, Shmueli K. Investigating the accuracy and precision of TE-dependent versus multi-echo QSM using Laplacian-based methods at 3 T. Magn Reson Med. 2020;84(6):3040-3053. doi:10.1002/mrm.28331
- Puckett AM, Bollmann S, Poser BA, Palmer J, Barth M, Cunnington R. Using multi-echo simultaneous multi-slice (SMS) EPI to improve functional MRI of the subcortical nuclei of the basal ganglia at ultra-high field (7T). Neuroimage. 2018;172(May 2017):886-895. doi:10.1016/j.neuroimage.2017.12.005
- Kundu P, Voon V, Balchandani P, Lombardo M V., Poser BA, Bandettini PA. Multi-echo fMRI: A review of applications in fMRI denoising and analysis of BOLD signals. Neuroimage. 2017;154(March):59-80. doi:10.1016/j.neuroimage.2017.03.033
- Center for Magnetic Resonance Research Department of Radiology. Multi-Band Accelerated EPI Pulse Sequences. https://www.cmrr.umn.edu/multiband/.
- Sotiropoulos SN, Moeller S, Jbabdi S, et al. Effects of image reconstruction on fiber orientation mapping from multichannel diffusion MRI: Reducing the noise floor using SENSE. Magn Reson Med. 2013;70(6):1682-1689. doi:10.1002/mrm.24623
- Cauley SF, Polimeni JR, Bhat H, Wald LL, Setsompop K. Interslice leakage artifact reduction technique for simultaneous multislice acquisitions. Magn Reson Med. 2014;72(1):93-102. doi:10.1002/mrm.24898
- Setsompop K, Gagoski BA, Polimeni JR, Witzel T, Wedeen VJ, Wald LL. Blipped-controlled aliasing in parallel imaging for simultaneous multislice echo planar imaging with reduced g-factor penalty. Magn Reson Med. 2012;67(5):1210-1224. doi:10.1002/mrm.23097
- Liu T, Wisnieff C, Lou M, Chen W, Spincemaille P, Wang Y. Nonlinear formulation of the magnetic field to source relationship for robust quantitative susceptibility mapping. Magn Reson Med. 2013;69(2):467-476. doi:10.1002/mrm.24272
- MEDI Toolbox. http://pre.weill.cornell.edu/mri/pages/qsm.html.
- Smith SM. Fast robust automated brain extraction. Hum Brain Mapp. 2002;17(3):143-155. doi:10.1002/hbm.10062
- Schofield MA, Zhu Y. Fast phase unwrapping algorithm for interferometric applications. Opt Lett. 2003. doi:10.1364/ol.28.001194
- Wei H, Zhang Y, Gibbs E, Chen NK, Wang N, Liu C. Joint 2D and 3D phase processing for quantitative susceptibility mapping: application to 2D echo-planar imaging. NMR Biomed. 2017;30(4). doi:10.1002/nbm.3501
- Li W, Wu B, Liu C. Quantitative susceptibility mapping of human brain reflects spatial variation in tissue composition. Neuroimage. 2011;55:1645-1656. doi:10.1016/j.neuroimage.2010.11.088
- Liu T, Khalidov I, de Rochefort L, et al. A novel background field removal method for MRI using projection onto dipole fields (PDF). NMR Biomed. 2011;24(9):1129-1136. doi:10.1002/nbm.1670
- Karsa A, Punwani S, Shmueli K. An optimized and highly repeatable MRI acquisition and processing pipeline for quantitative susceptibility mapping in the head-and-neck region. Magn Reson Med. 2020;84(6):3206-3222. doi:10.1002/mrm.28377
- Modat M, Cash DM, Daga P, Winston GP, Duncan JS, Ourselin S. Global image registration using a symmetric block-matching approach. J Med Imaging. 2014;1(2):024003. doi:10.1117/1.jmi.1.2.024003
- Cardoso MJ, Modat M, Wolz R, et al. Geodesic Information Flows: Spatially-Variant Graphs and Their Application to Segmentation and Fusion. IEEE Trans Med Imaging. 2015;34(9):1976-1988. doi:10.1109/TMI.2015.2418298
- Prados F, Cardoso MJ, Burgos N, et al. NiftyWeb: web based platform for image processing on the cloud. 24th Sci Meet Exhib Int Soc Magn Reson Med. 2016;(May):1049.
- http://niftyweb.cs.ucl.ac.uk/.
- Cardillo G. Dunn’s Test: a procedure for multiple, not parametric, comparisons. http://www.mathworks.com/matlabcentral/fileexchange/12827. Published 2006. Accessed October 1, 2021.
Figures
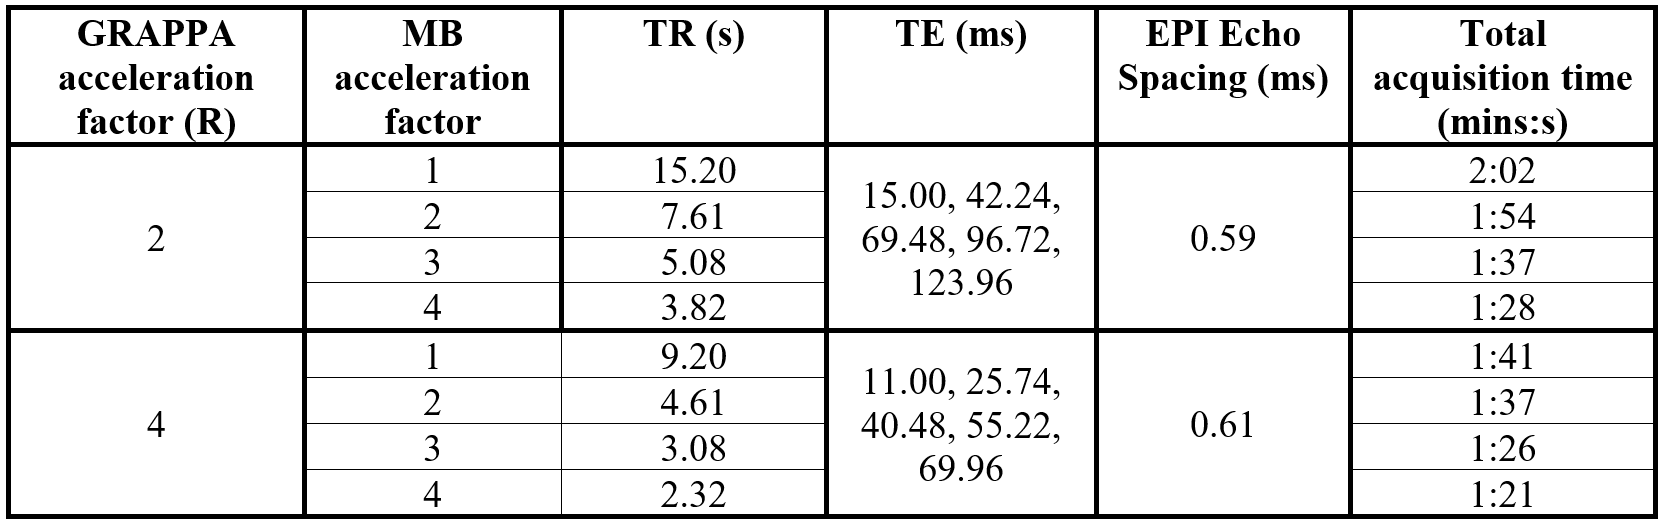
Figure 1: Acquisition
parameters for 2D-EPI with various multiband (MB) and GRAPPA acceleration
factors. GRAPPA acceleration was always along the PE direction (A>>P).
The (MB + GRAPPA) acceleration lowers the TR. The total acquisition time for
five volumes includes additional reference scans required for SMS acceleration.
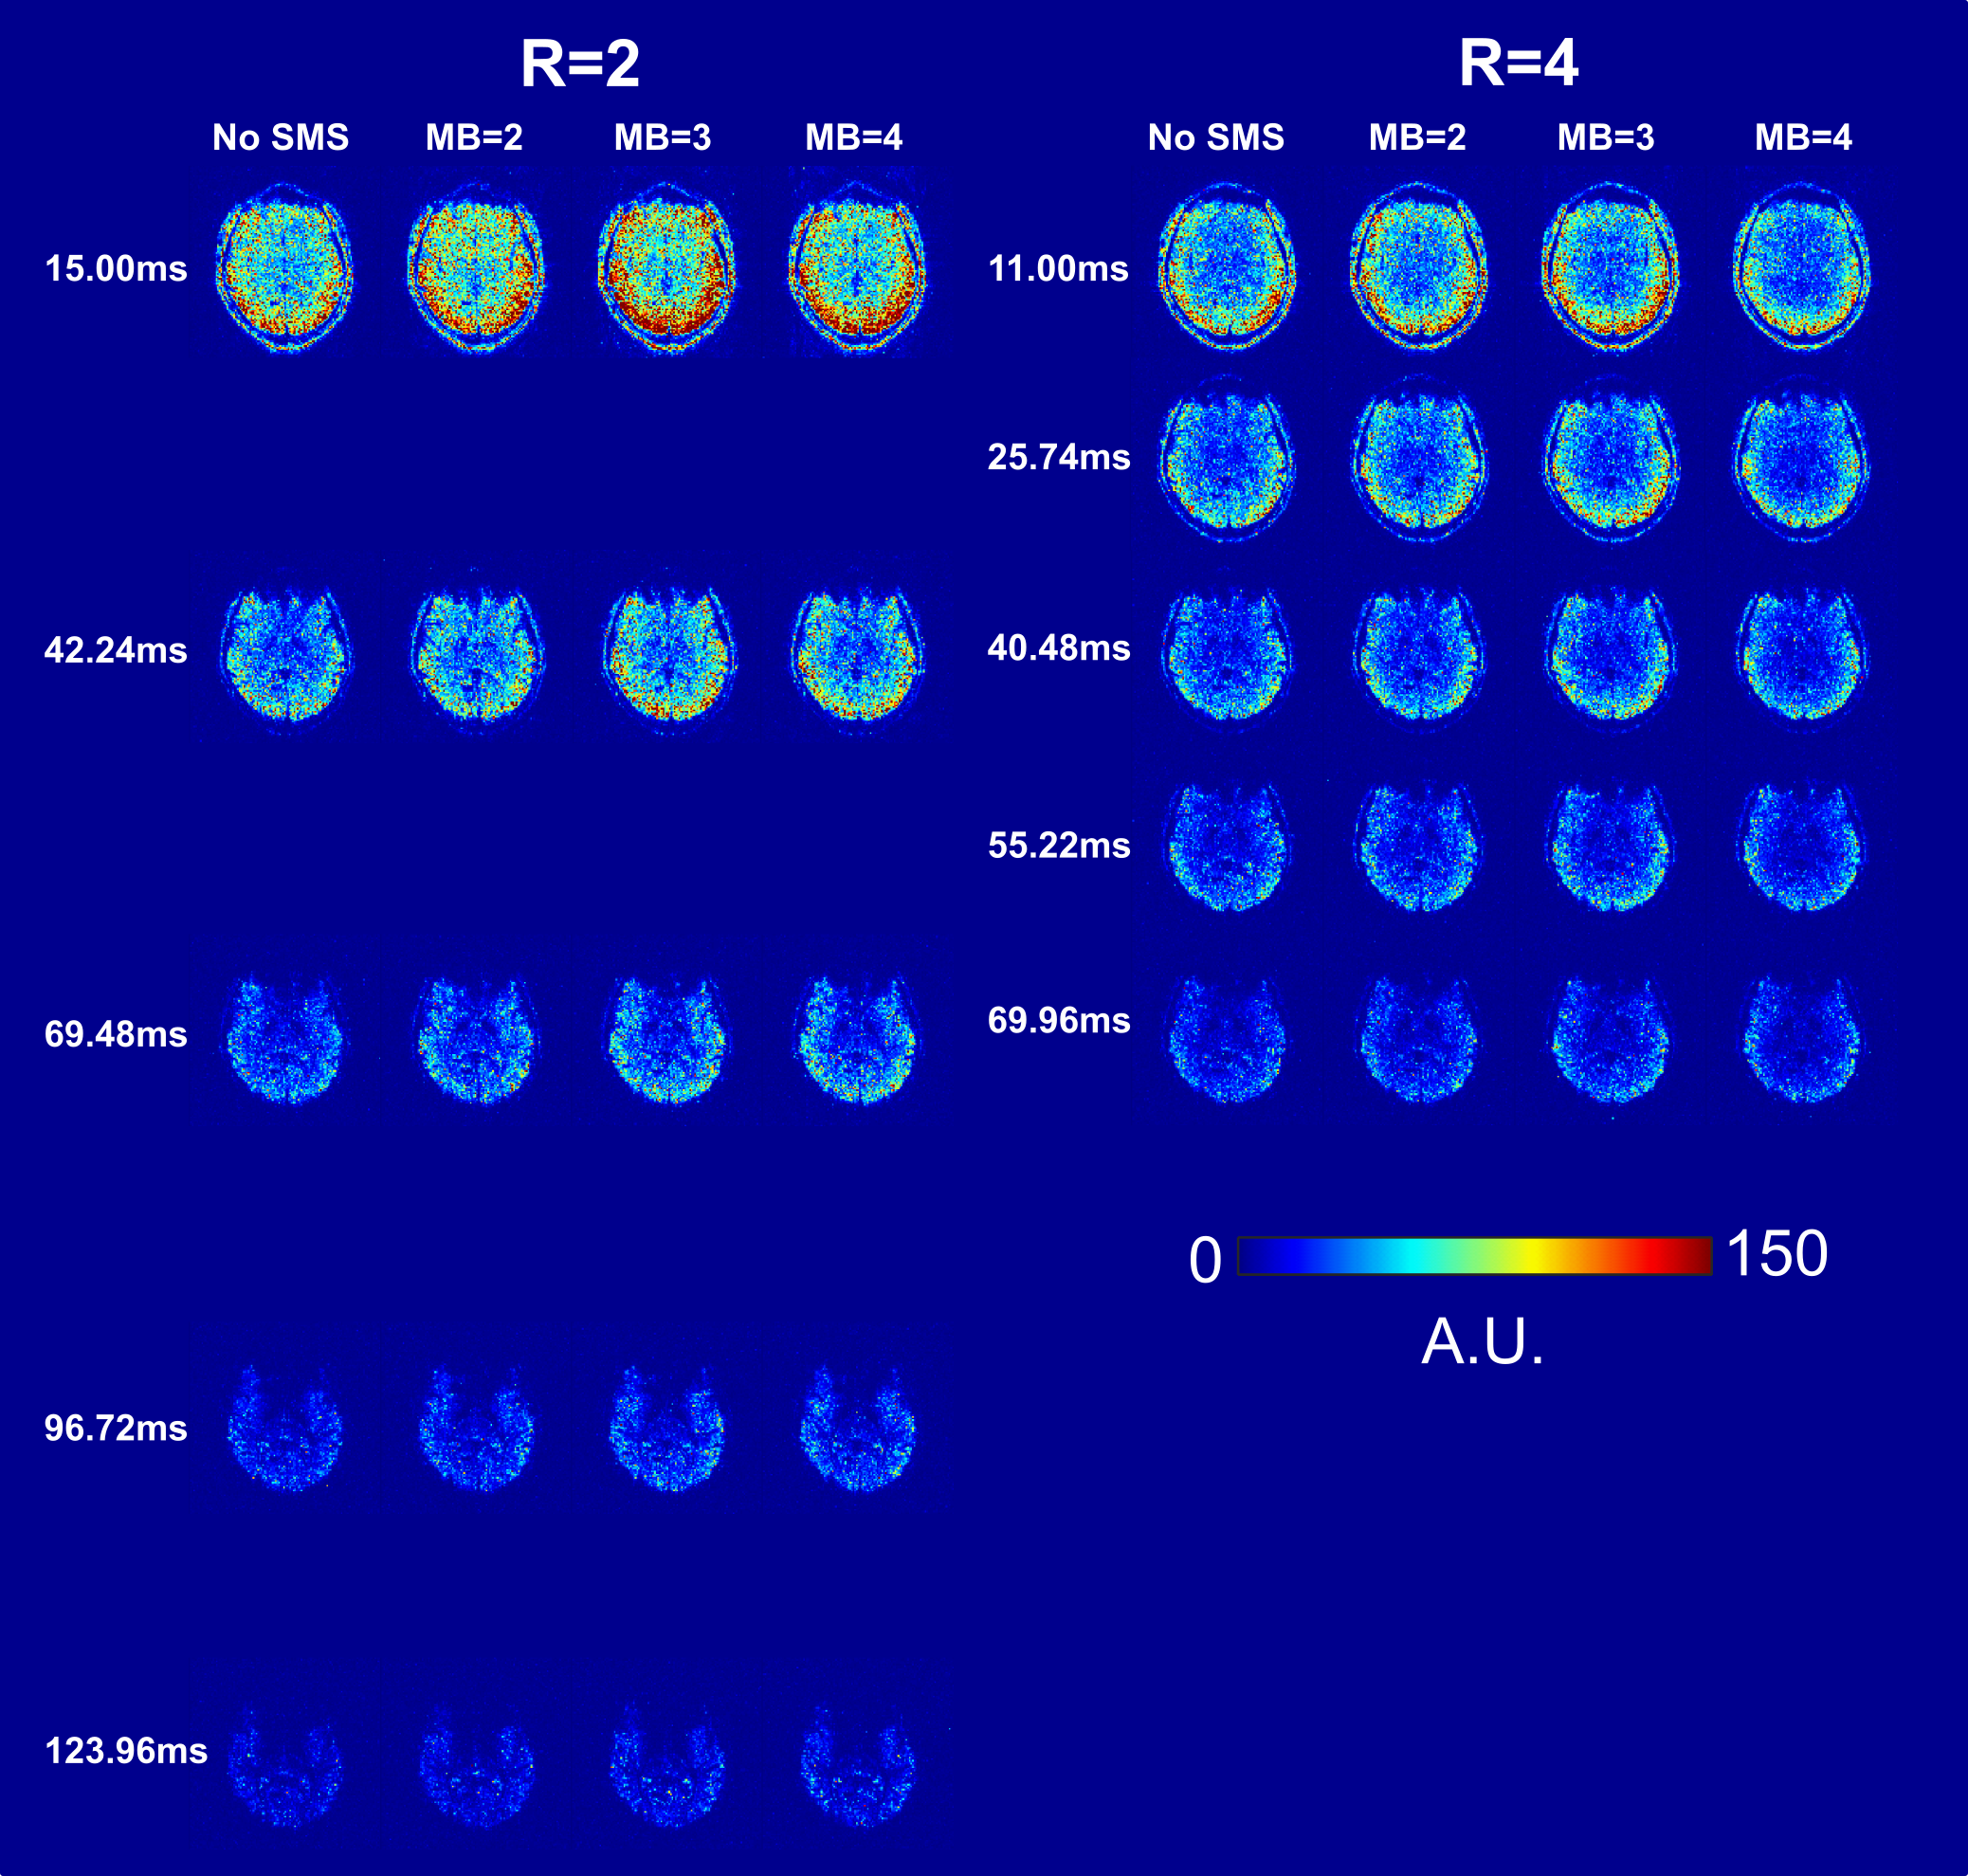
Figure 2:
Temporal SNR maps for R = 2 and 4, across all
multiband (MB) factors. As expected, R = 2 had higher tSNR than R= 4 at an
approximately equal echo time but R = 4 allowed more echoes to be acquired within
the same amount of time.
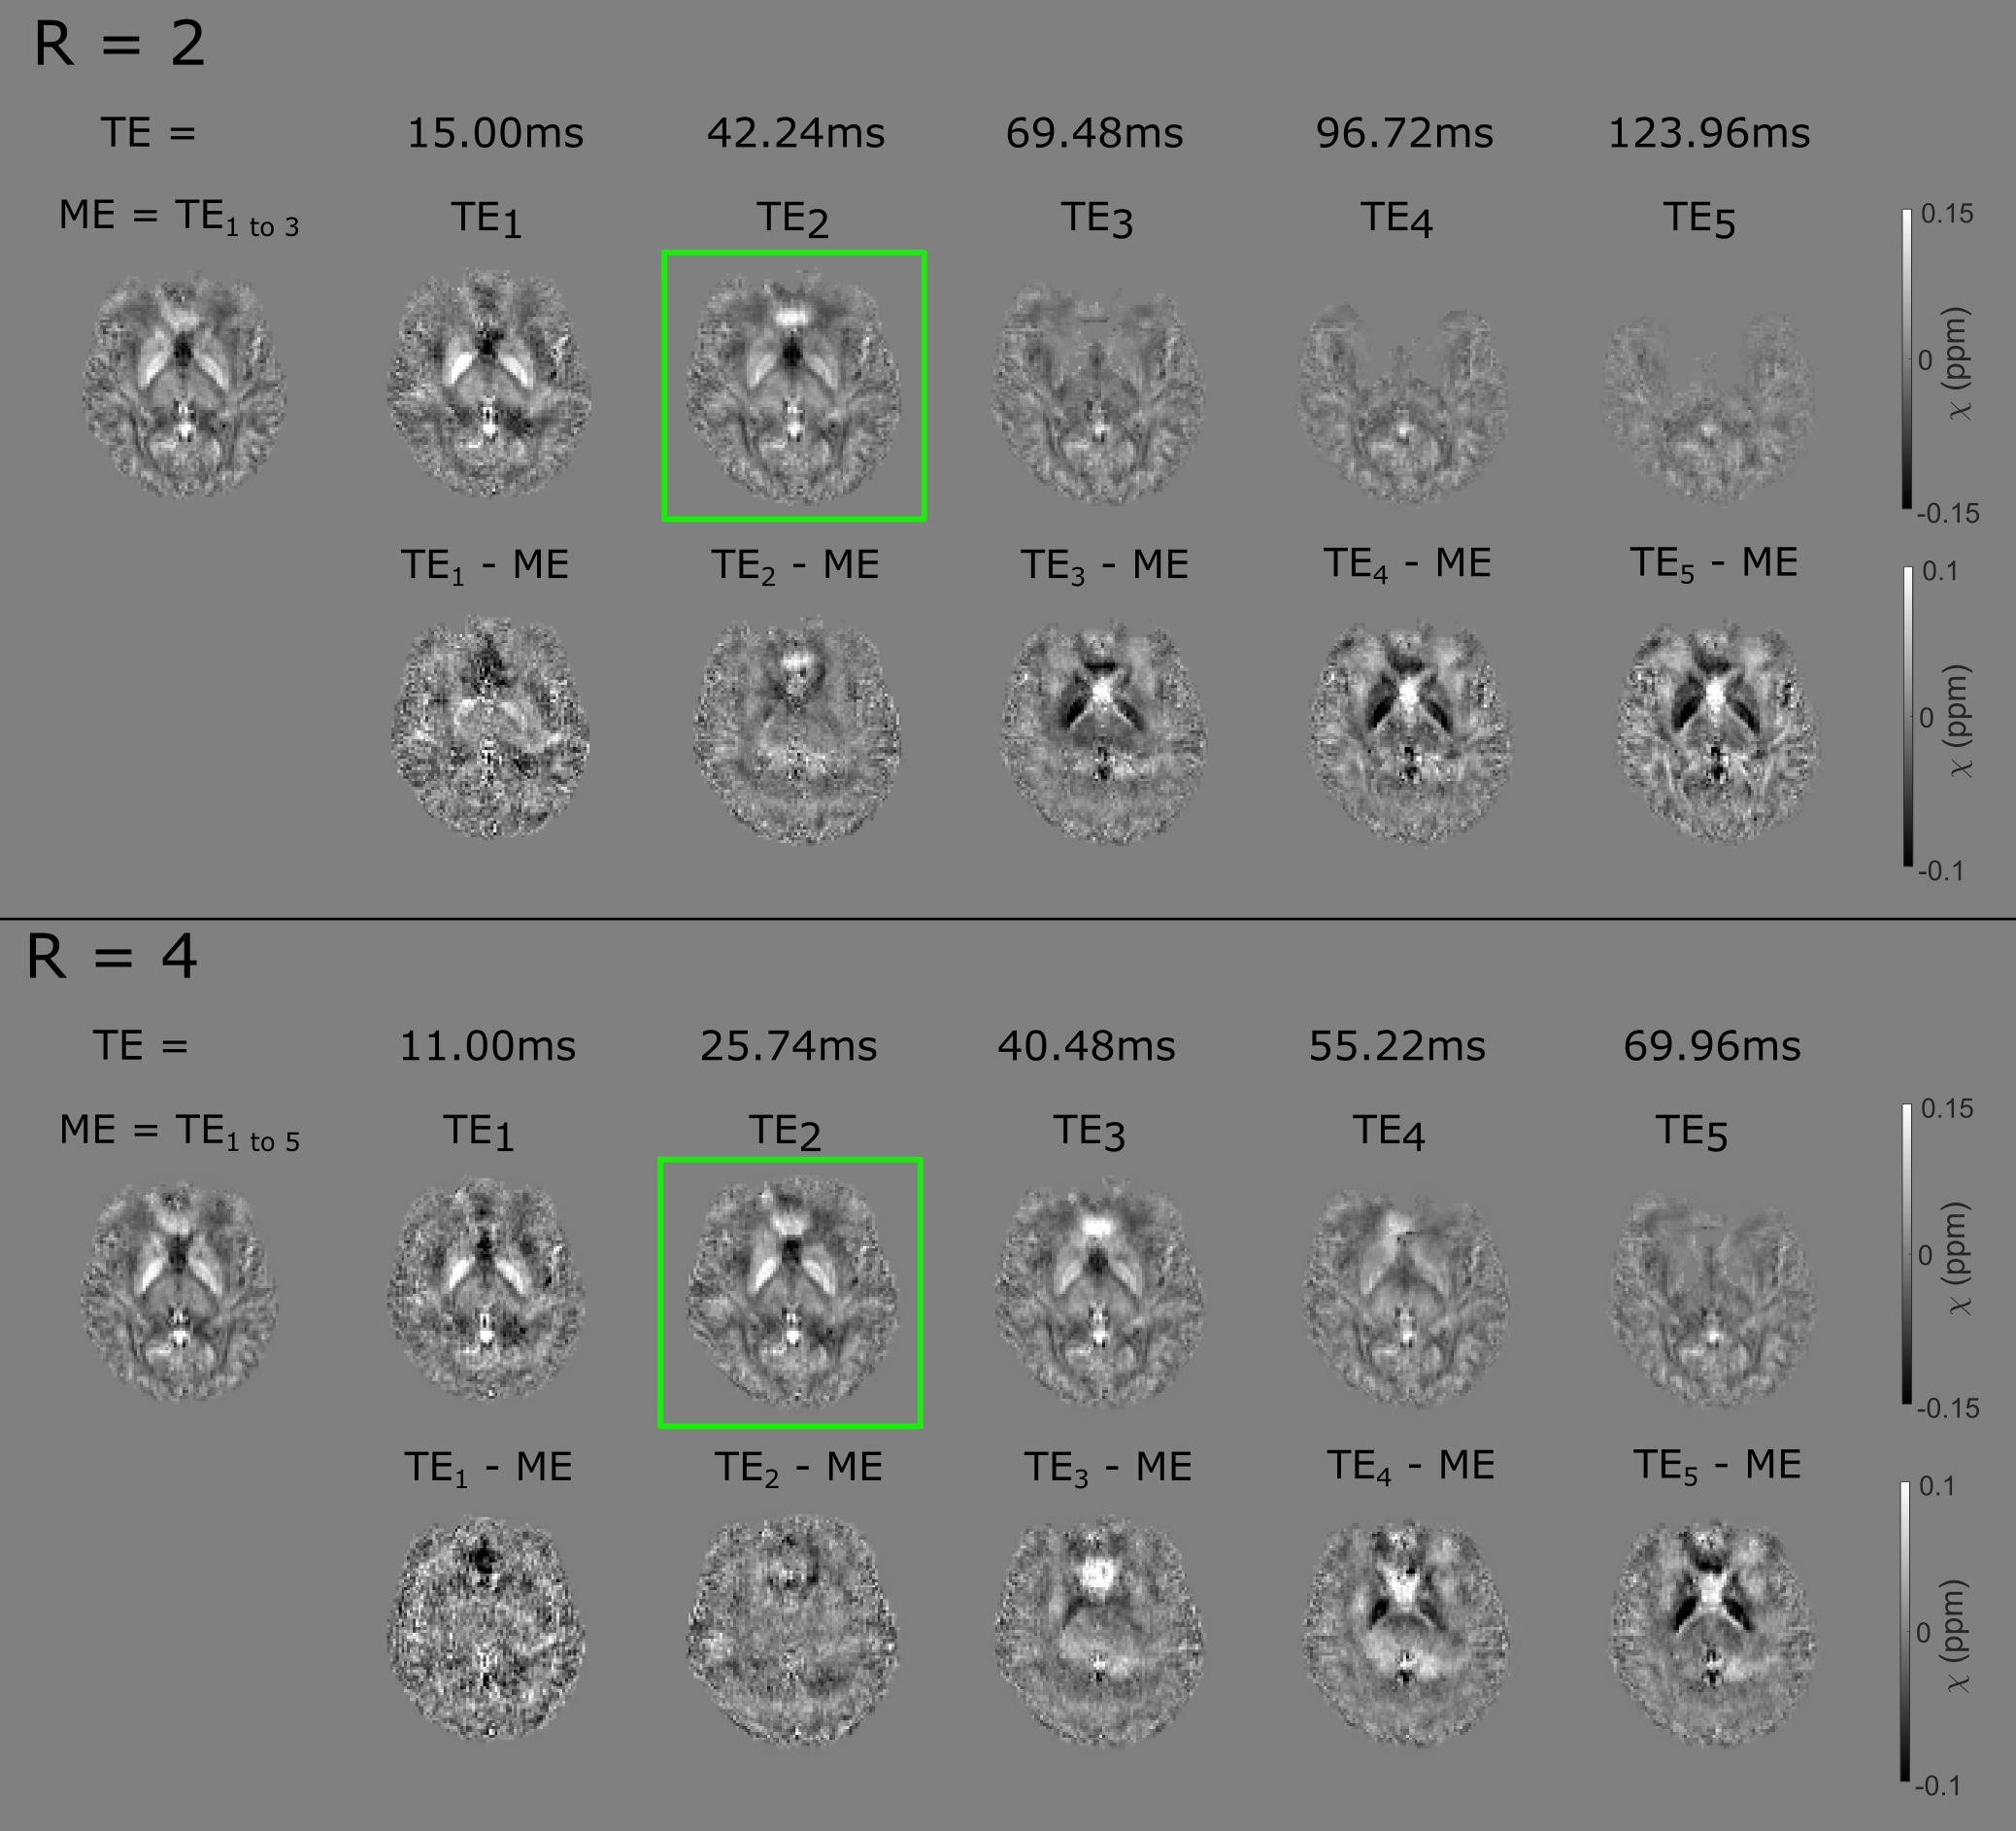
Figure 3: Optimal
multi-echo (ME) χ maps (left, top rows) followed by single-echo χ maps at each TE for both R=2 and 4 at MB=2. Corresponding
difference images (single-echo – optimal multi-echo) are shown (bottom row). Longer
TE single-echo χ maps failed due to severe distortion and
signal dropout. Multi-echo χ maps have fewer residual background field
artefacts and are less affected by geometric distortion. Green boxes indicate
optimal single-echo χ maps.
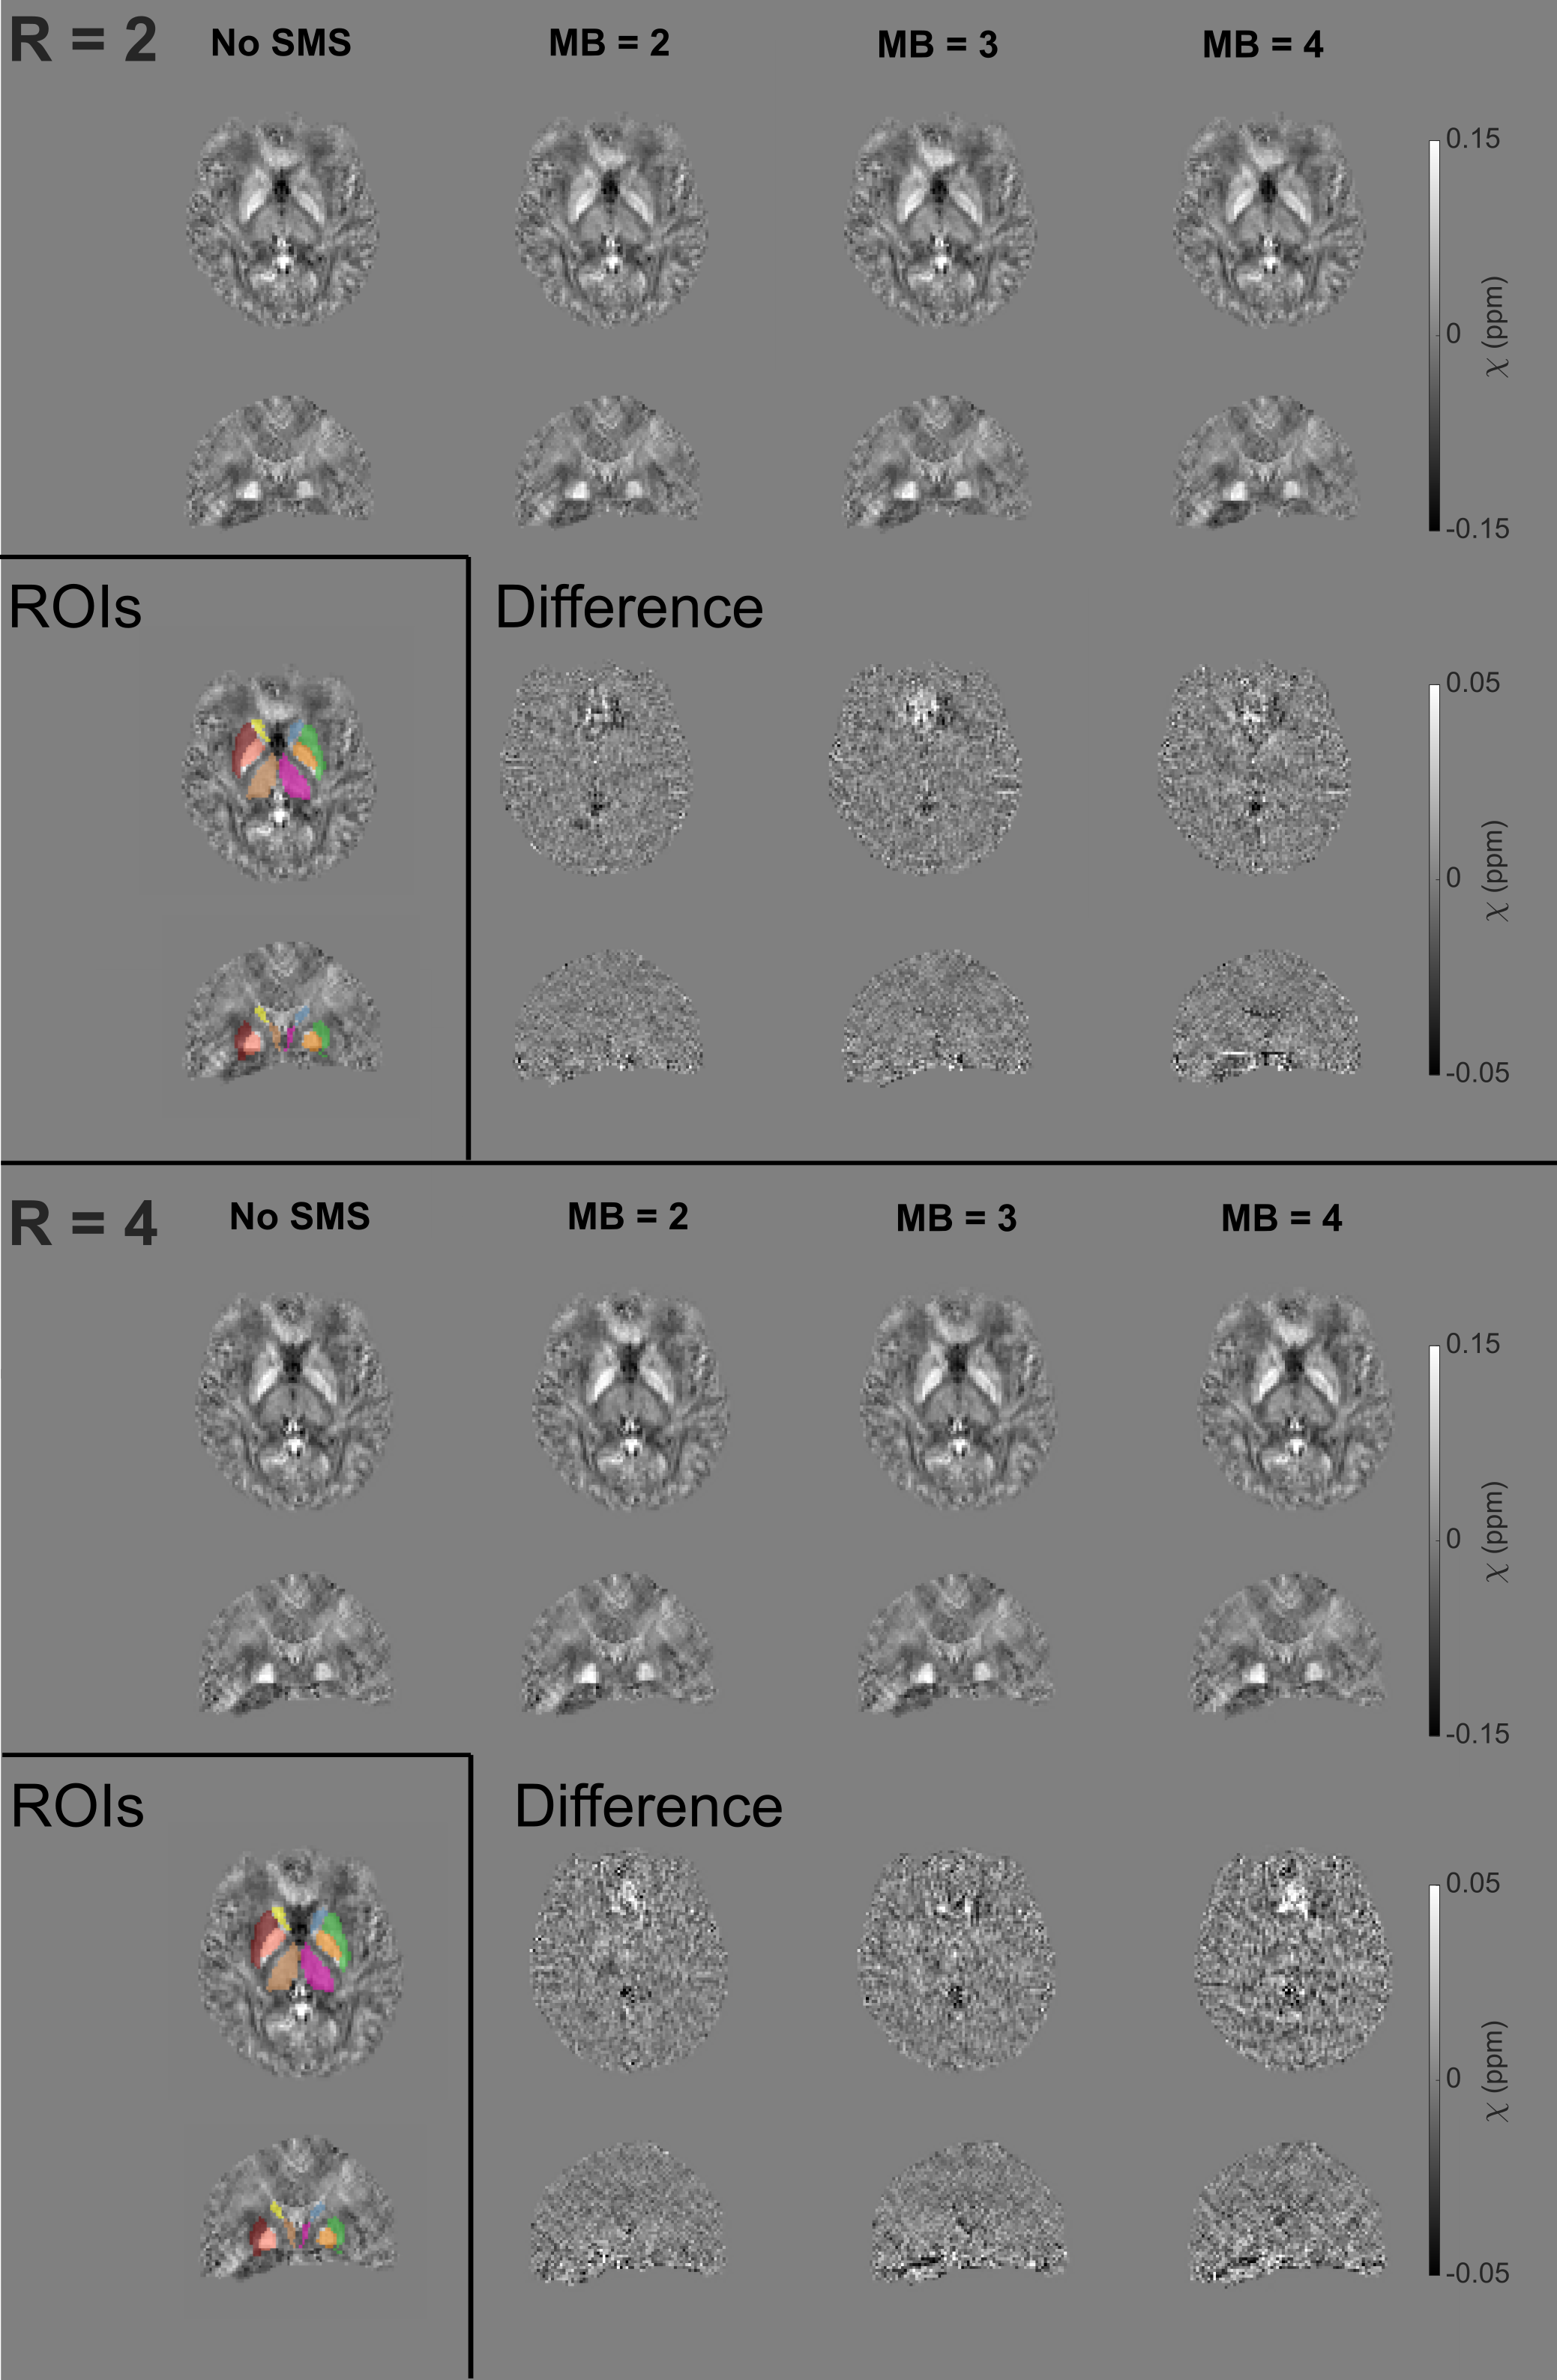
Figure 4: Susceptibility maps (top
rows) at different MB acceleration factors at R=2 (top) and R=4 (bottom). Difference images are shown relative to maps
with no SMS (bottom rows). Axial and coronal slices are shown. No consistent regional
susceptibility differences are apparent between different MB factors.
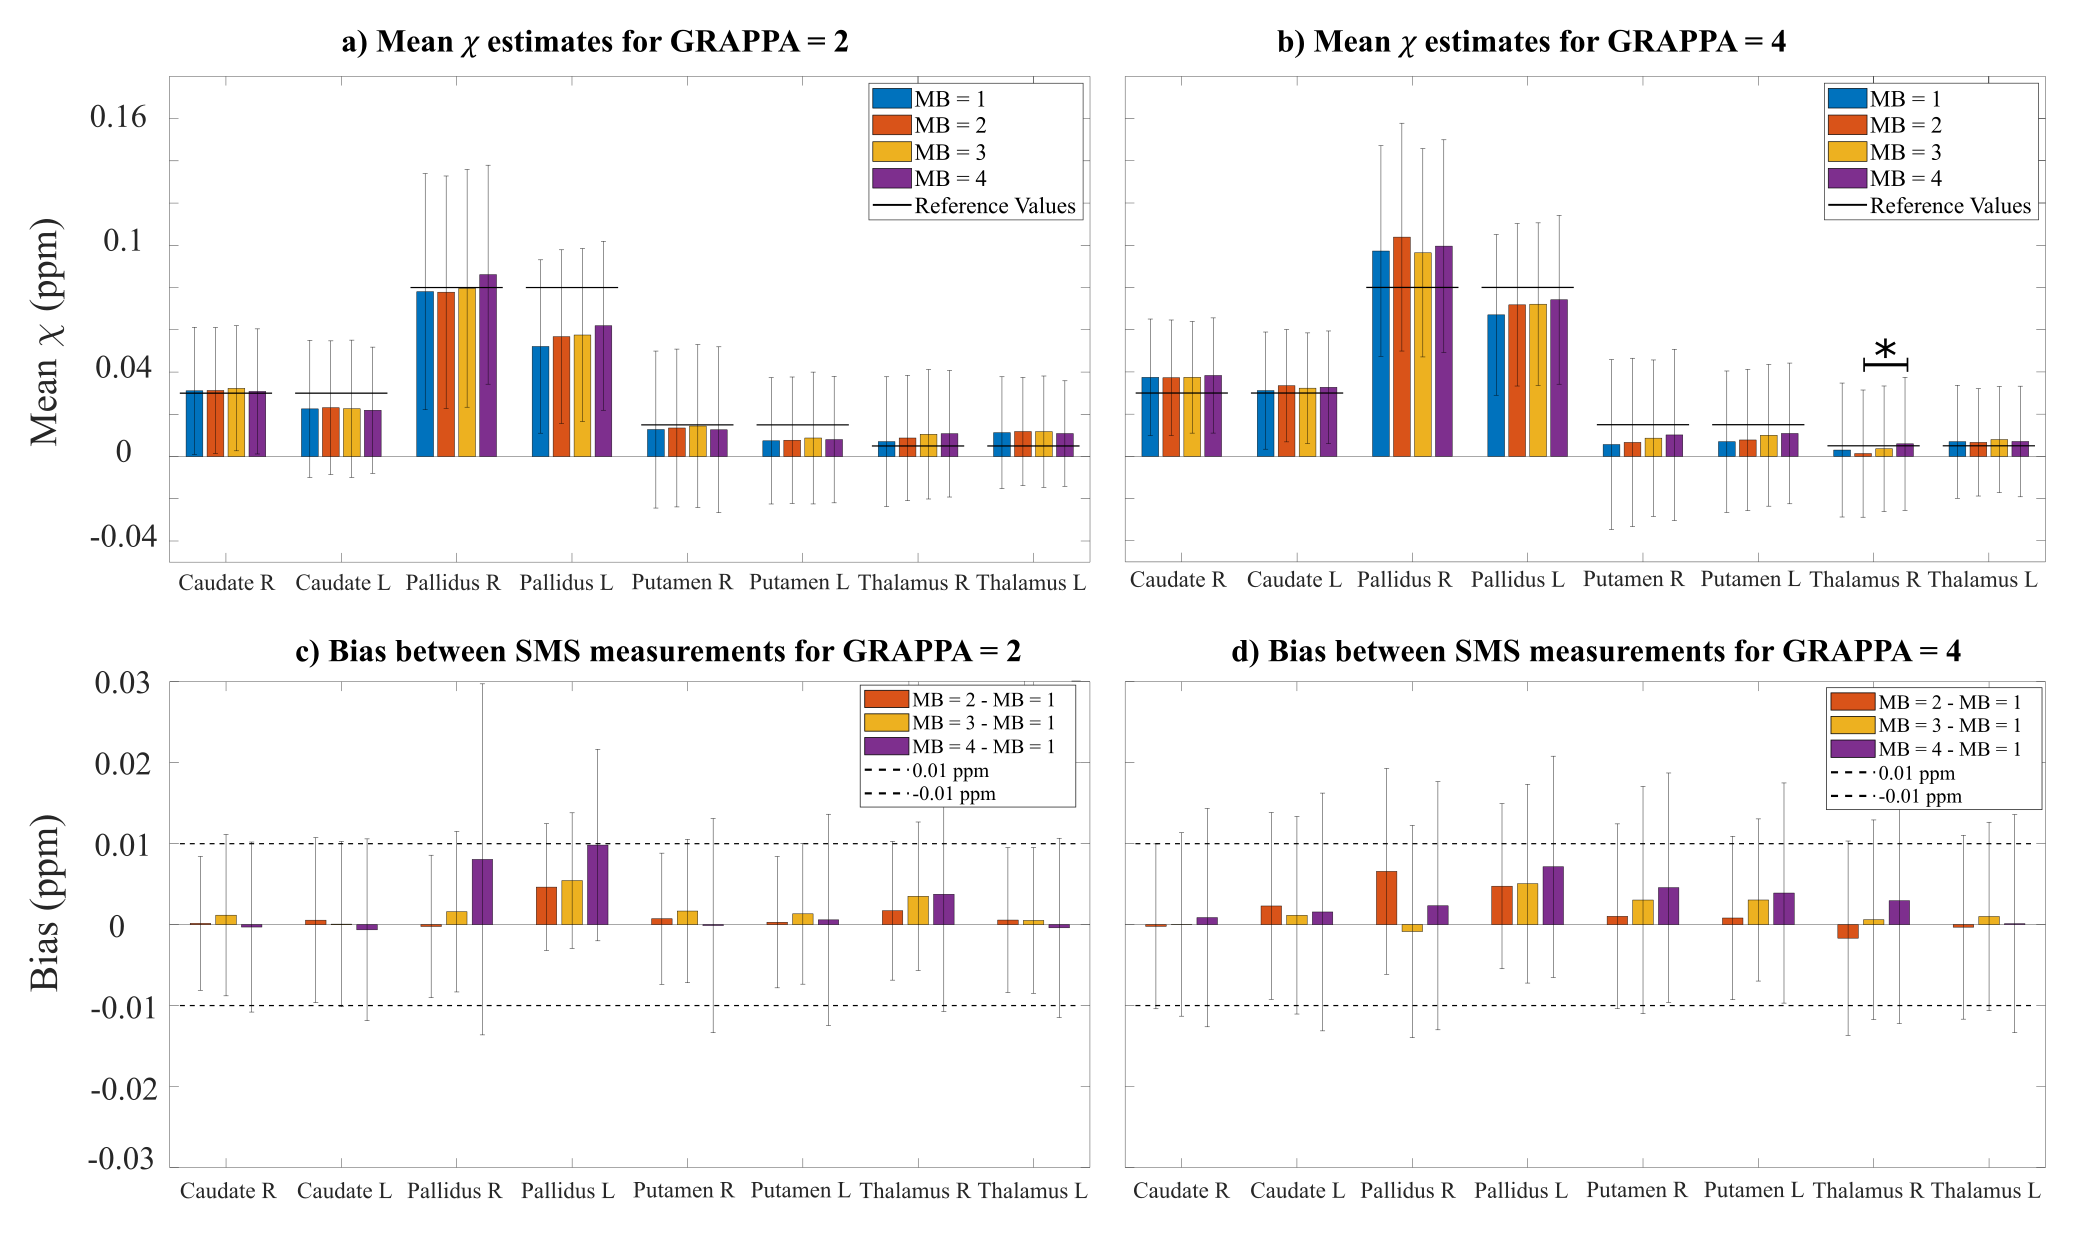
Figure 5: ROI mean χ values for all MB factors with
R=2 (a) and R=4 (b). * indicates p < 0.05 for post-hoc Dunn’s test. In general, SMS acceleration
did not significantly affect χ values. R=4 reduced distortion
and signal drop-out, resulting in higher χ values in some ROIs (e.g. globus pallidus). Bias
from Bland-Altman analyses for R=2 (c) and R=4 (d) indicates no systematic bias
in ROI mean χ for all MB factors between prescribed limits
of agreement of 0.01 ppm.
DOI: https://doi.org/10.58530/2022/2361