2358
Measurements of composite signals with MR-based neuronal current imaging: one step closer to clinical application.1Institute for Diagnostic and Interventional Neuroradiology, Support Center for Advanced Neuroimaging, University of Bern, Bern, Switzerland, 2Institute for Diagnostic and Interventional Neuroradiology, Support Center for Advanced Neuroimaging (SCAN), Inselspital, Bern, Bern, Switzerland
Synopsis
We evaluated the performance of stimulus-induced rotational saturation contrast (SIRS) to assess the possibility of detecting neuronal currents. We analyzed composite signals with multiple frequencies to evaluate the ability of the technique to be used as a filter of spectral components. We conclude that the method can separate and distinguish frequency components and reconstruct the distribution of spectral components between individually acquired signals. These tests are the basis for moving towards the clinical application of this sequence to locate fields with frequencies associated with specific pathologies.
Introduction
Being able to observe neuronal activity non-invasively remains a challenge for neuroscience to this day. Due to its capacity to sense magnetic fields non-invasively and with good spatial resolution, MR-based neuronal current imaging (NCI) has the potential to become a good complementary tool for state-of-the-art techniques1,2. The recently proposed Stimulus induced rotary saturation method (SIRS), generates a contrast based on a double resonance effect between the magnetization and an oscillating neuronal current. This method has gained increasing interest in recent years and its capabilities have been demonstrated in phantoms2-4. Still, most of these tests were performed using perfect sinusoidal fields, which are far from the complexity of physiological signals. To move towards the clinical application of this sequence, we studied the response of the SIRS contrast in the presence of composite signals and analyzed the capacity of the method to distinguish and separate frequencies components present in the signal.Methods
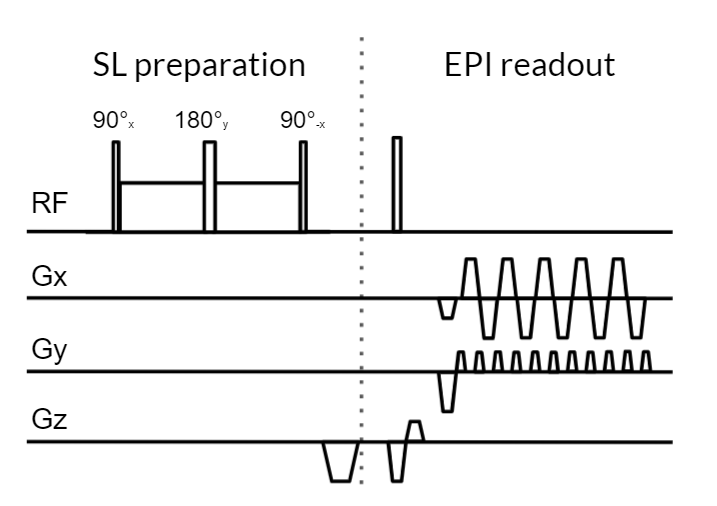
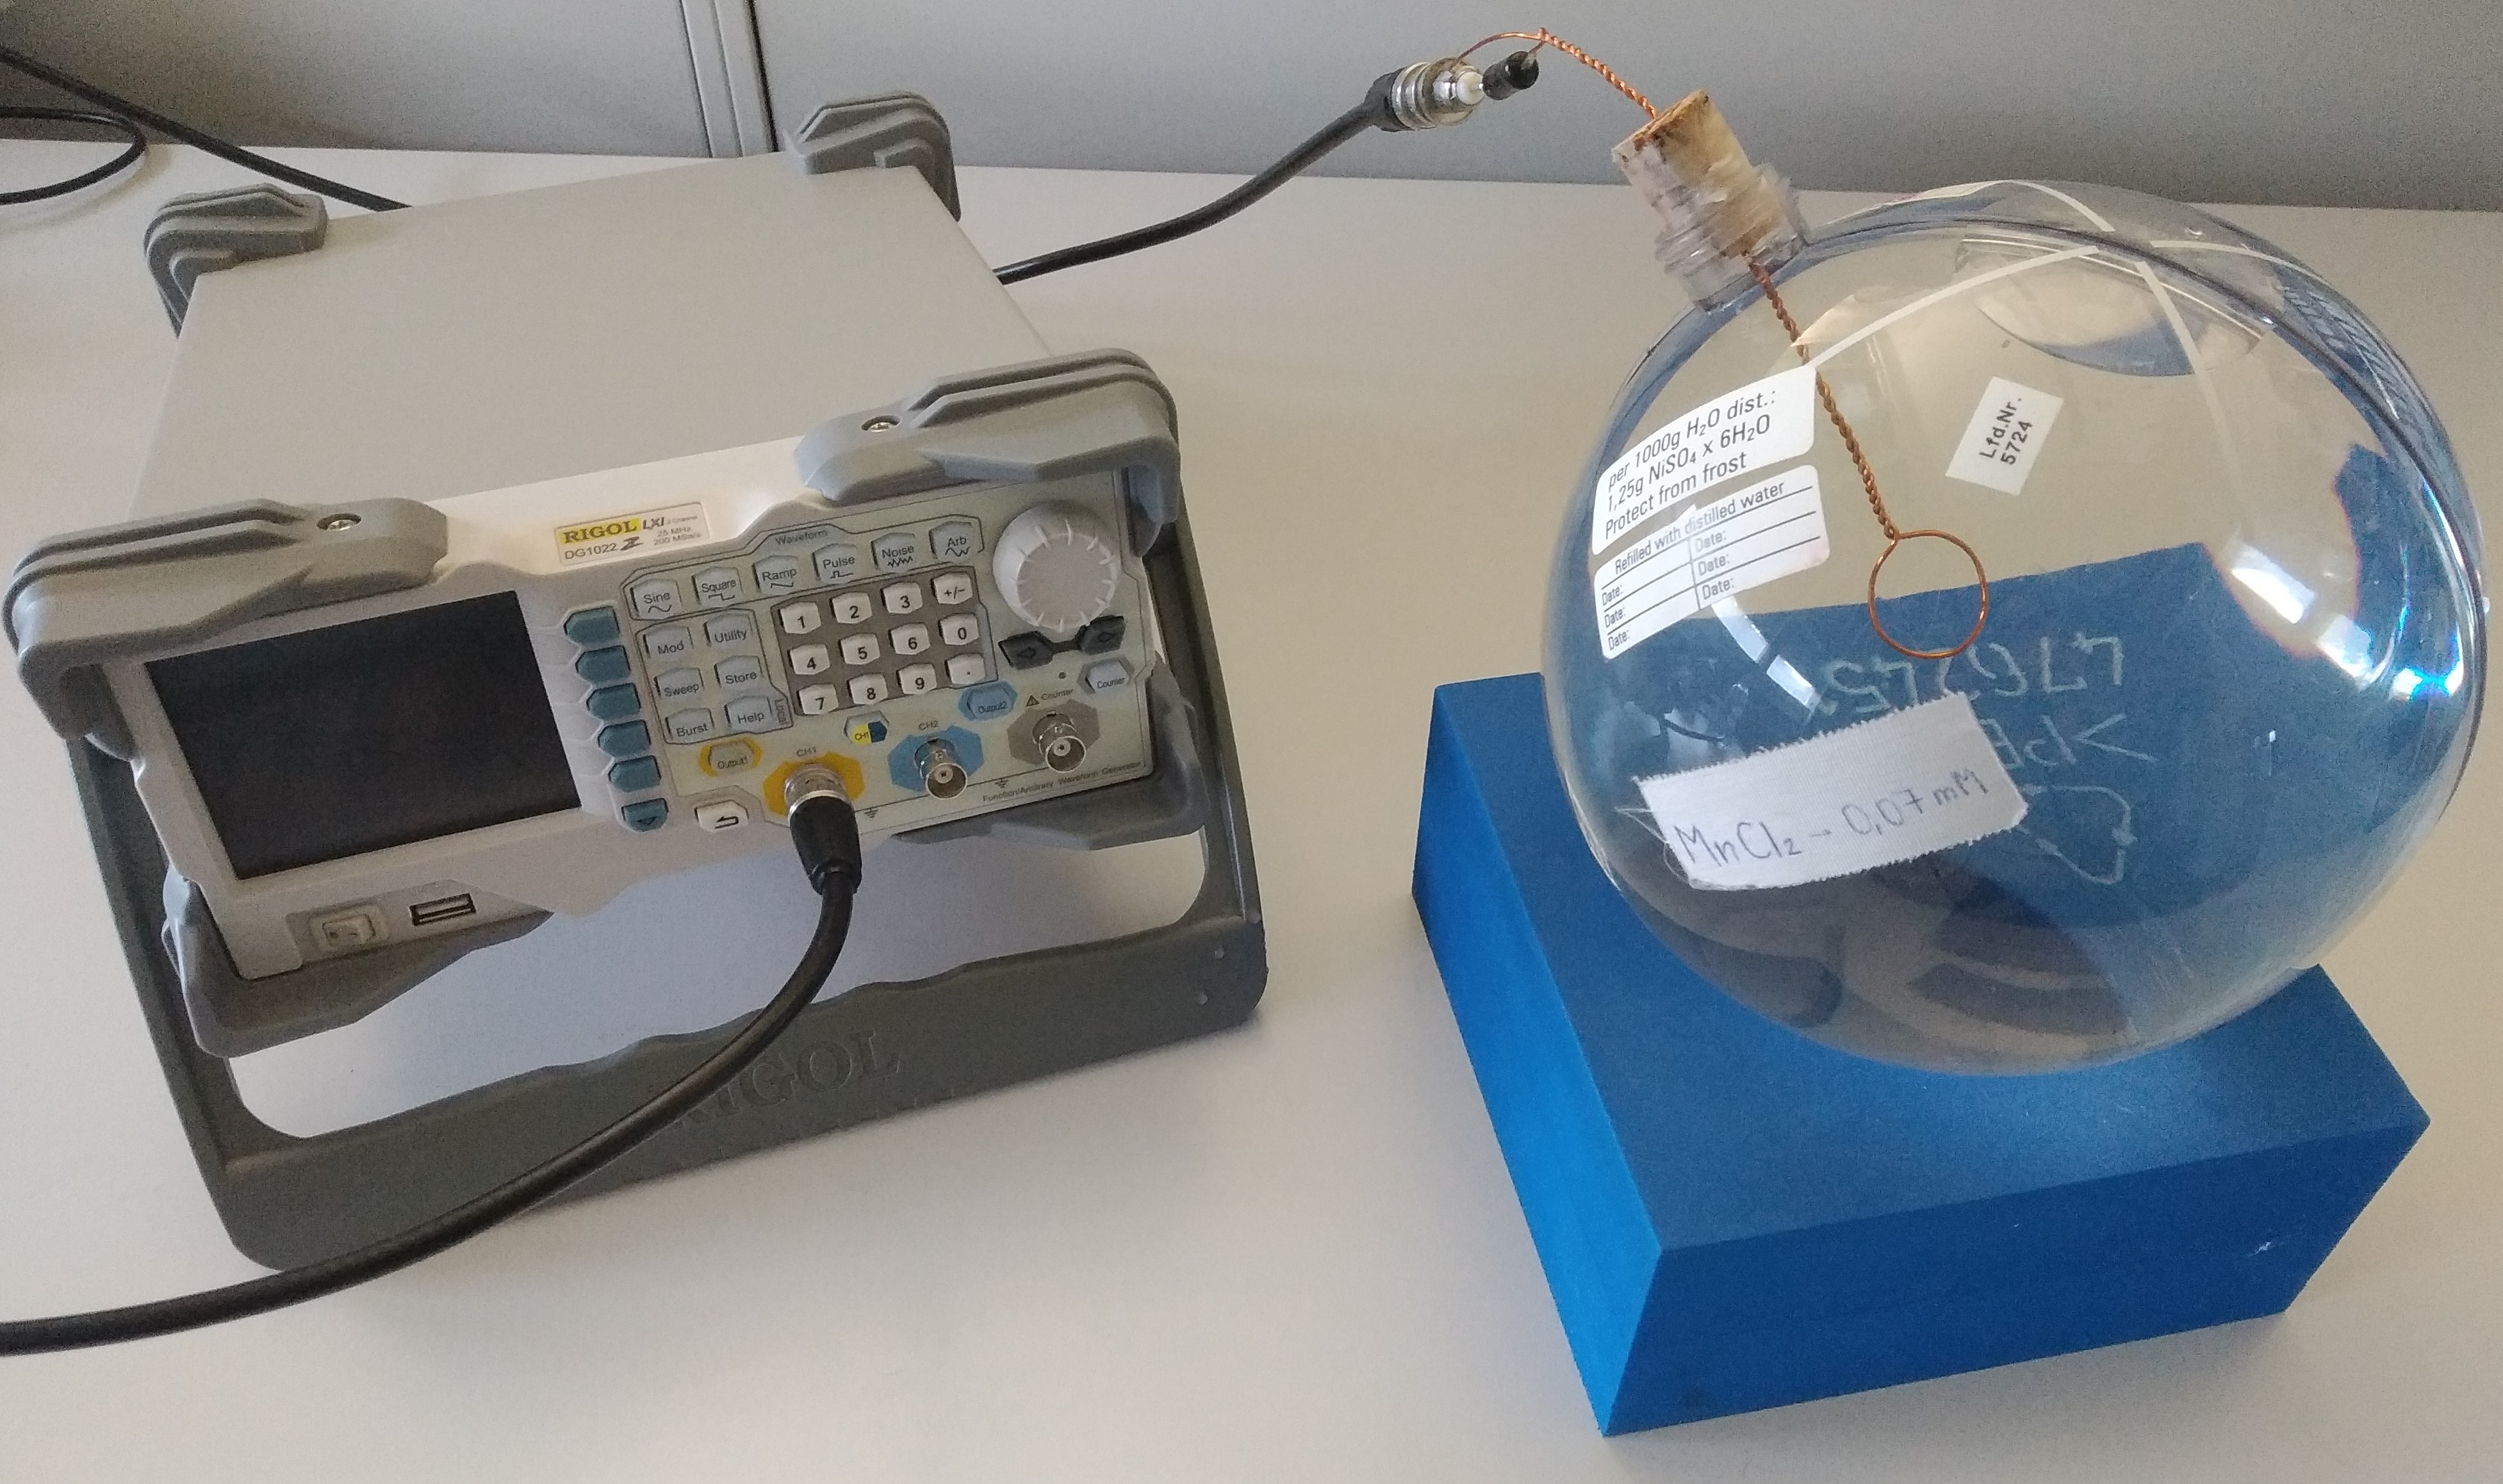
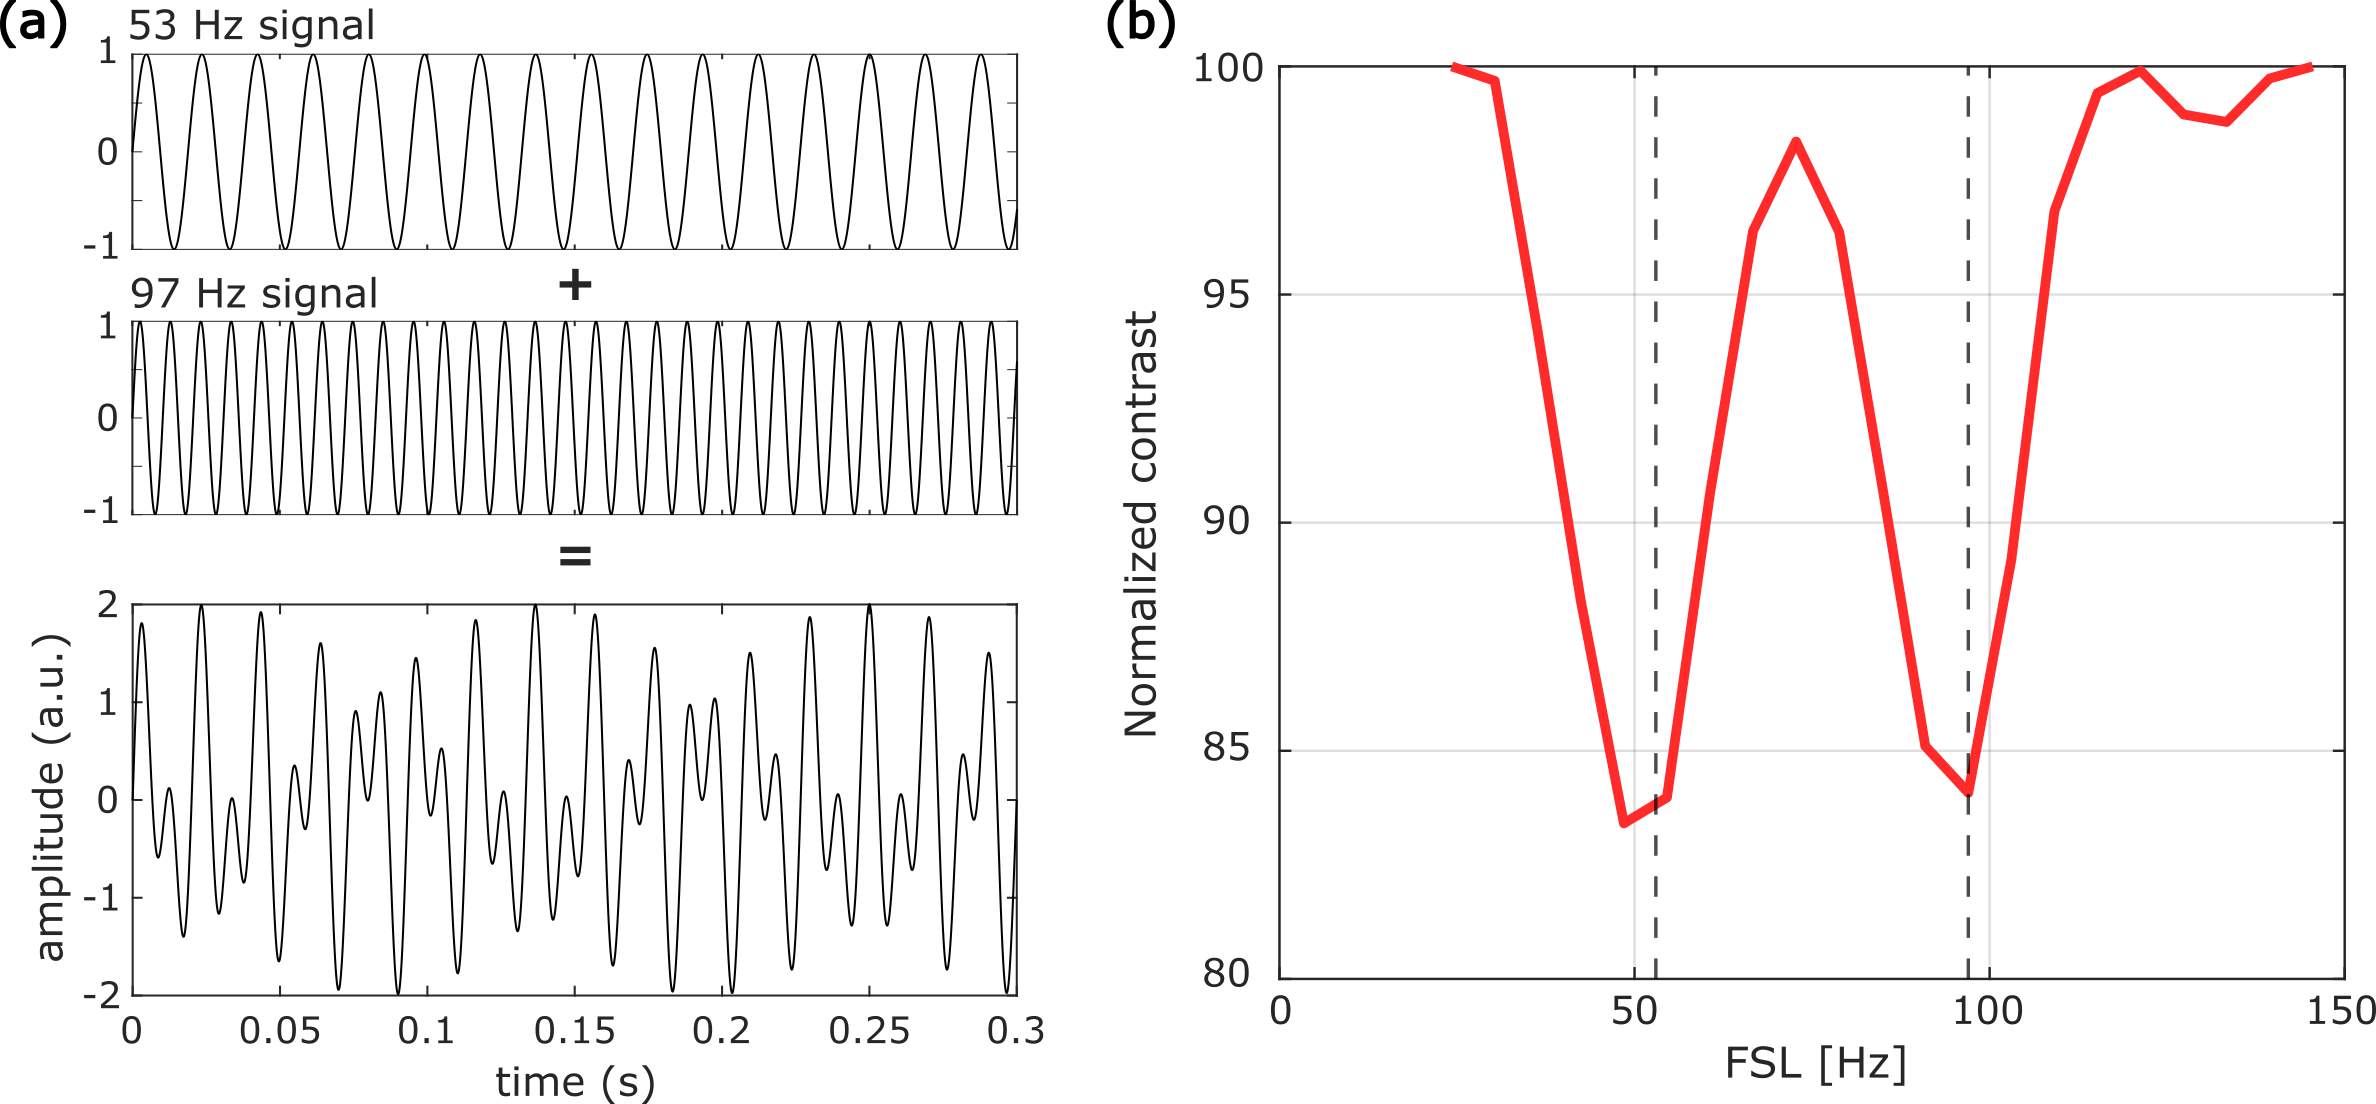
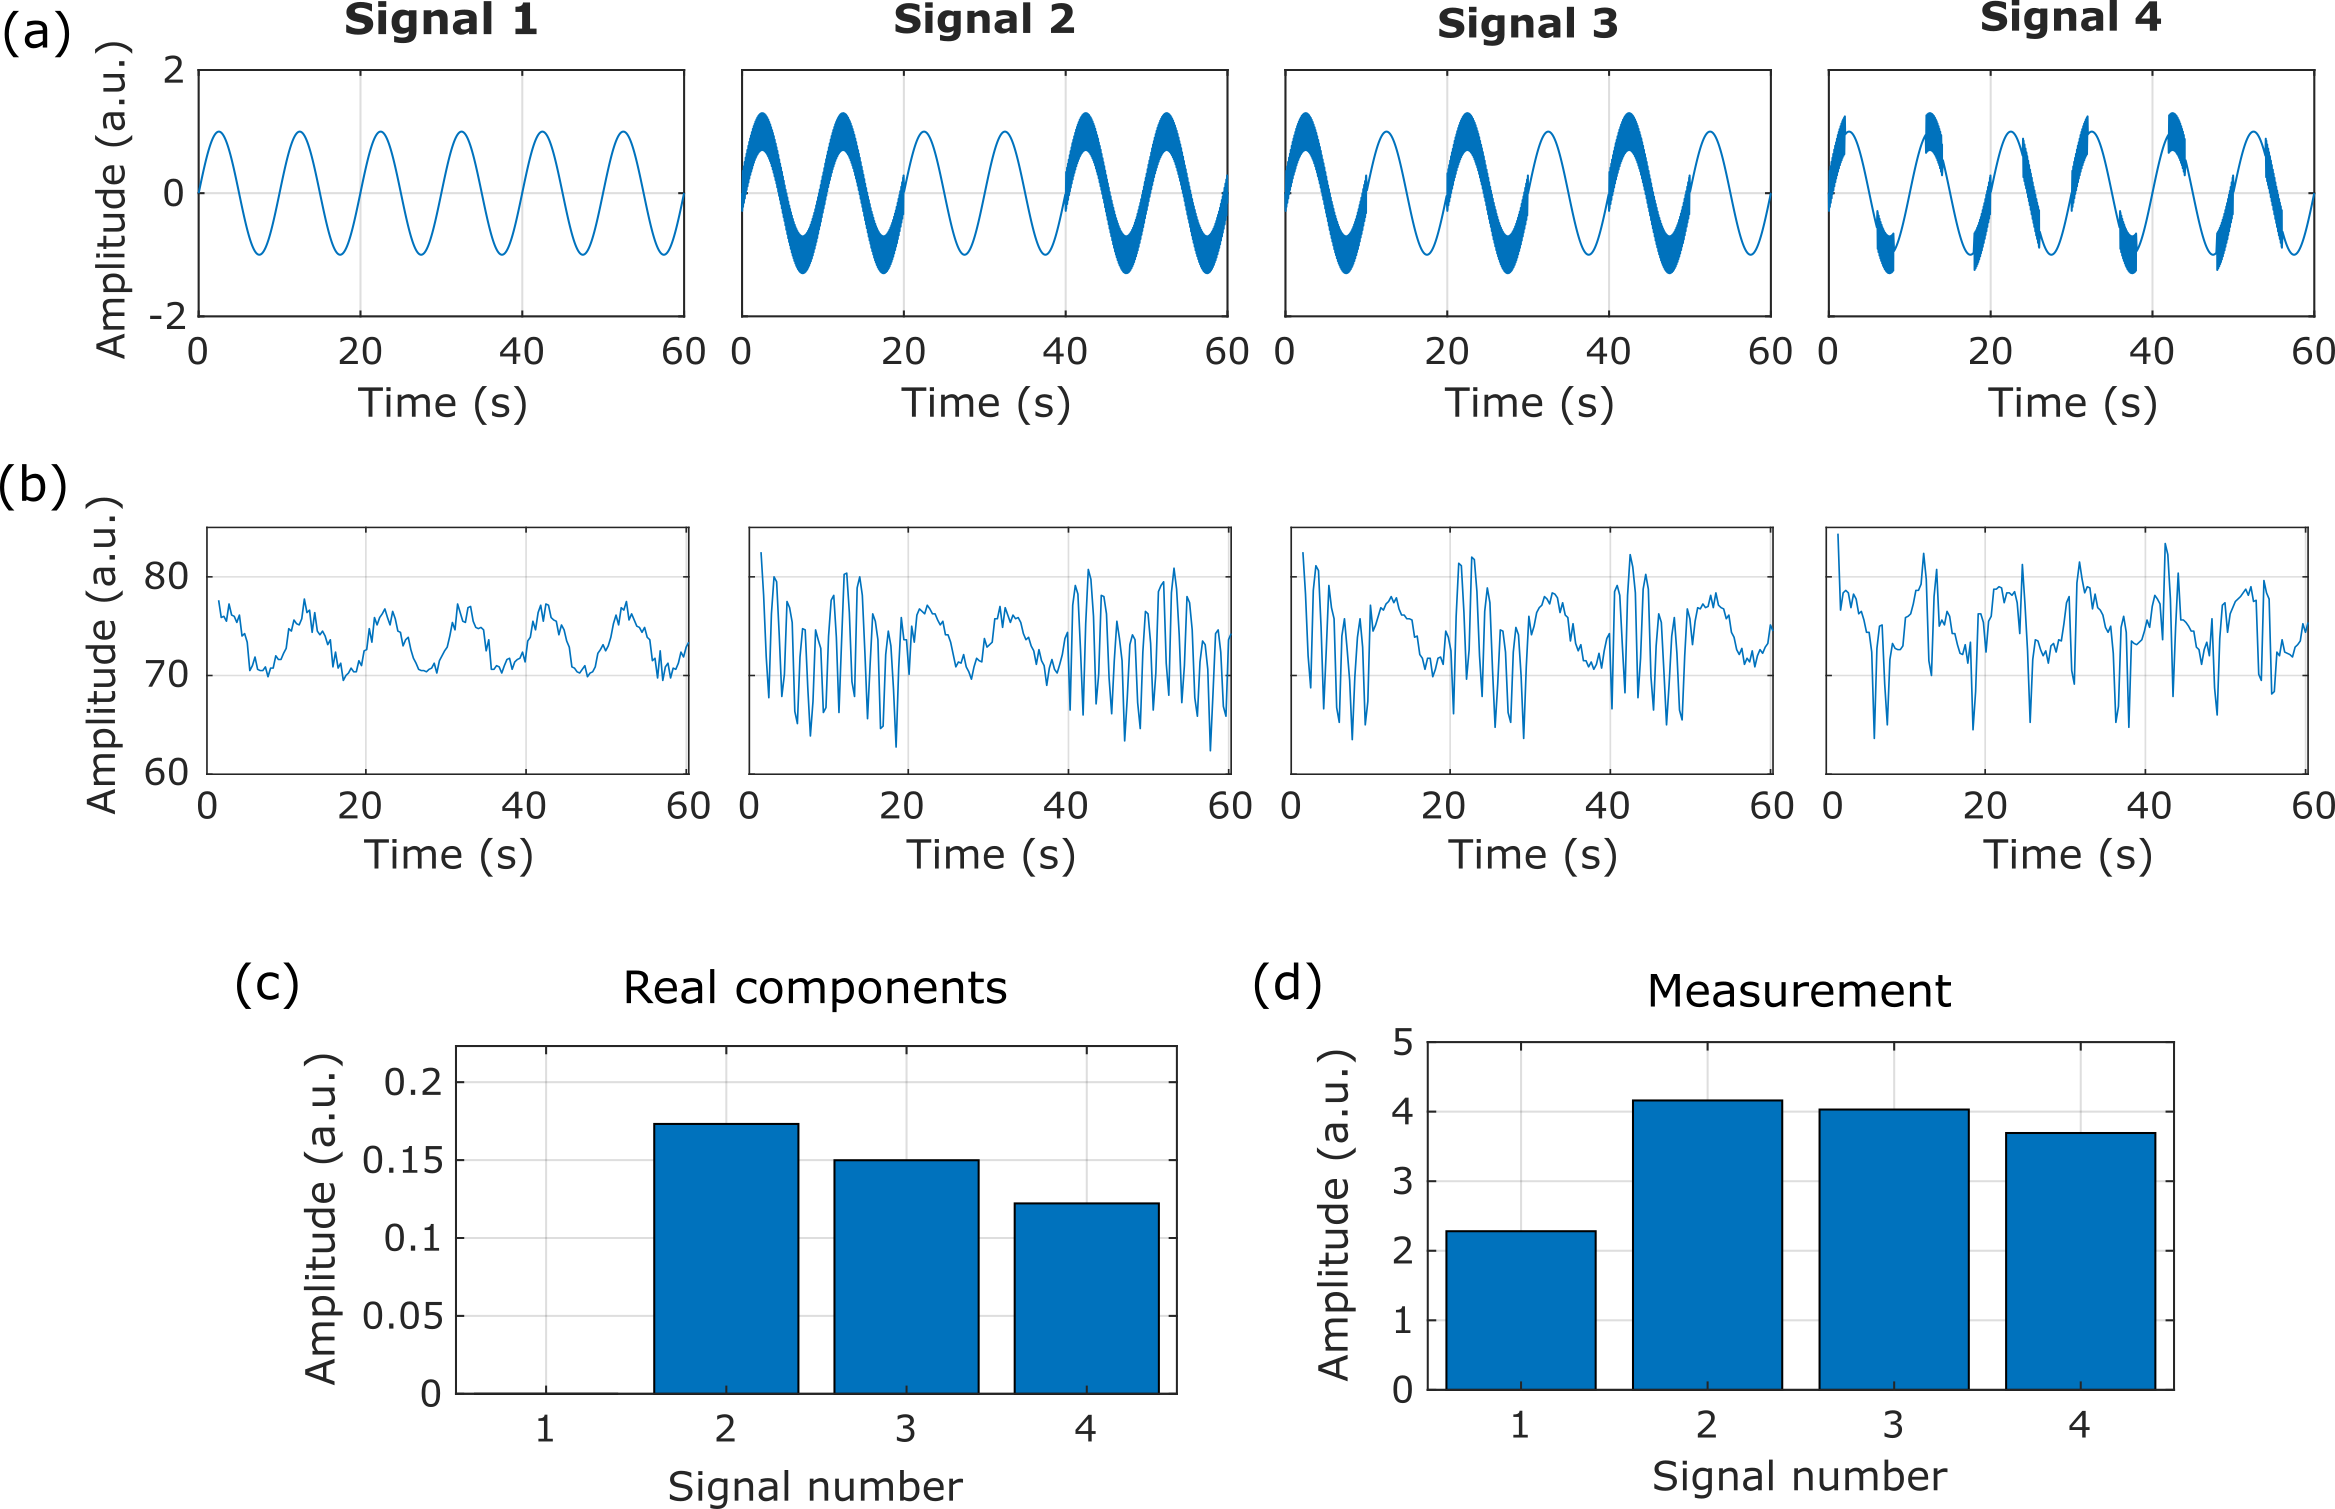
The pulse sequence is a non-selective Composite rotary echo spin locking (CRESL)5 prepared EPI as shown in Figure 1. During the application of the CRESL pulse, the oscillating field information is encoded in the MR signal. Neural electrical fields were simulated using an electrical phantom connected to a function generator as is shown in Figure 2. Measurements were performed in a 3T VIDA whole-body scanner (Siemens). Images were acquired for a Spin Locking (SL) preparation of 100 ms of duration, and single-slice acquisition of a 64x64 matrix. Two experiments with composite signals were performed. The first input signal is composed of the sum of two sinusoids of 53 and 97 Hz with an initial zero phase and equal amplitude. The measurement was acquired as a function of the frequency of the SL (FSL) ranging from 25 to 145 Hz. 50 measures were averaged for each acquisition point, with the composite signal turned on during the whole acquisition (no trigger). The second experiment was to evaluate the capability of recovering the amplitude of a frequency component and four individual signals were measured. All of them are composed of a 0.1 Hz sinusoidal and for signals 2, 3, and 4, a 90 Hz sinusoidal is added with 10% of the amplitude of the slow-wave. For these three signals, the fast oscillation is divided into blocks of 20, 10, and 2 seconds respectively. The real components of the original signal were calculated as the standard deviation of the band passed signal with a 20 Hz bandwidth (80 to 100 Hz). The measurement of the individual signals was performed as a function of time for FSL = 90 Hz. The standard deviation of the acquired signal was used to calculate the 90 Hz component of the individual signals.Results
The input signal for the first experiment can be seen in Figure 3 (a). The measurement acquired as a function of FSL is shown in Figure 3 (b). Two peaks with maximum contrast at 49 and 97 Hz are observed. Interference between the summed signals does not affect the detection of the individual components as they can be clearly distinguished from each other. The detection bandwidth, which is in the order of 16 Hz, will be the limiting factor for the separation of individual components. The input signal for the second experiment can be seen in Figure 4 (a), and the measurement of each signal in time is shown in Figure 4(b). The real components are presented in Figure 4 (c) and the reconstructed ones are shown in Figure 4 (d). Although the FSL was set at 90 Hz, the 0.1 Hz slow-wave is still detected due to the change in the B0 field, this results in an erroneous proportion in signal 1. SL on and SL off measurements (EPI only) could be acquired alternately to avoid the influence of B0 changes and field inhomogeneities that affect the read-out. The 90Hz oscillation is still the main frequency component for signals 2 to 4 and the reconstructed components follow the same pattern as the real ones. Therefore, if the different signals represent different voxels in an image, the method would be able to locate the signal with the highest component of 90 Hz.Conclusions
We conclude that the SIRS contrast can separate the components of composite signals and reconstruct the frequency components of individually measured signals. These results show that the presented technique has the potential to be used in clinical studies for the detection and localization of oscillating fields with frequencies associated with specific pathologies. Further analysis and testing with composite signals and in the presence of noise will be done in the future to evaluate the detectability limit of the sequence.Acknowledgements
This project is funded by the consortium “Predict and Monitor Epilepsy After a First Seizure: The Swiss-First Study” from the Swiss National Science Foundation (SNSF, CRSII5-180365).References
[1] Bodurka, J., et al. "Current-induced magnetic resonance phase imaging." Journal of magnetic resonance (San Diego, Calif.: 1997) 137.1 (1999): 265-271.
[2] Witzel, Thomas, et al. "Stimulus-induced Rotary Saturation (SIRS): a potential method for the detection of neuronal currents with MRI." Neuroimage 42.4 (2008): 1357-1365.
[3] Halpern-Manners, Nicholas W., et al. "Magnetic resonance imaging of oscillating electrical currents." Proceedings of the National Academy of Sciences 107.19 (2010): 8519-8524.
[4] Ito, Yosuke, Masahito Ueno, and Tetsuo Kobayashi. "Neural magnetic field dependent fMRI toward direct functional connectivity measurements: A phantom study." Scientific Reports 10.1 (2020): 1-11.
[5] Witschey II, Walter RT, et al. "Artifacts in T1ρ-weighted imaging: Compensation for B1 and B0 field imperfections." Journal of magnetic resonance 186.1 (2007): 75-85.
Figures