2351
Preclinical Evaluation of Two Compressed Sensing Methods for DTI1Univ. Grenoble Alpes - Inserm U1216 - Grenoble Institut des Neurosciences (GIN), Grenoble, France, 2Univ. Grenoble Alpes - Inserm US17 - CNRS UMS3552 - CHUGA - IRMaGe, Grenoble, France
Synopsis
Compressed Sensing (CS) is not routinely implemented at the preclinical level, especially in case of multiple receivers. In this study, we evaluate preclinical Kernel Low-Rank and Conventional CS reconstruction schemes at 9.4T using a 4-channel receive coil and spin-echo data. By analyzing diffusion parametric maps and white-matter tracts, we evaluate the median absolute error, the structural similarity index measure and the mean fiber length as a function of the acceleration factor and of the CS reconstruction pipeline.
Introduction
Compressed Sensing (CS) is a method based on the combination of k-space undersampling and dedicated post-processing to maintain acceptable image quality1. CS is widely used to accelerate clinical MRI acquisitions2, but remains confidential in preclinical settings with a use limited to single channel acquisitions3. In this study, we evaluate Kernel Low-Rank CS4 and Conventional CS1,3 on a preclinical system using a four-channel receive surface coil. While Conventional CS relies only on sparsity constraints, KLR CS is based on machine learning approaches (Kernel Principal Component Analysis) for dynamic MRI5, relying also on q-space constraints and performing a joint reconstruction. Using data acquired on fixed tissue samples at 9.4T, we compare two CS reconstruction pipelines for DTI acquisitions based on the Berkeley Advanced Reconstruction Toolbox (BART)6,7 for Conventional CS and the code from (Zhang et al., 2020) for Kernel Low-Rank CS.Materials and Methods
- Three fixed mouse skulls from wild-type (WT) and heterozygous microtubule-associated protein 6 (MAP6+/-) mice were imaged at 9.4T (Bruker; 4-channels, surface receive coil) with a Bruker 3D spin-echo DTI sequence (FOV: 18.0x9.0x11.0mm3;resolution:0.1x0.1x0.1mm3; 30 directions at b=3000s/mm2 and 3 b=0s/mm2 images) for the fully sampled acquisitions (i.e. reference image; Acceleration Factor AF=1; acquisition duration: 14h);
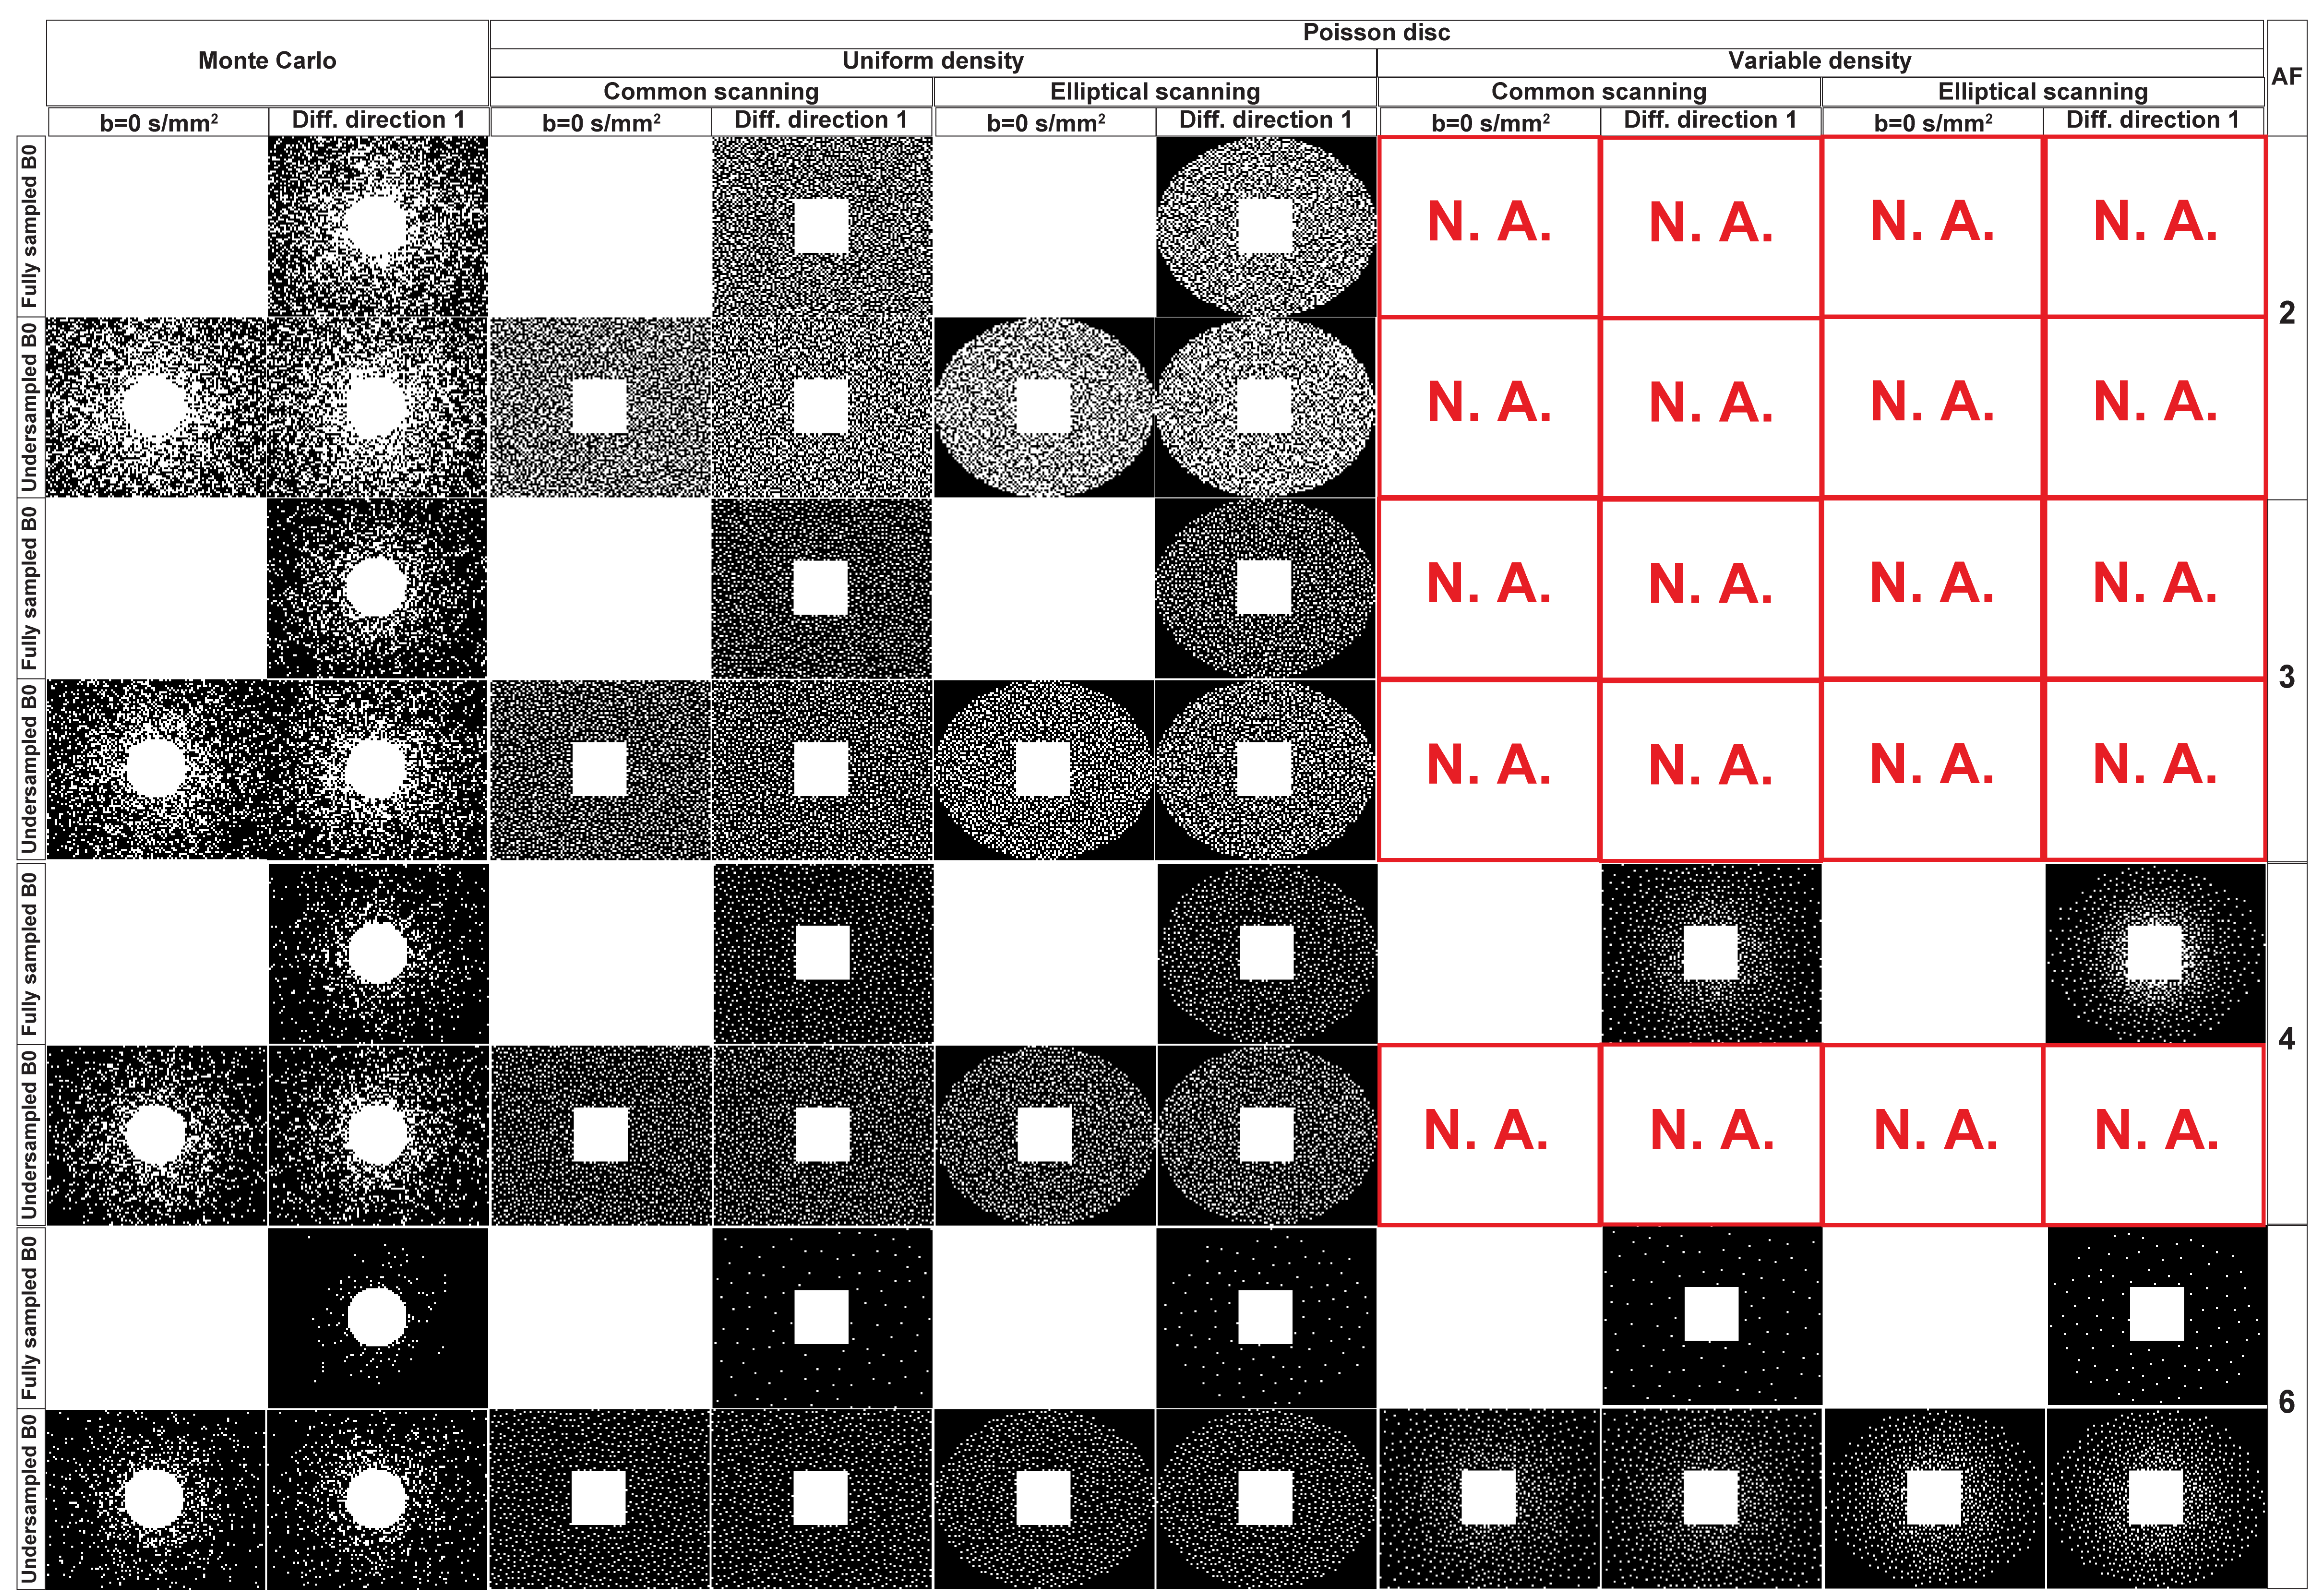
- Undersampling patterns: Poisson-disc8 and Monte Carlo3 for AF=2,3,4 and 6. Two different ways to distribute the AF over the DTI volumes were tested: undersampling or fully sampling b=0s/mm2 images. Mono and multi-mask mode were also tested, where the first utilize one single undersampling pattern for each DTI volume and the second one different undersampling pattern for each volume;
- Simulated undersampled k-spaces were obtained by multiplying undersampling patterns by fully sampled k-spaces;
- Image reconstruction: BARTv0.6.007 for Conventional CS (hereafter called BART CS; λ1=0.002, λ2 = 0.005,maxIteration=2003; coil sensitivity maps obtained by ESPIRiT9 calibration) and code from (Zhang et al.,2020) for Kernel Low-Rank CS (hereafter called KLR CS; maxIteration=200 and six diffusion bases4).
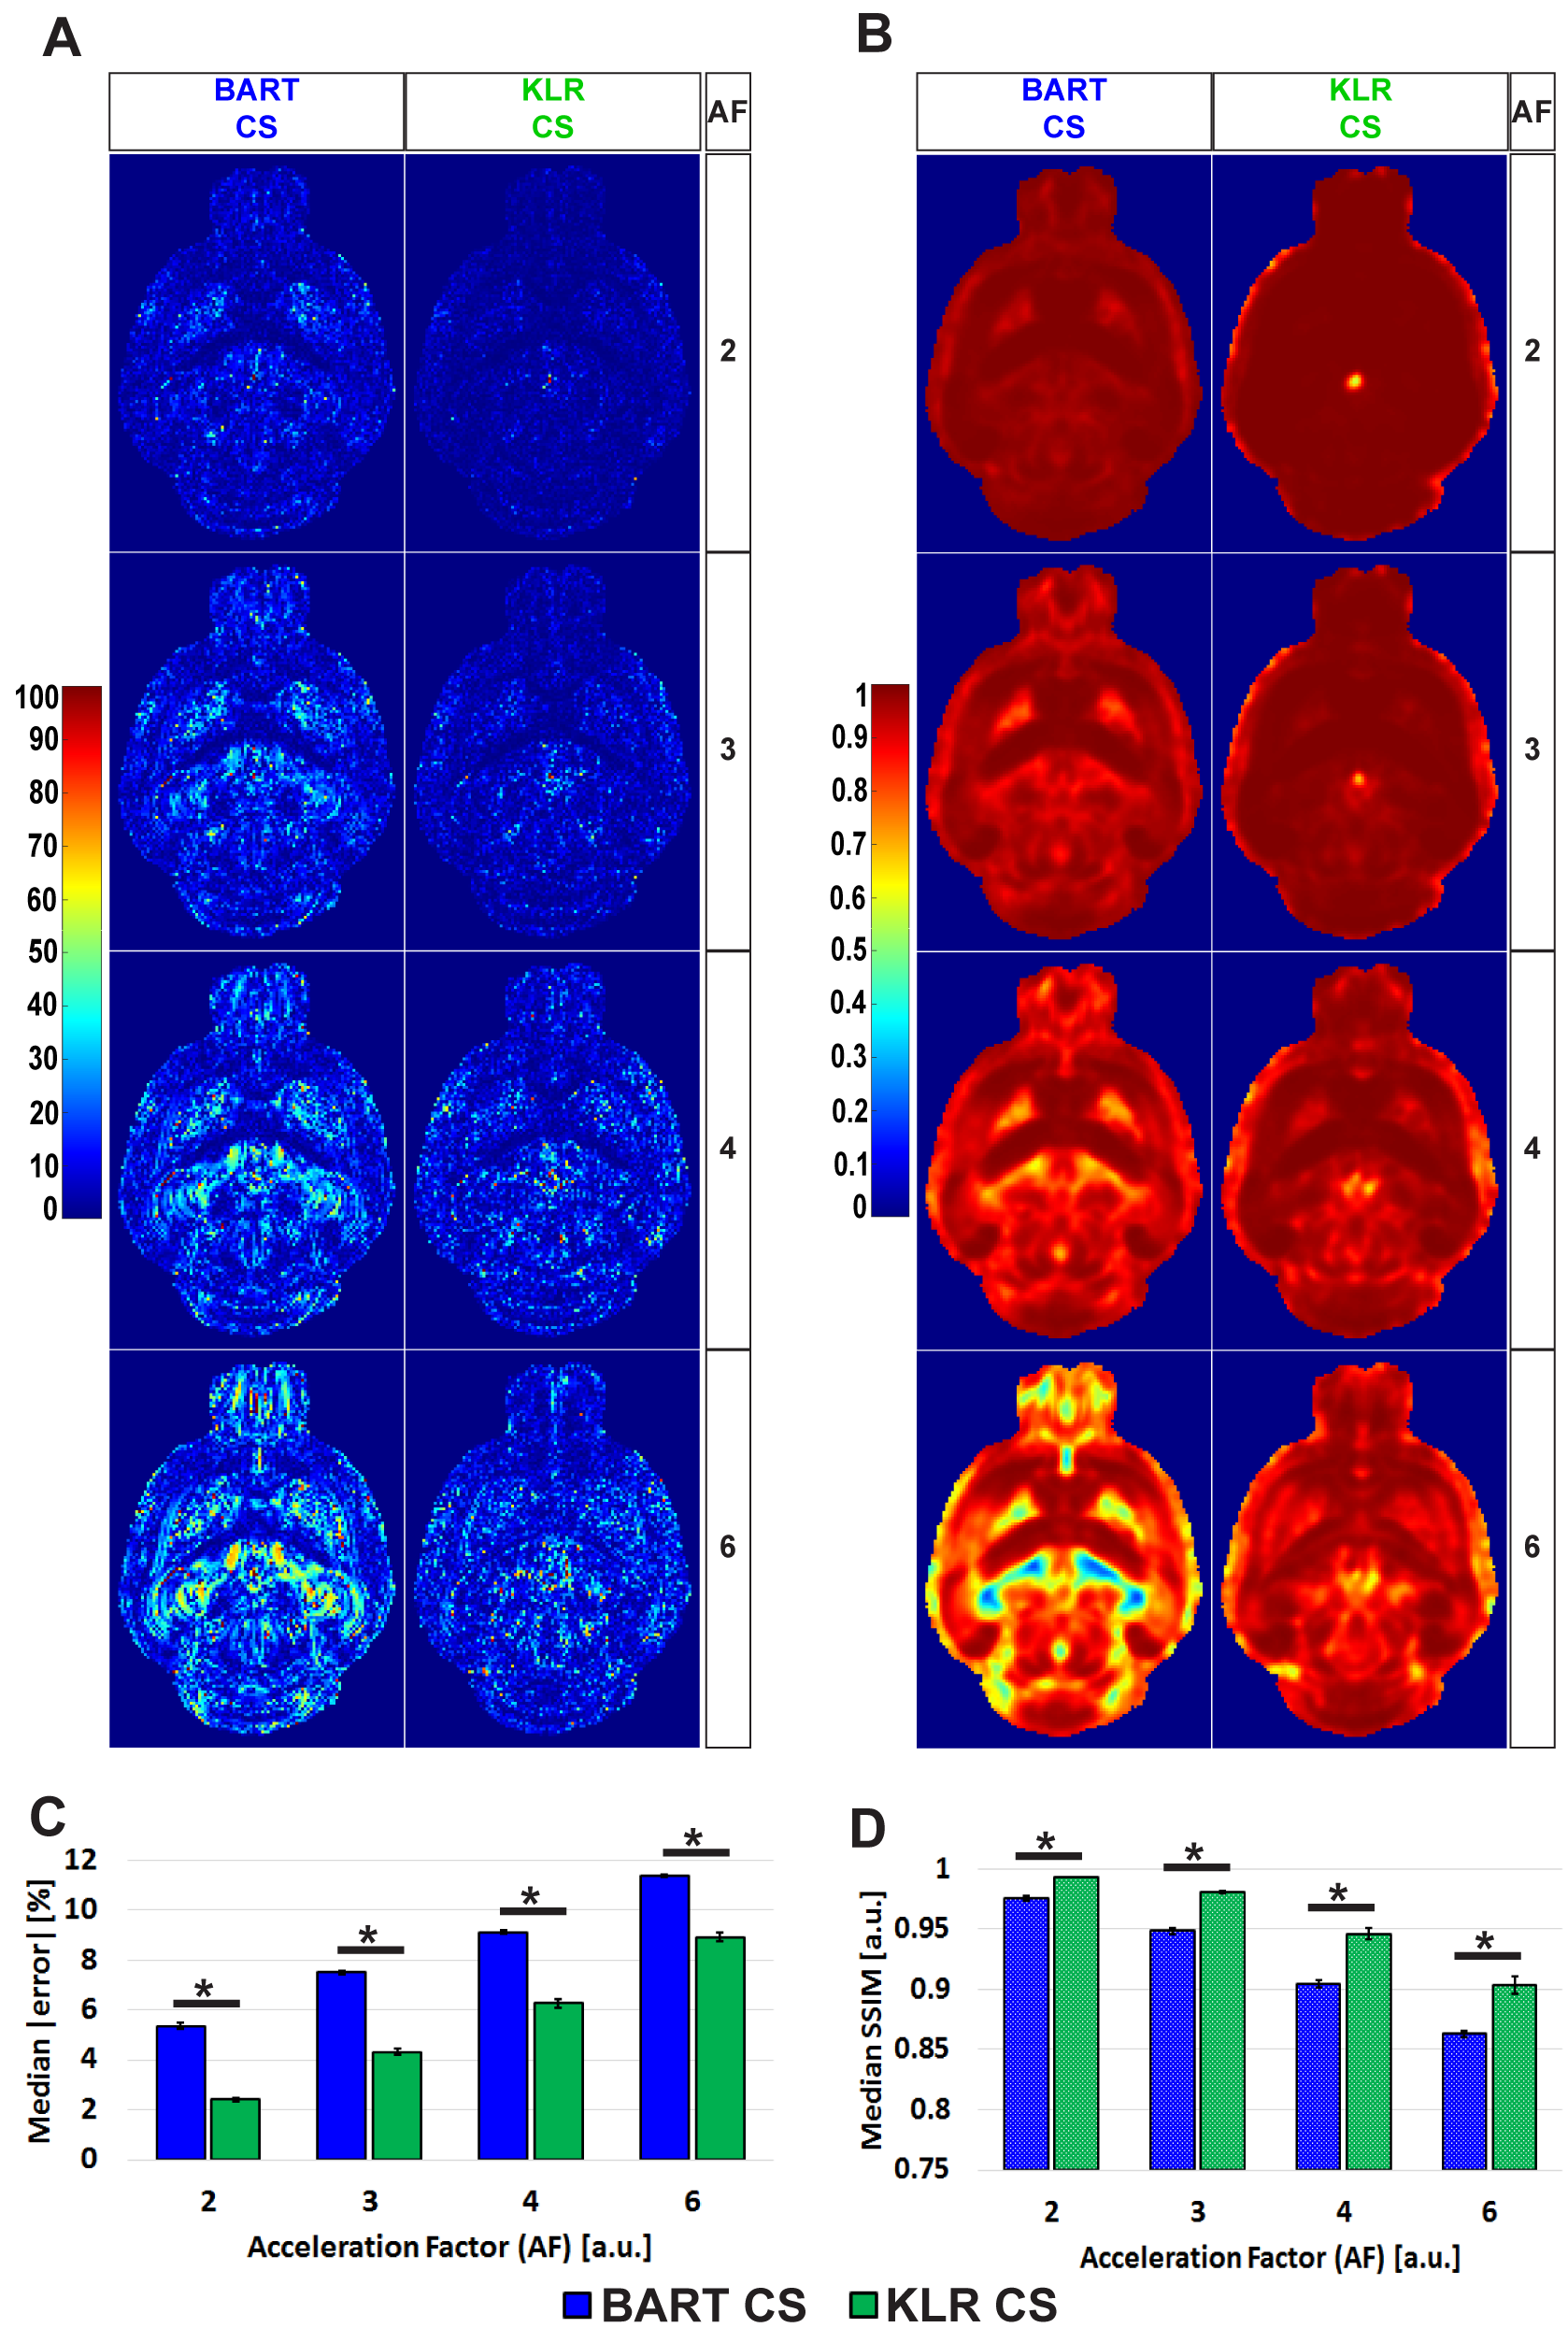
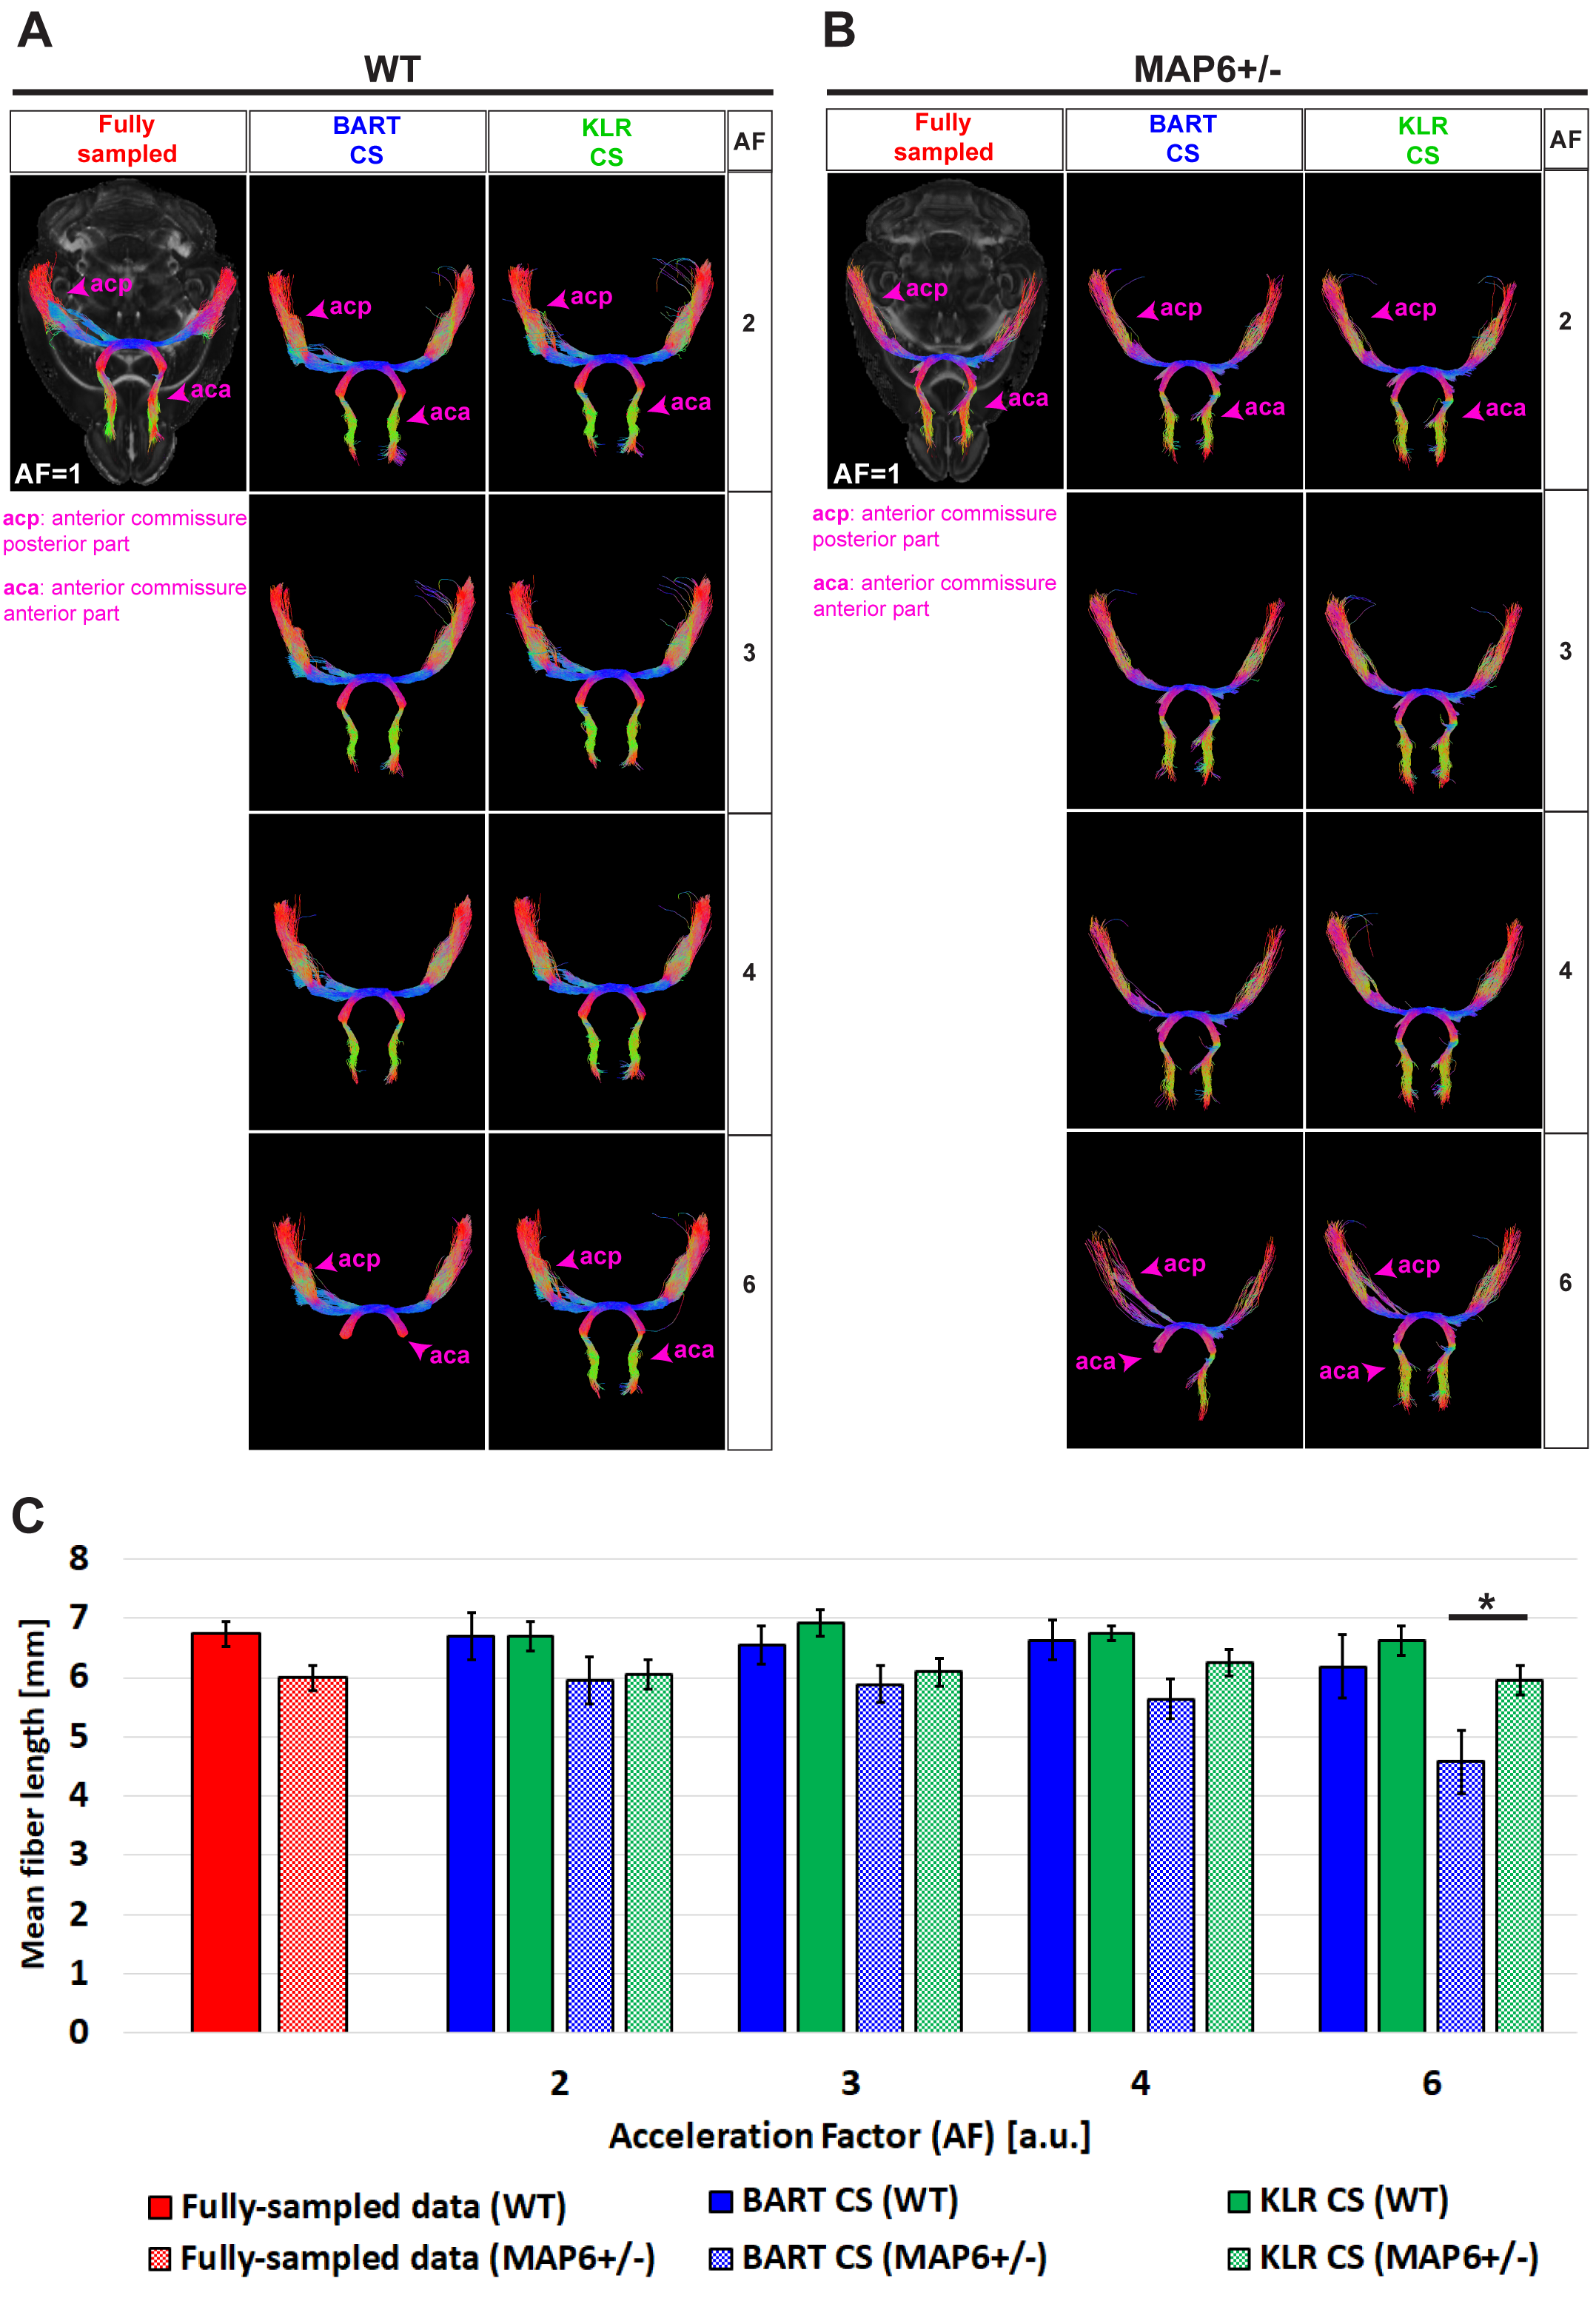
- Two metrics were calculated to compare CS reconstructions of fractional anisotropy (FA) and mean diffusivity (MD) maps with the reference, fully sampled, image: The absolute error (%) and the Structural Similarity Index Measure (SSIM, ranging from 0 (worst) up to 1 (best)). For white-matter bundles, the mean fiber length was used to assess tractographies of the anterior commissure obtained by MRtrix310.
Results
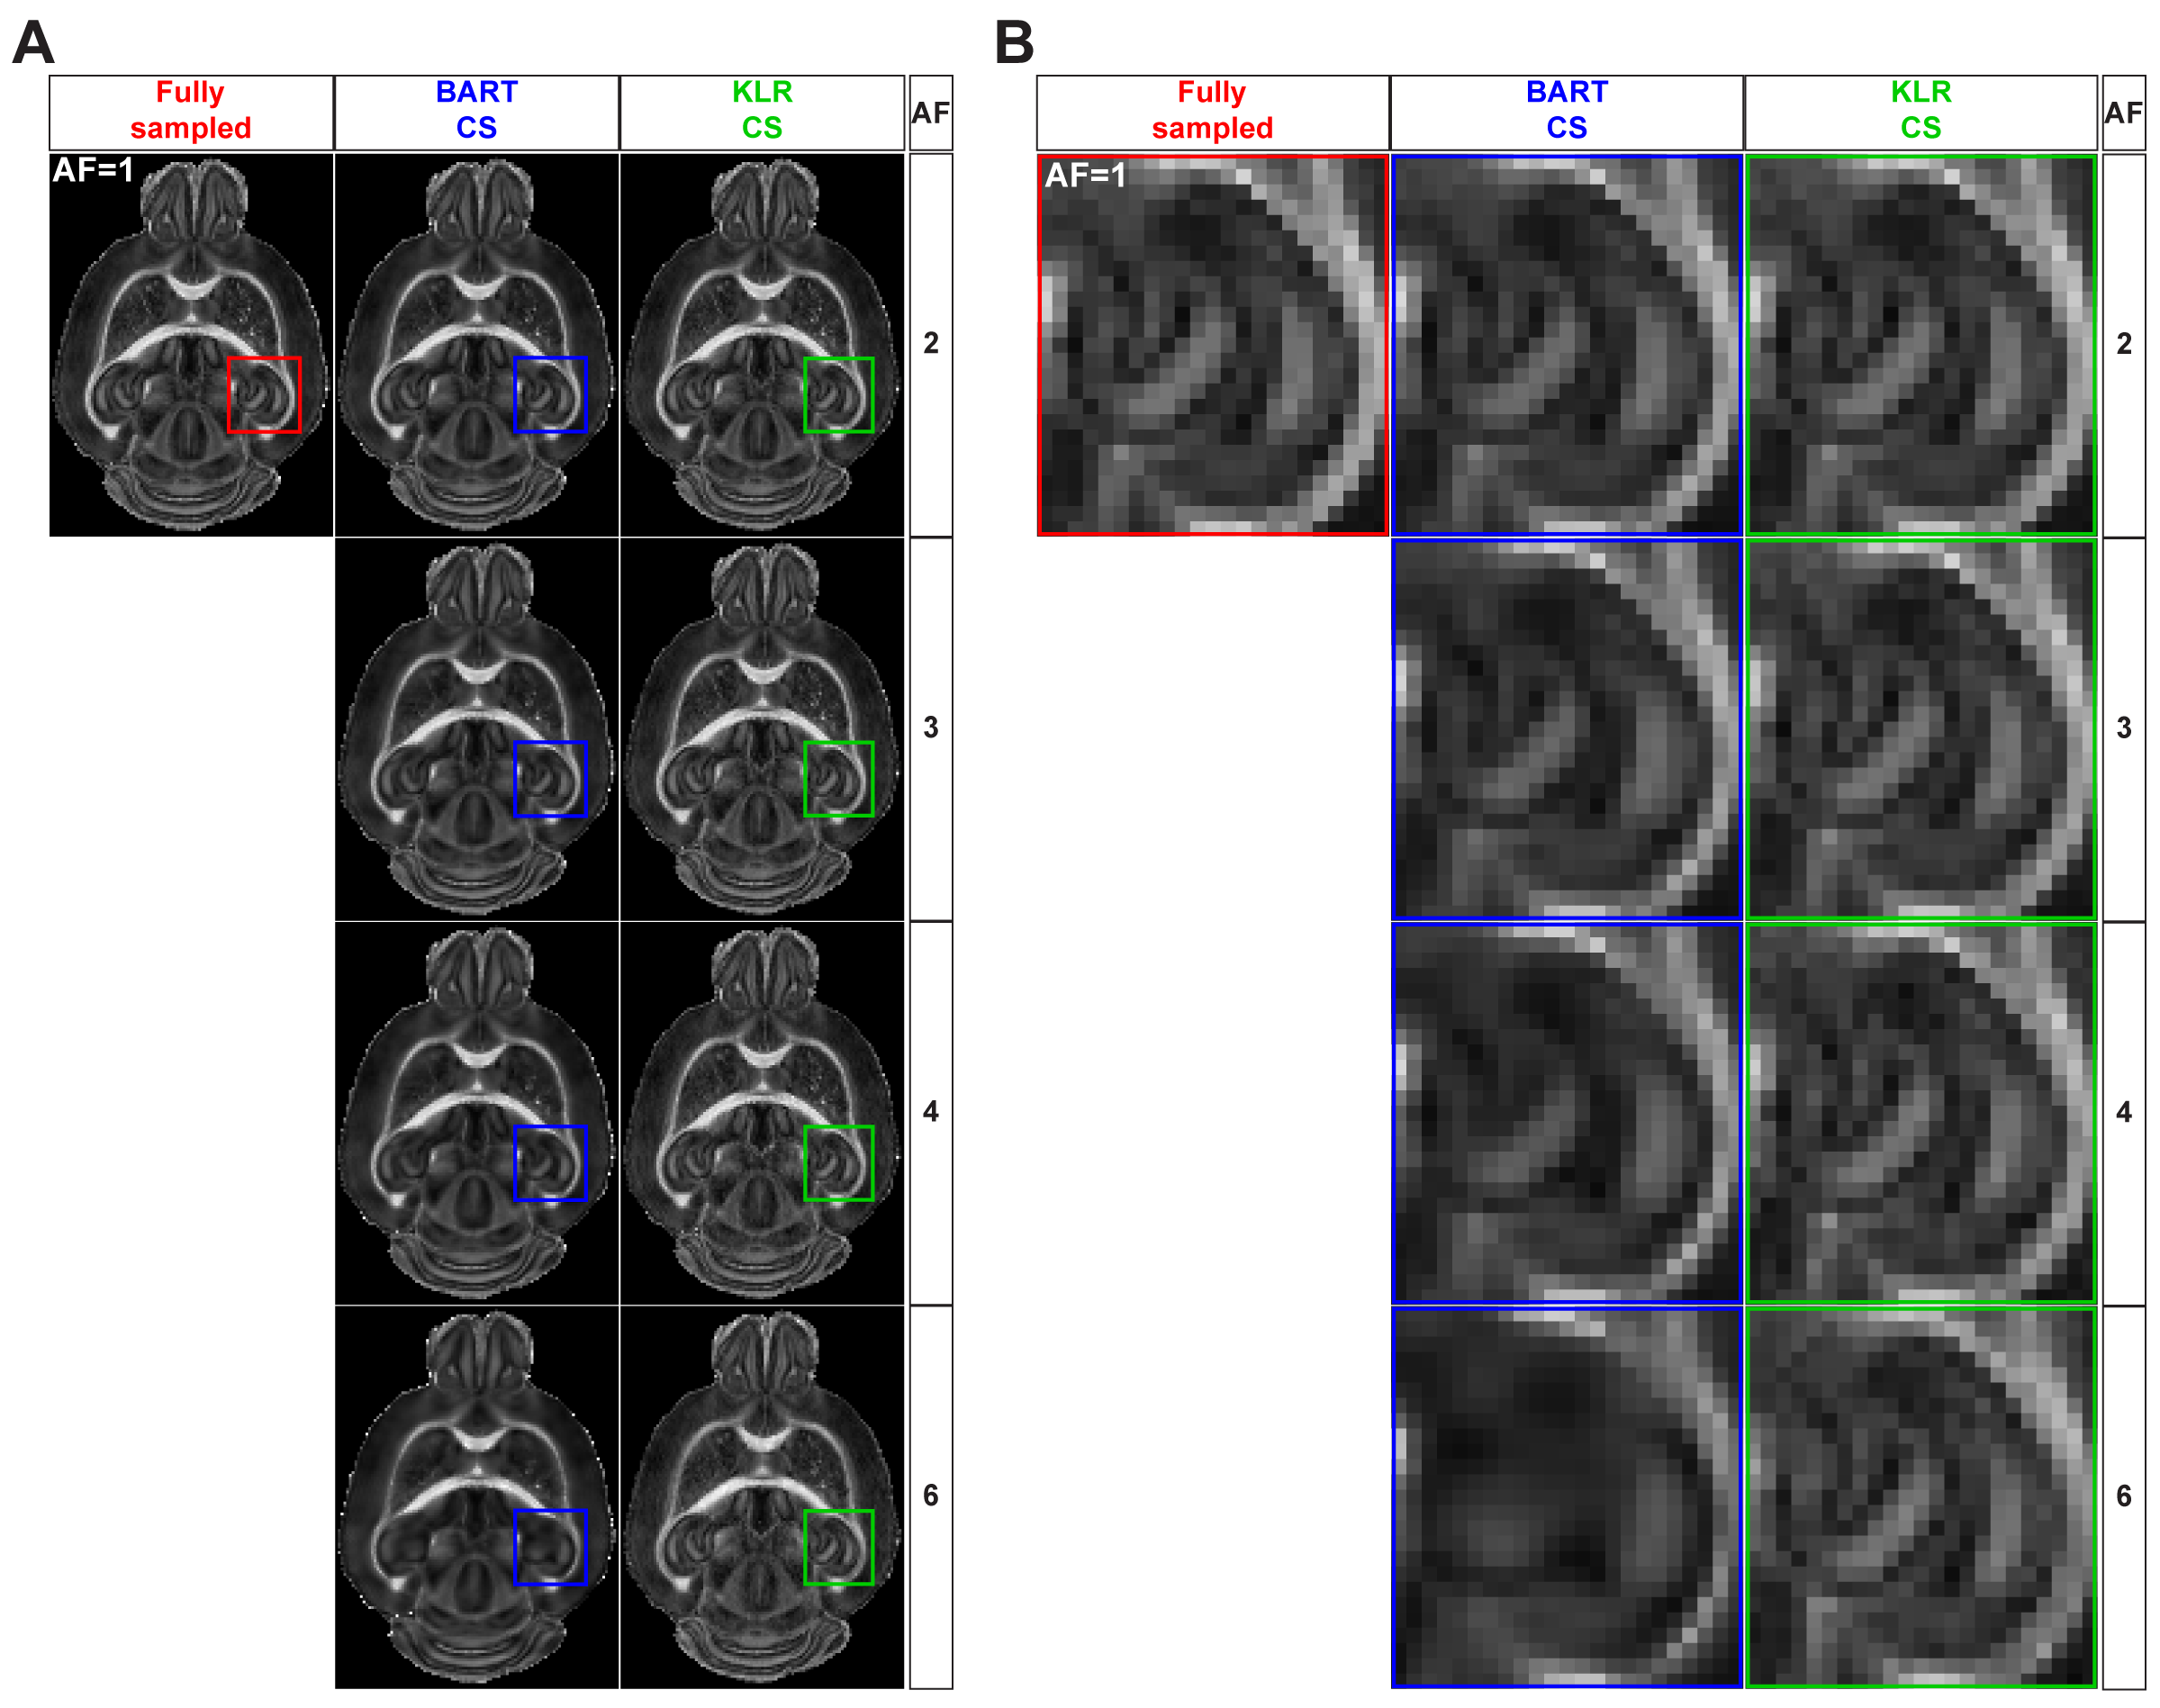
BART was chosen for Conventional CS after comparisons to SparseMRI11 and zero-padding reconstructions of anatomical data (not discussed here), reaching 2.01, 9.23 and 8.03% of median absolute error and 0.961, 0.903 and 0.674 of SSIM, respectively; being BART superior thanks to coil sensitivity maps calculated by ESPIRiT9 algorithm. In a second step, the undersampling pattern for k-space was optimized by analyzing all possible combinations (Poisson-disc/Monte Carlo with fully/undersampled b=0s/mm2 in mono and multi-mask modes) over different AFs, where absolute error and SSIM of FA and MD maps reconstructed by KLR and BART CS were compared (not shown here). Monte Carlo with fully sampled b=0s/mm2 images in multi-mask mode obtained the best overall performance and was thereafter utilized for all subsequent evaluations. Examples of Poisson-disc and Monte Carlo undersampling patterns in multi-mask mode are shown in Fig.1. Finally, BART and KLR CS were compared using the optimized undersampling pattern. Fig.2 shows examples of BART and KLR CS reconstructions of FA maps from WT mice, as a function of AF. As shown in Fig.3, an increase in error together with a decrease in SSIM may readily be observed, as AF increases. Overall, KLR CS reconstructions lead to smaller errors and higher SSIM than BART, whatever the AF. For instance, with AF=2, CS reconstructions by BART and KLR CS reach a median error of 5.62 and 2.41% and SSIM of 0.976 and 0.991, respectively. In addition, tractographies of the anterior commissure of WT and MAP6+/- under different AFs are shown in Fig.4. KLR CS tends to be more robust under higher AFs, since BART CS misses the anterior part of the anterior commissure (Fig.4A,B) and mean fiber length differs significantly for MAP6+/- mice under AF=6 (Fig.4C). For AF=2,3 and 4, both methods showed similar performances for both WT and MAP6+/- mice, regarding the set of chosen parameters. Overall, KLR CS performed better than BART CS, also when analyzing MD maps (not shown here) and several tracts under high AFs, such as the fornix (not shown here).Conclusions
At the preclinical level, acceleration techniques have barely entered the field, in part due to the type of receive coils (limited number of channels, surface only). Regarding Compressed Sensing, existing evaluations are based on single-receiver acquisition and do not include parallel imaging. Concerning diffusion MRI, KLR overcame BART CS due the addition of a q-space constraint over the joint reconstruction, taking advantage of different undersampling patterns for each 3D volume of the diffusion directions, while BART CS only relies on sparsity constraint. We are currently evaluating the outcomes of an in-house KLR CS acquisition sequence for Paravision©7. As observed in human studies, higher AF could be obtained when using a higher spatial resolution than the one used in this study12. Beyond this first acceleration step, further work is required to evaluate the combination of CS with parallel imaging13. Additional CS reconstruction techniques could also be evaluated, such as deep learning based CS14.Acknowledgements
Grenoble MRI facility IRMaGe was partly funded by the French program “Investissement d’Avenir” run by the ‘Agence Nationale pour la Recherche’; grant 'Infrastructure d’avenir en Biologie Santé' - ANR-11-INBS-0006.
We are particularly grateful to Dr. Leslie Ying, Ukash Nakarmi and Chaoyi Zhang at University of New York at Buffalo, for their toolbox for KLR Compressed Sensing reconstruction and the support to handle it.
References
- Lustig M, Donoho D, Pauly J M. "Sparse MRI: The Application of Compressed Sensing for Rapid MR Imaging". Magnetic Resonance in Medicine (2007) 58:1182–11952.
- Ye JC. Compressed sensing MRI: a review from signal processing perspective. BMC biomed eng 1, 8 (2019). https://doi.org/10.1186/s42490-019-0006-z3.
- Wang N et al., Whole mouse brain structural connectomics magnetic resonance histology, Brain Structure and Function 2018;223:4323-43354.
- Zhang C et al. “Acceleration of three-dimensional diffusion magnetic resonance imaging using a kernel low-rank compressed sensing method”, NeuroImage 210 (2020) 1165845.
- Nakarmi U et al. “A Kernel-Based Low-Rank (KLR) Model for Low-Dimensional Manifold Recovery in Highly Accelerated Dynamic MRI”. IEEE Trans Med Imaging 36, 2297–2307. https://doi.org/10.1109/TMI.2017.27238716.
- Uecker M et al., Berkeley Advanced Reconstruction Toolbox, Proc. ISMRM 2015;23:24867.
- BART Toolbox for Computational Magnetic Resonance Imaging, doi: 10.5281/zenodo.39343128.
- Mitchell SA, Rand A, Ebeida MS, Bajaj C., "Variable Radii Poisson-Disk Sampling". CCCG 2012, Charlottetown, P.E.I., August 8–10, 20129.
- Uecker M, Lai P, Murphy MJ , Virtue P, Elad M, Pauly JM, Vasanawala SS, Lustig M, "ESPIRiT – An Eigenvalue Approach to Autocalibrating Parallel MRI: Where SENSE meets GRAPPA", Magnetic Resonance in Medicine. 2014 Mar; 71(3):990-1001. doi: 10.1002/mrm.2475110.
- MRtrix3. https://www.mrtrix.org. Accessed November 10, 202111.
- Sparse MRI. https://people.eecs.berkeley.edu/~mlustig/software/sparseMRI_v0.2.tar.gz Accessed December 15, 202112.
- Lazarus C, et al. "SPARKLING: variable‐density k‐space filling curves for accelerated T2*‐weighted MRI." Magnetic resonance in medicine 81.6 (2019): 3643-3661.13.
- Jin KH, Lee D, Ye JC. A general framework for compressed sensing and parallel MRI using annihilating filter based low-rank Hankel matrix. IEEE Trans Computational Imag. 2016;2(4):480–9514.
- Blumenthal M and Uecker M. Deep, Deep Learning with BART. ISMRM Annual Meeting 2021, In Proc. Intl. Soc. Mag. Reson. Med. 29;1754 (2021)
Figures