2337
Estimating Hemodynamic Response Function Using Simultaneous fMRI and Calcium Recording1Queensland Brain Institute, The University of Queensland, Brisbane, Australia
Synopsis
· Evoked BOLD and calcium signals were recorded in the visual pathway using standard (TR=1s) and ultrafast (TR=0.3s) EPI of two TEs.
· Hemodynamic response function was estimated based on neuronal calcium activity. HRF estimated from ultrafast fMRI shows faster kinetics in the lateral geniculate nucleus than the visual cortex.
· BOLD signal was predicted from calcium signal convoluted by HRF. Using ultrafast fMRI significantly improved the accuracy of the predicted BOLD.
Introduction
Several studies have investigated the regional variation of hemodynamic response function (HRF) in both human [1–4] and animals [5–8]. However, modelling of the HRF is often done without any neural recording and based on simplified assumption that neural activity has a boxcar shape following the stimulation paradigm. In this study, we used simultaneous fMRI and calcium recording to estimate the HRF directly from neuronal activity and compare the variations in different brain regions. Although HRF is conventionally regarded as slow with most kinetics within 0.5Hz, we hypothesized that ultrafast fMRI could detect fast dynamics and improve the estimation of HRF.Methods
Experiments were approved by the animal ethics committee of the University of Queensland. We injected AAV-hSyn-GCaMP6f into the visual cortex (V1) and lateral genicular nucleus (LGd) of 8-10 weeks old C57BL6/J mice (n=5). Two optic fiber (60µm diameter) cannulas were implanted and secured with dental cement. 4 weeks after surgery, simultaneous calcium recording (Neurophotometric, USA) and fMRI (9.4T, Bruker BioSpin) were done under anaesthesia with 0.1mg/kg/h medetomidine and 0.1-0.3% isoflurane and visual stimuli of 3s duration, 5Hz, 12s intervals, and 15trials. Calcium signal was recorded by alternating excitation (470nm) and reference (410nm) lights with frame rate of 20Hz (10Hz for each channel).Four fMRI protocols with two different TR and TE were compared: conventional single-band gradient-echo echo-planar imaging (SB-EPI) acquired at TR=1s; ultrafast multi-band EPI [9] (MB-EPI) with TR=0.3s. TE of 10ms and 15ms was acquired for both sequences. fMRI processing was done using FSL, AFNI, and MATLAB and p<0.05 was regarded as significant. Calcium signal was detrend and regressed by the reference light. BOLD time-courses were obtained by drawing 3×3 voxels ROIs in two slices over the targeted areas. The functional contrast-to-noise ratio (CNR) was calculated as the mean BOLD signal change over the 3s visual stimulation duration, with a 2s delay accounting for vascular response, divided by the standard deviation of the 12s baseline before the stimulation. HRFs were estimated using a non-linear optimization method by convolving a gamma variate function with the calcium signal. BOLD signal was up-sampled to match the sampling rate of calcium signal. Four of five animals were used to calculate the averaged signals and model the HRFs, and the data from the fifth animal was used to test the prediction performance of the HRFs. The predicted and measured BOLD signals were normalized to the maximum of the time course and then compared using correlation coefficient (CC) and mean square error (MSE). The difference between protocols was tested by paired t-test.
Results
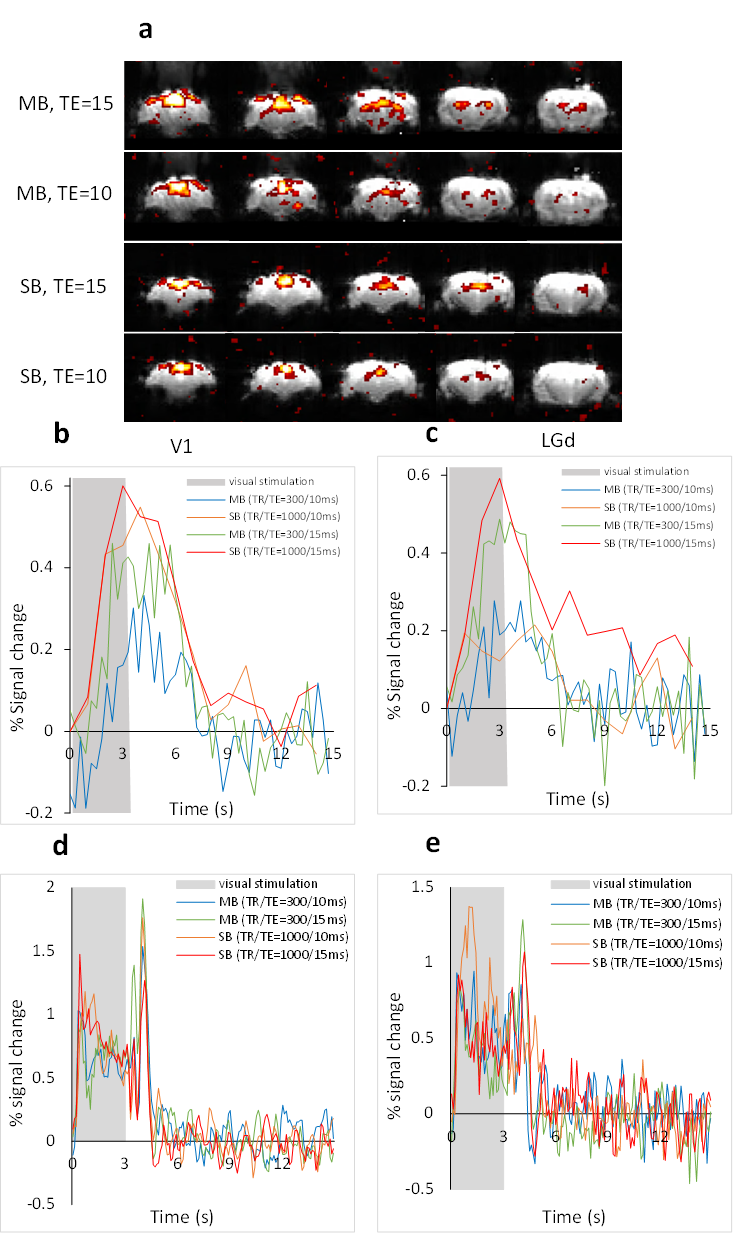
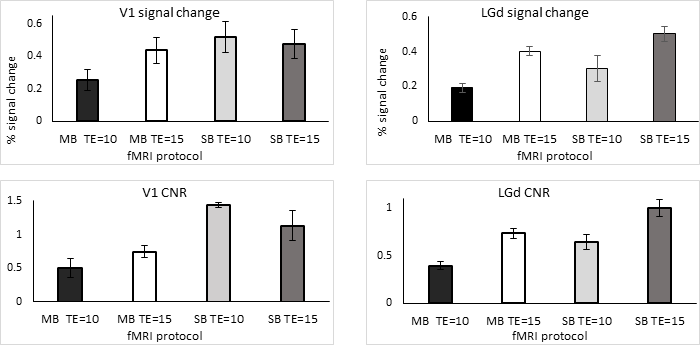
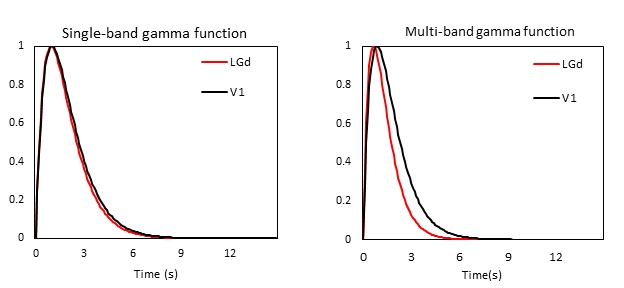
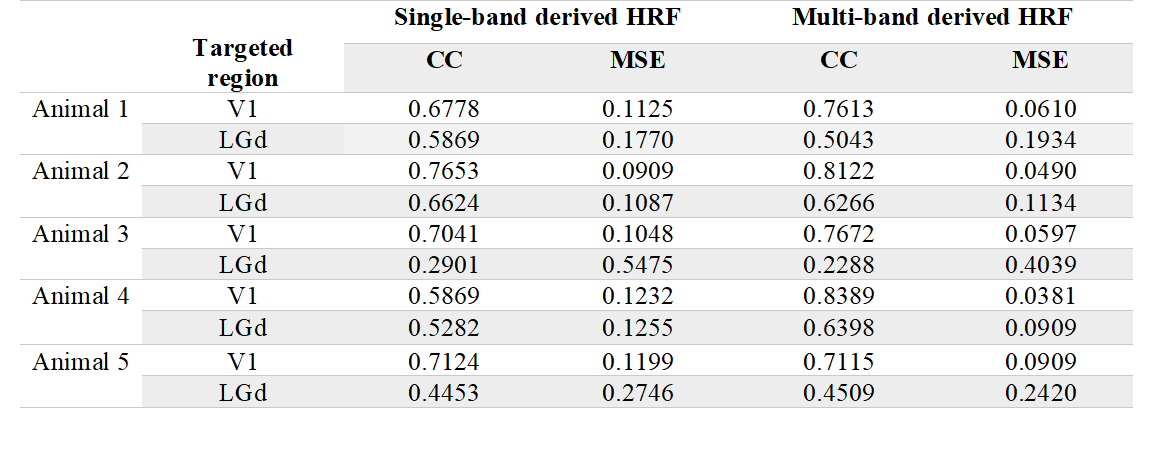
Strong BOLD activation in the visual pathways was detected using all 4 protocols (Fig.1a). The averaged BOLD signals of the MB-EPI show more detailed dynamics in V1 and LGd (Fig.1b, c) whereas the calcium signals are similar (Fig.1d, e). Based on better CNR (Fig.2), we selected the MB-EPI with TE=15ms over TE=10ms. However, changing the TE in SB-EPI sequence did not have a consistent effect on the CNR; so, TE=15ms was selected. Calculated HRFs (Fig.3) were similar in the cortical (V1) and subcortical (LGd) areas. However, the HRF in the LGd estimated by ultra-fast fMRI was faster than that in the V1. Table.1 shows that the MB-EPI HRF generally has a better prediction performance and in V1 this improvement is statistically significant for both CC (t=-2.4, p=0.0206) and MSE (t=4.8, p=0.0006). Also, prediction performance is higher for V1 area which could be due to more reliable recordings for both BOLD and calcium from this region.Discussion
Because of residual susceptibility artifact induced by the fiber cannula and dental cement on EPI at ultrahigh field, we acquired data with a short TE of 10ms. Theoretically, shorter TE has weaker BOLD signal but improved susceptibility artifact. However, the shorter TE did not consistently and significantly improve CNR (Fig.2). This could be due to regionally different optimal TE [10] or difference in the susceptibility-induced through-slice dephasing effect [11] . We found very similar HRFs in V1 and LGd using 1s temporal resolution, but faster HRF in LGd using 0.3s temporal resolution with a time to peak of 0.1s faster for LGd HRF than V1 HRF (Fig.3). Tong et al [12] demonstrated a similar result (regional dependence of HRF) in rat brain that HRF in SC has a 0.2s faster time to peak than that in LGd. The higher sampling rate also improved the accuracy of predicted BOLD (Table.1). In summary, our results showed decreasing TE from 15ms to 10ms did not improve BOLD CNR consistently. Estimating HRFs using ultrafast fMRI resulted in more accurate prediction of BOLD signal from calcium signal. Therefore, ultrafast fMRI is beneficial for detecting faster hemodynamics.Acknowledgements
No acknowledgement found.References
[1] D. A. Handwerker, J. Gonzalez-Castillo, M. D’Esposito, and P. A. Bandettini, “The continuing challenge of understanding and modeling hemodynamic variation in fMRI,” Neuroimage, vol. 62, no. 2, pp. 1017–1023, 2012.
[2] D. A. Handwerker, J. M. Ollinger, and M. D’Esposito, “Variation of BOLD hemodynamic responses across subjects and brain regions and their effects on statistical analyses,” Neuroimage, vol. 21, no. 4, pp. 1639–1651, 2004.
[3] S. Heinzel, F. B. Haeussinger, T. Hahn, A. C. Ehlis, M. M. Plichta, and A. J. Fallgatter, “Variability of (functional) hemodynamics as measured with simultaneous fNIRS and fMRI during intertemporal choice,” Neuroimage, vol. 71, pp. 125–134, 2013.
[4] G. K. Aguirre, E. Zarahn, and M. D. Esposito, “<Aguirre-1998-The variability of human, BOLD he.pdf>,” Neuroimage, vol. 369, no. 8, pp. 360–369, 1998.
[5] H. Lambers, M. Segeroth, F. Albers, L. Wachsmuth, T. M. van Alst, and C. Faber, “A cortical rat hemodynamic response function for improved detection of BOLD activation under common experimental conditions,” Neuroimage, vol. 208, no. November 2019, p. 116446, 2020.
[6] M. C. Murphy, K. C. Chan, S. G. Kim, and A. L. Vazquez, “Macroscale variation in resting-state neuronal activity and connectivity assessed by simultaneous calcium imaging, hemodynamic imaging and electrophysiology,” Neuroimage, vol. 169, no. June 2017, pp. 352–362, 2018.
[7] F. Schlegel et al., “Fiber-optic implant for simultaneous fluorescence-based calcium recordings and BOLD fMRI in mice,” Nat. Protoc., vol. 13, no. 5, pp. 840–855, 2018.
[8] F. Schlegel, A. Schroeter, and M. Rudin, “The hemodynamic response to somatosensory stimulation in mice depends on the anesthetic used: Implications on analysis of mouse fMRI data,” Neuroimage, vol. 116, pp. 40–49, 2015.
[9] H. L. Lee, Z. Li, E. J. Coulson, and K. H. Chuang, “Ultrafast fMRI of the rodent brain using simultaneous multi-slice EPI,” Neuroimage, vol. 195, no. March, pp. 48–58, 2019.
[10] T. Boursianis et al., “The significance of echo time in fmri bold contrast: A clinical study during motor and visual activation tasks at 1.5 t,” Tomography, vol. 7, no. 3, pp. 333–343, 2021.
[11] S. Clare, S. Francis, P. G. Morris, and R. Bowtell, “Single-shot T2* Measurement to establish optimum echo time for fMRI: Studies of the visual, motor, and auditory cortices at 3.0 T,” Magn. Reson. Med., vol. 45, no. 5, pp. 930–933, 2001.
[12] C. Tong, J. Dai, Y. Chen, K. Zhang, Y. Feng, and Z. Liang, “Differential coupling between subcortical calcium and BOLD signals during evoked and resting state through simultaneous calcium fiber photometry and fMRI,” Neuroimage, 2019.
Figures