2336
Evaluating ultra-short echo time (UTE) cerebral blood volume (CBV)-based fMRI using an iron-oxide contrast agent in mouse visual cortex at 9.4T1Centre for Advanced Imaging, St. Lucia, Australia, 2Athinoula A. Martinos Center for Biomedical Imaging, Massachusetts General Hospital, Charlestown, MA, United States, 3Department of Radiology, Harvard Medical School, Boston, MA, United States, 4Division of Health Sciences and Technology, Massachusetts Institute of Technology, Cambridge, MA, United States, 5Queensland Brain Institute, The University of Queensland, St. Lucia, Australia, 6School of Information Technology and Electrical Engineering, St. Lucia, Australia, 7ARC Centre for Innovation in Biomedical Imaging and Technology, The University of Queensland, St. lucia, Australia
Synopsis
CBV-based fMRI has been demonstrated to have better spatial specificity than BOLD. CBV estimates based on iron-oxide contrast agents (CA) reflect this microvascular sensitivity, however because of strong extravascular dephasing CBV changes within large vessels are more difficult to detect. Here, we measured functional CBV changes after injecting CA with UTE-MRI and found positive signal changes (+0.5%) predominantly localized at large vessels at a TE of 0.164ms, and negative signal changes (-2%) at a TE of 4ms localized within the tissue. This indicates sensitivity to different vascular compartments at different TEs reflecting the respective T1 and T2* effects of CA.
Introduction
All functional MRI signals currently in use infer neural activity through tracking the associated hemodynamic changes – often using the blood-oxygenation-level-dependent (BOLD) contrast. While BOLD provides highest sensitivity, it has poor specificity due to the strong influence of large draining veins. Studies using iron-oxide contrast agents (CA) have shown that cerebral blood volume (CBV) fMRI provides improved specificity due to its weighting towards the microvasculature1. These CAs shorten the T2* of blood, effectively nulling the blood signal. It has been suggested that contrast-based CBV achieves its sensitivity to microvessels in part due to strong extravascular dephasing in the largest vessels (arteries and veins) on the cortical surface 1, which occurs when using strong T2*-weighted acquisitions such as EPI and long-TE GRE. Here we test whether removing this dephasing affects the origin of contrast based CBV fMRI. We achieve this through the use of ultra-short echo time (UTE) imaging 2,3, which removes this dephasing 4 and exploits the T1-shortening of these iron-oxide-based CAs. While similar methods have been employed for vascular imaging3, here we apply them to characterize the CBV response elicited by task-based functional activation. To ensure that our UTE sequence effectively removes the unwanted extravascular effects, we compare the activation patterns over a wide range of echo times and use this to investigate CBV changes in different vascular compartments.Methods
Experimental Setup and Animal PreparationPrior to experiments, approvals were obtained from the institutional animal ethics committee. Imaging of five C57BL/6J mice was performed on a 9.4T preclinical MRI (Bruker Biospec, Ettlingen, Germany) with an 86-mm volume coil for signal transmission and a custom-made 10mm ellipsoid surface coil for signal reception. Mice were injected intravenously with ~29.2 mg/Kg contrast agent (Molday ION, make: BioPAL,Inc) diluted to 5 Fe mg/ml. Mice were sedated under 0.2–0.5% isoflurane with a medetomidine bolus of 0.05 mg/Kg and constant infusion maintained at 0.1 mg/kg/h via IP. Physiological monitoring included temperature, heart rate, SpO2 and respiration.
Structural Imaging
Structural images were acquired using standard T2 TurboRARE sequence with resolution of 0.1×0.1×0.25 mm3 (3 averages). For vascular imaging, a radial trajectory-based UTE 3D sequence was utilized with TE=0.013 ms and an isotropic resolution of 0.1 mm.
Functional Imaging
Five runs of functional MRI data were acquired with a resolution of 0.2×0.2×0.5 mm3, 0.1 mm slice gap, a volume TR of 3s and 150 volumes per run with 5 different TEs [from 0.164 ms to 10 ms]. For TEs of 0.164ms, 0.5ms, and 1ms we used a similar 2D UTE sequence limited to two slices to maintain adequate temporal resolution. For TEs 4ms and 10ms we used a standard FLASH sequence either with 8 (at TE=4 ms) or 4 (at TE=10 ms) slices. The visual stimulus consisted of a blue flashing light with a frequency of 5 Hz in 7 blocks, with a 30s ON and 30s OFF duration with an initial rest of 30s. The fMRI activation of the first functional run (TE=4 ms) was used as an online functional localizer to guide accurate slice positioning (visual cortex and superior colliculus) for consecutive runs. All functional data were analyzed using FEAT (FMRI Expert Analysis Tool) v6.00 (FSL, www.fmrib.ox.ac.uk/fsl) including motion correction, smoothing (0.6x0.6x0.6 mm3) and GLM fitting. The resulting z-maps were thresholded using Z>2.3 and a cluster threshold of P=0.05 [Worsley 2001]).
Results
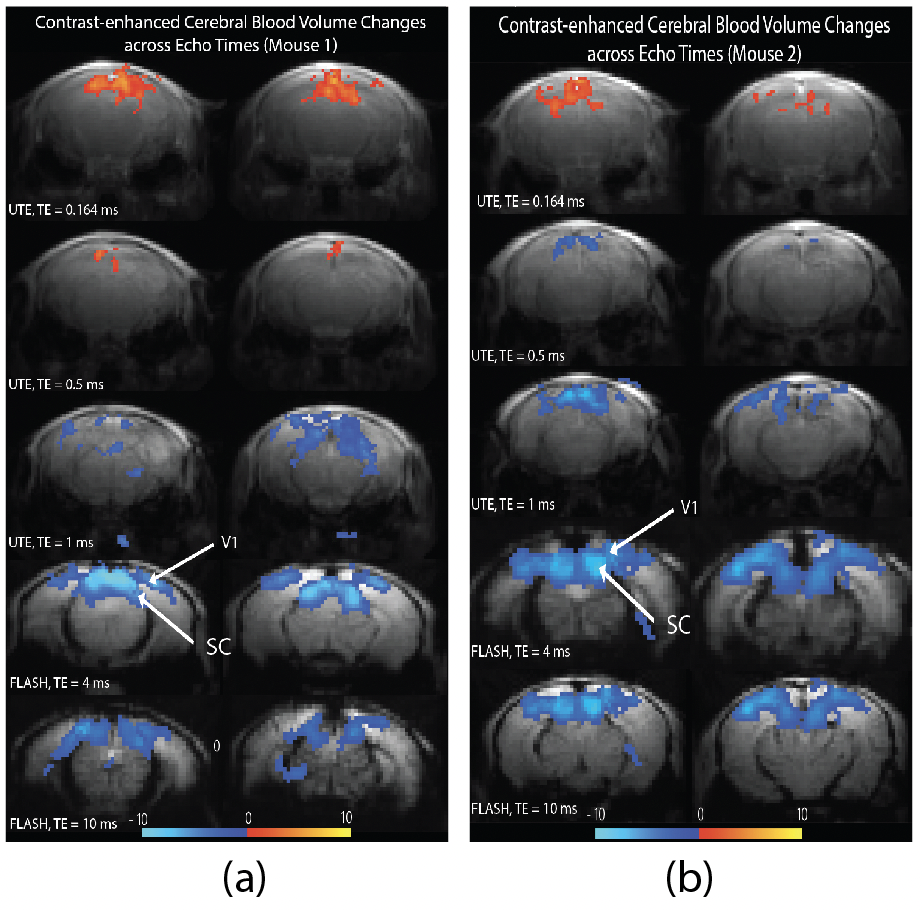
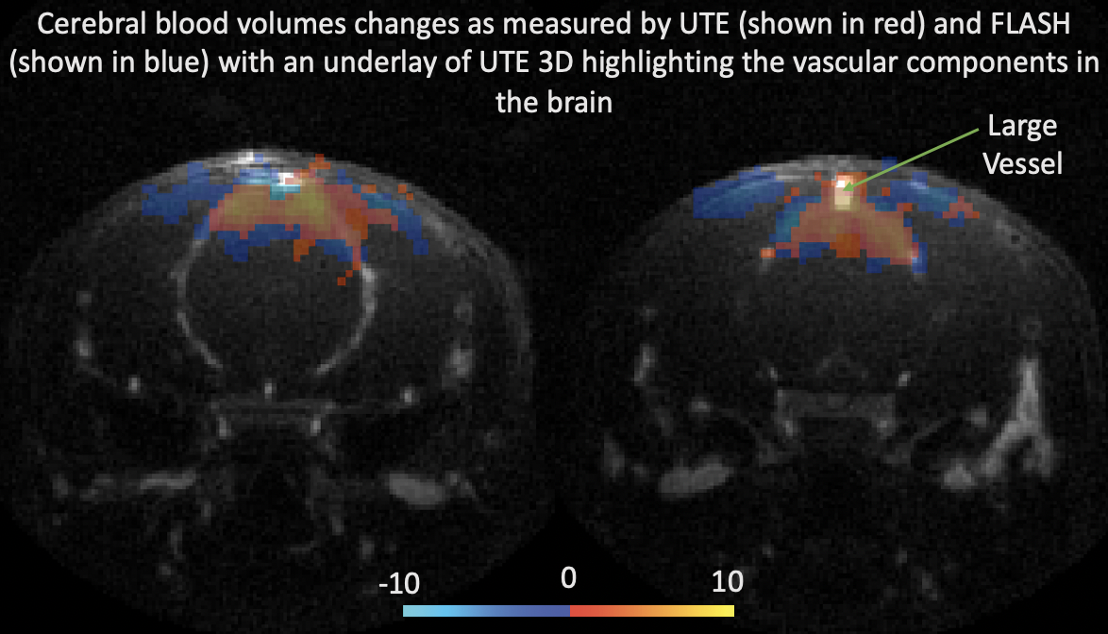
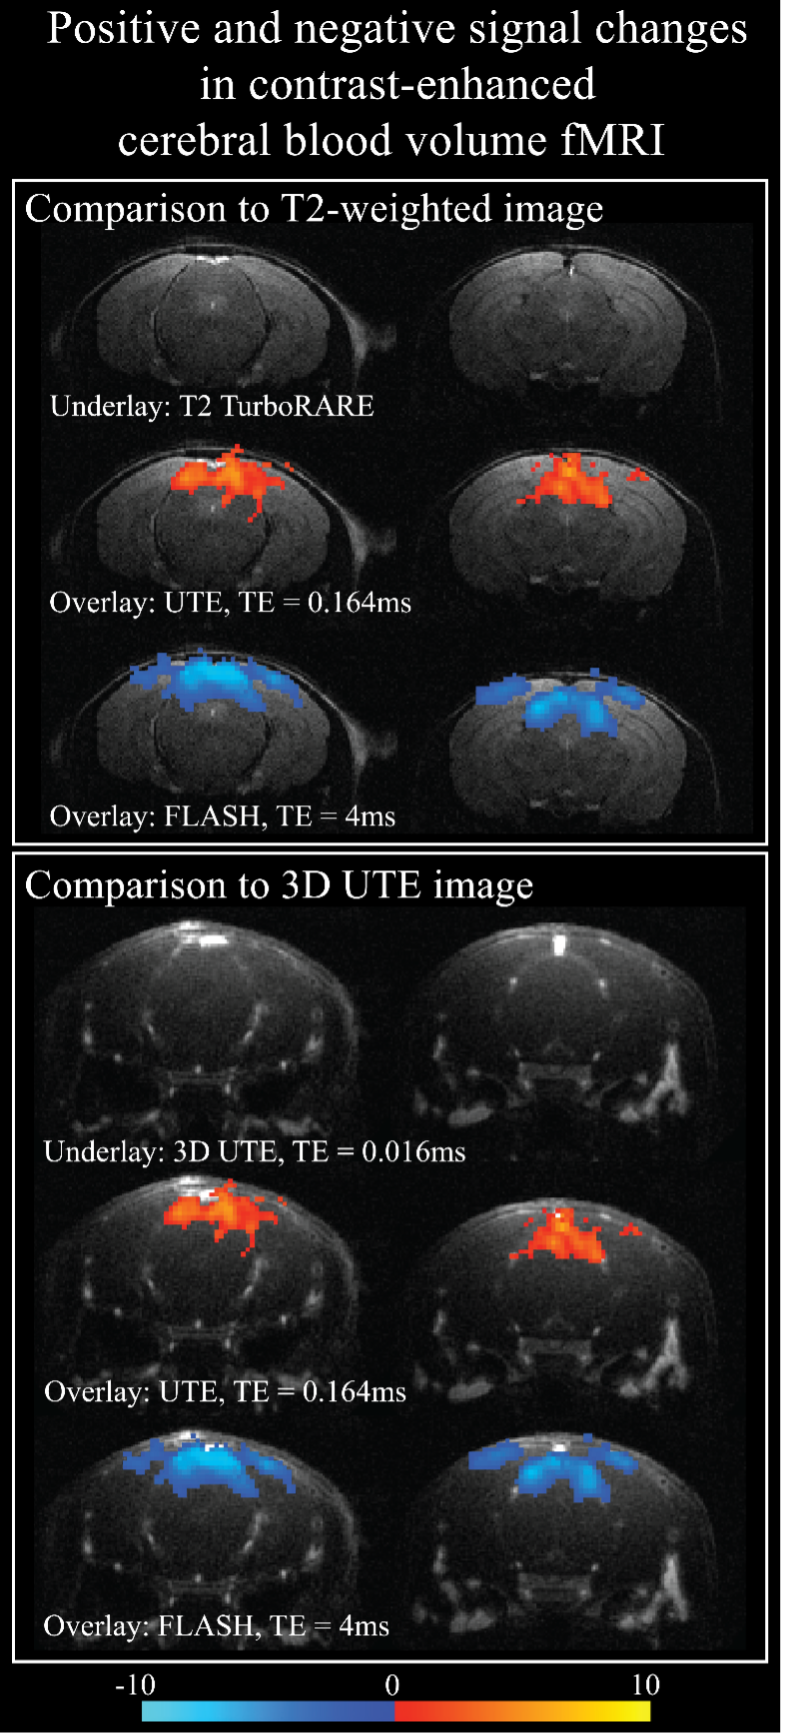
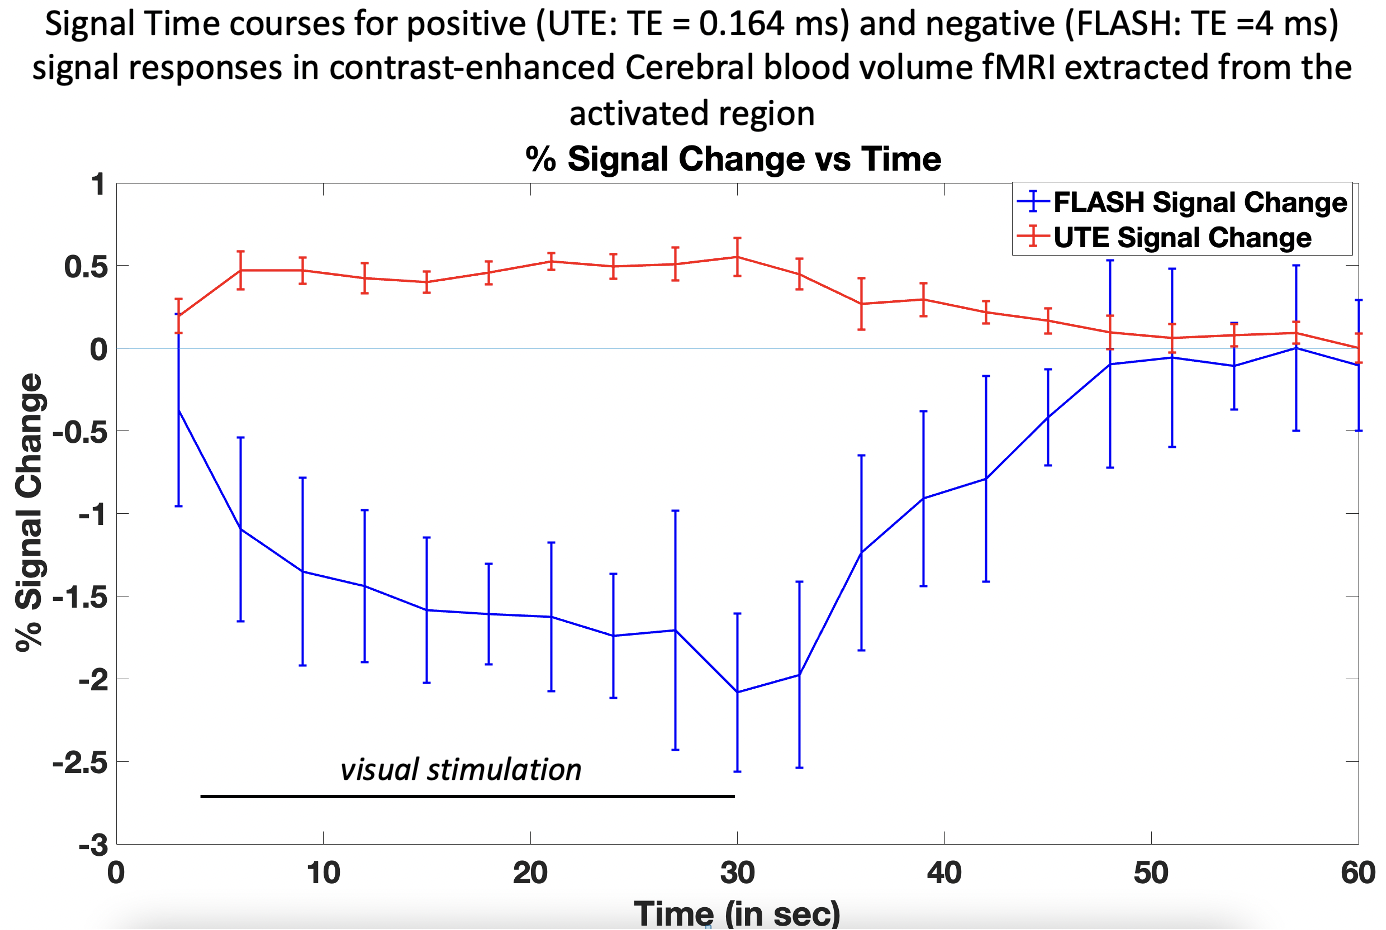
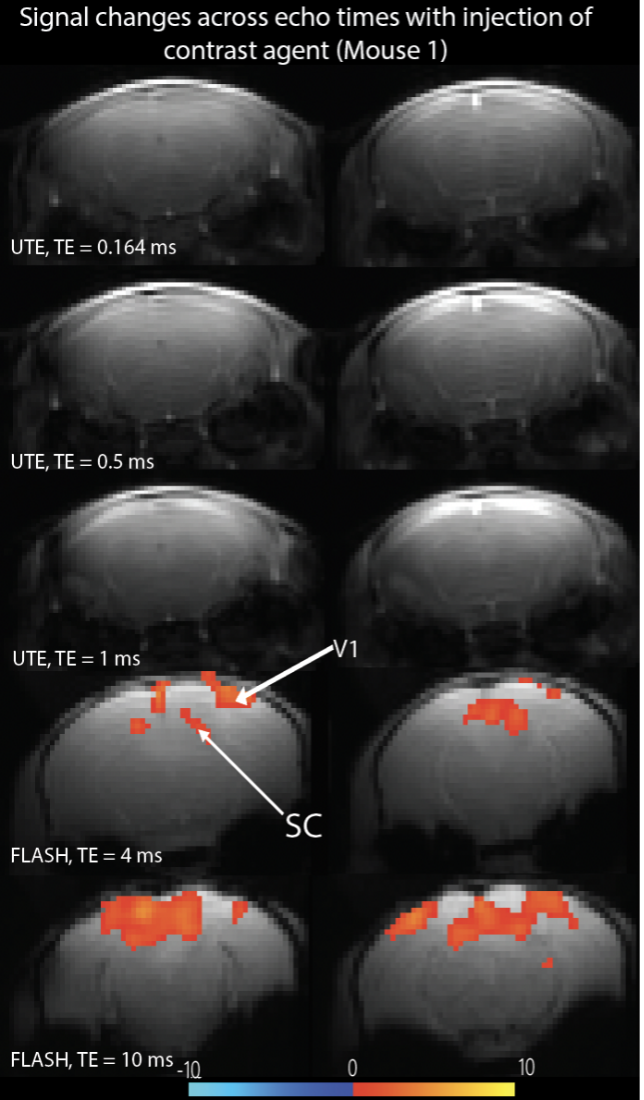
Figure 1 show activation maps from two mice across 5 different echo times, with positive signal changes mainly found at the shortest echo time – indicating T1 weighting – that were localized in and around large vessels, and negative signal changes found at the three longest echo times – indicating the dominant T2* weighting – localized more in the tissue within cortical areas (see overlays on structural T2-weighted and 3D UTE, Figures 1-3). Signal time courses indicate larger percent-signal change for CE-CBV fMRI at later echo times, but similar response timings for positive and negative changes (Figure 4). Figure 5 shows the results of a control experiment with an identical acquisition but with no contrast agent administered.Discussion and Conclusion
Our CE-CBV results show positive signal changes for ultra-short TE, and negative signal changes for longer TE, in line with the T1- and T2*-weighting provided by iron-oxide CAs2. The activation clusters were more widespread for the later echo times, but co-localized with large vessels for the shortest echo time, indicating distinct sensitivity to different vascular compartments at different echo times.A potential confound in the UTE data is inflow from outside the FOV. Although we could not detect a signal change in the no-CA condition (Figure 5), the shortening of the T1 relaxation time through CA5 could enhance inflow effects. Future work will include simulations using measured T1 values and inflow modelling, taking into account the expected flow rates in different vascular compartments, which will allow estimation of their respective contributions.
In conclusion, these experiments might offer additional insight into the involvement of different vascular compartments in fMRI and provide valuable information for comprehensive vascular models of hemodynamic responses6,7, which also need to account for potential CBV changes in large supplying and draining vessels.
Acknowledgements
The authors acknowledge funding by NHMRC-NIH BRAIN Initiative Collaborative Research Grant APP1117020 and by the NIH NIMH BRAIN Initiative grant R01-MH111419. The authors would also like to acknowledge the veterinary support provided by Dr. Heidi-Niland Rowe, Veterinary Officer, University of Queensland and animal technical support provided by Ms. Barb Arnts, Animal Technician, University of Queensland. Also, we would like to thank Dr. Nyoman Kurniawan who helped modify the UTE sequence to make it compatible with the visual stimulation.References
1. Mandeville, J.B. & Marota, J.J.A. Vascular filters of functional MRI: Spatial localization using BOLD and CBV contrast. Magnetic Resonance in Medicine 42, 591-598 (1999).
2. Gharagouzloo, C.A., McMahon, P.N. & Sridhar, S. Quantitative contrast-enhanced MRI with superparamagnetic nanoparticles using ultrashort time-to-echo pulse sequences. Magn Reson Med 74, 431-441 (2015).
3. Gharagouzloo, C.A., et al. Quantitative vascular neuroimaging of the rat brain using superparamagnetic nanoparticles: New insights on vascular organization and brain function. Neuroimage 163, 24-33 (2017).
4. Girard, O.M., et al. Optimization of iron oxide nanoparticle detection using ultrashort echo time pulse sequences: comparison of T1, T2*, and synergistic T1- T2* contrast mechanisms. Magn Reson Med 65, 1649-1660 (2011).
5. Xiao, Y.D., et al. MRI contrast agents: Classification and application (Review). International Journal of Molecular Medicine 38, 1319-1326 (2016).
6. Gagnon, L., et al. Quantifying the Microvascular Origin of BOLD-fMRI from First Principles with Two-Photon Microscopy and an Oxygen-Sensitive Nanoprobe. The Journal of Neuroscience 35, 3663-3675 (2015).
7. Cheng, X., et al. Dependence of the MR signal on the magnetic susceptibility of blood studied with models based on real microvascular networks. Magnetic Resonance in Medicine 81, 3865-3874 (2019).
Figures