2335
Choroid plexus tissue perfusion and blood to CSF barrier function (BCSFB) in rats measured with continuous arterial spin labeling1Anesthesiology, Yale School of Medicine, New Haven, CT, United States, 2Centre for Clinical Brain Sciences, University of Edinburgh, Edinburgh, United Kingdom, 3Medical Biophysics, University of Toronto, Toronto, ON, Canada, 4Radiology and Biomedical Imaging, Yale School of Medicine, New Haven, CT, United States
Synopsis
In this study choroid plexus tissue perfusion and blood to CSF barrier function in rats were studied using long and short TE continuous arterial spin labeling technique. Non-mono exponential perfusion weighted signal decay in the CP was modelled by a two-compartment perfusion model and we report that partial volume effect is significant and must be considered to derive accurate choroid plexus tissue perfusion measurements.
Introduction
Cerebral spinal fluid (CSF) homeostasis plays an important role for waste removal such as amyloid-beta and tau proteins from the brain [1]. Nearly 80% of CSF production is continuously being secreted by the choroid plexuses (CP) and CSF circulation within the central nervous system (CNS) is essential for glymphatic system function and immune surveillance [2, 3]. Recently, the ultra-long TE pulsed arterial spin labelling (ASL) imaging technique was implemented in mice to demonstrate evidence of blood to CSF barrier (BCSFB) mediated delivery of arterial blood water from the CP into ventricular CSF [4, 5]. This novel non-invasive approach is promising for studying BCSFB function, but the inherently poor signal to noise ratio (SNR) of the BCSFB measurements remains challenging. In this study, continuous ASL (CASL) was performed to enhance SNR and calculate BCSFB mediated water exchange, as well as CP tissue perfusion by incorporating short TE and then long TE CASL-based acquisition. A multi-compartment perfusion model was developed and here we report that partial volume correction is essential to derive accurate CP tissue perfusion measurements taken at short TE.Method
All imaging acquisitions were performed on a Bruker 9.4T/16 MRI equipped with a volume transmit/receive imaging coil interfaced with Paravision 6. A total of N=12 female Wistar Kyoto rats (9-12 months old) were scanned while anesthetized in pure isoflurane (2~2.5%) delivered with a 1:1 Air:O2 mixture breathing spontaneously [1, 6]. Multi-compartment T2 relaxometry: 2D single slice multi-spin multi-echo (MSME) sequence was performed using 80 evenly spaced echo times in the same position and image resolution as the CASL (TR=6000 ms, TE=10~800 ms, slice thickness = 1.0 mm). T2 distribution curves were calculated by means of the CONTIN algorithm [7]. T1 mapping: Longitudinal relaxation time (T1) was measured using a single shot EPI inversion recovery sequence as described previously [8] with the same position and image resolution as the CASL. CASL: A custom made single-turn actively decoupled arterial blood labeling coil was used. Single-shot single slice EPI sequence acquired images at short (23ms) and long (150ms) TE using following parameters: TR=7000 ms, TE=23 or 150 ms, in plane resolution = 0.45 mm/pixel, slice thickness = 1.0 mm, LD=3000 or 6000 ms taken at 9 PLDs. Blood magnetization at equilibrium, M0, was estimated using TR=20000 ms. Net CP tissue perfusion signals taken at short TE (23ms) was modelled as the sum of partial contribution from pure CP tissue perfusion and CASL taken at the long TE expressed as: $$f_{TE=23}=P_{CP}f_{CP}+(1-P_{CP})f_{TE=150} $$, where fTE=23, fCP, PCP, and fTE=150 represent apparent CP tissue perfusion taken at TE=23 ms, volume fraction of CP, pure CP tissue perfusion, and BCSFB mediated delivery of arterial blood water into ventricular CSF, respectively. Regions of interest in cortex (CTX) and CP were manually drawn onto the perfusion weighted images and a standard single compartment model [9] was implemented to calculate fTE=23 and fTE=150. PCP was estimated by extracting the ‘area under curve’, AUC, of T2 distribution curves, leaving only one unknown parameter fCP in the equation.Results
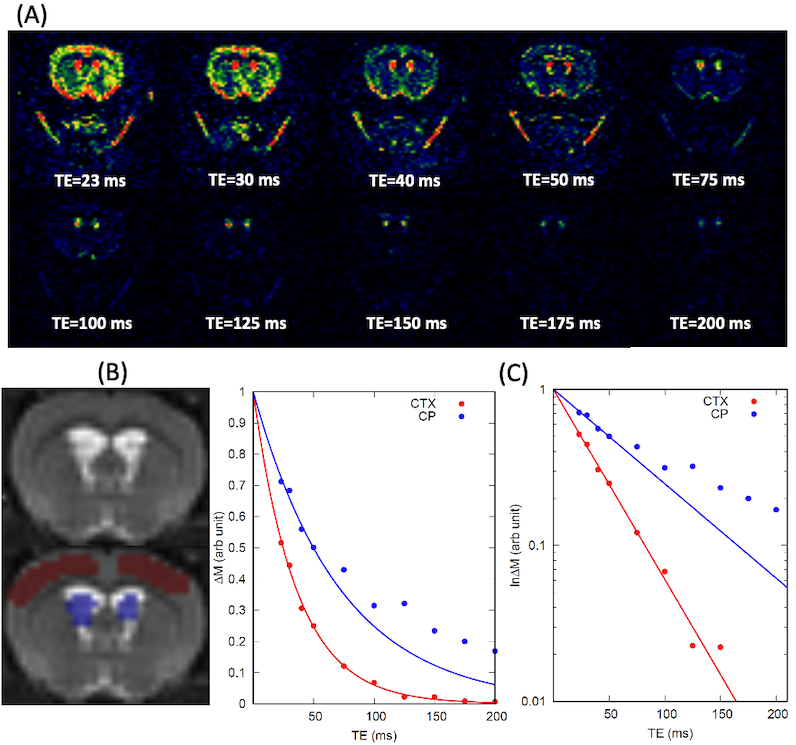
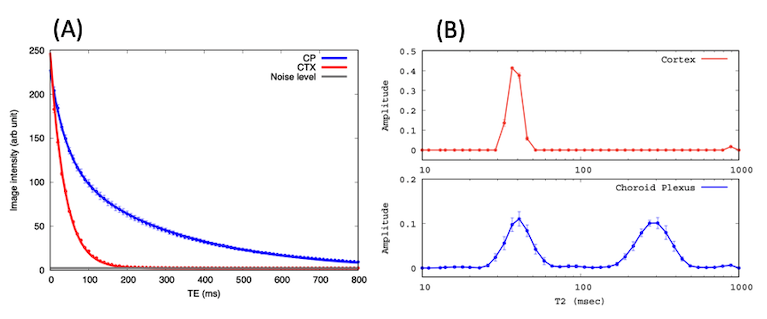
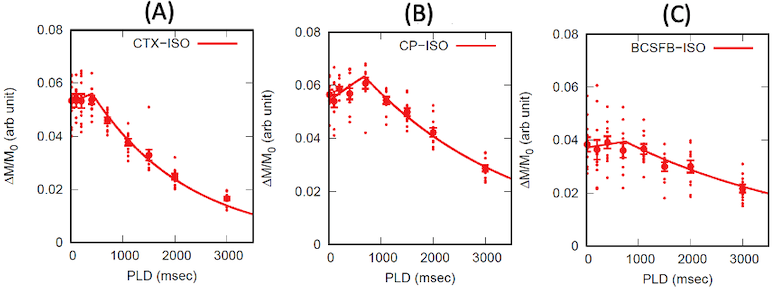
Representative perfusion weighted image intensities, ∆M, are shown in Fig.1 as a function of TEs. In the CTX, ∆M decays mono-exponentially even for the long TEs. However the inadequacy of the mono-exponential fit is discernible in the CP after TE=100 ms, implying multiple compartments exist within the CP region of interest. As shown in Fig.2, the population averaged T2 distribution curve from the CTX showed a unimodal profile with a peak at 38±0.3 ms indicative of a single tissue compartment. By contrast bimodal peaks were observed in the T2 distribution curve from the CP where short and long T2 peaks were detected at 42±1.4 ms and 304±4.9 ms, respectively. The short (41ms) and long (304ms) T2s were attributed to CP tissue and CSF, respectively, and the area under the distribution curve yielded the volume fraction of CP tissue to be PCP =0.46±0.02. Single compartment model fits of the data from all animals are shown in Fig.3. The apparent CP tissue perfusion, fTE=23, acquired at TE=23 and BCSFB ( fTE=150) were 183±5 ml/min/100g and 76±4 ml/min/100g, respectively. Arterial transit times (ATT), derived from the single compartment model, were 10% longer in the BCSFB (746±134 ms) than CP apparent perfusion (680±32 ms). Cortical perfusion and ATT were 164±5 ml/min/100g and 408±40 ms, respectively. Pure CP perfusion, fCP, was 313±14 ml/min/100g which is 91% higher than CTX perfusion and BCSFB was only 25% of the pure CP perfusion value.Conclusions
CASL sequence was performed to improve SNR in BCSFB and demonstrated as a promising approach to exploring CSF dynamics in vivo. Bimodal T2 distribution curves and non-mono exponential perfusion weighted signal decay in the CP implied substantial partial volume effects between CP tissue and CSF within the ROI. A two-compartment perfusion model was therefore implemented to derive pure CP tissue perfusion, which turned out to be substantially higher than the apparent CP tissue perfusion taken at short TE. Therefore, partial volume correction is essential to derive accurate CP tissue perfusion measurements.Acknowledgements
National Institutes of Health R01AT011419
PureTech Health
References
1. Tarasoff-Conway, J.M., et al., Clearance systems in the brain-implications for Alzheimer disease. Nat Rev Neurol, 2015. 11(8): p. 457-70.
2. Iliff, J.J., et al., A paravascular pathway facilitates CSF flow through the brain parenchyma and the clearance of interstitial solutes, including amyloid beta. Sci Transl Med, 2012. 4(147): p. 147ra111.
3. Benveniste, H., et al., The Glymphatic System and Waste Clearance with Brain Aging: A Review. Gerontology, 2019. 65(2): p. 106-119.
4. Evans, P.G., et al., Non-Invasive MRI of Blood-Cerebrospinal Fluid Barrier Function. Nat Commun, 2020. 11(1): p. 2081.
5. Perera, C., et al., Pharmacological MRI with Simultaneous Measurement of Cerebral Perfusion and Blood-Cerebrospinal Fluid Barrier Function using Interleaved Echo-Time Arterial Spin Labelling. Neuroimage, 2021. 238: p. 118270.
6. Ozturk, B.O., et al., Disparate volumetric fluid shifts across cerebral tissue compartments with two different anesthetics. Fluids Barriers CNS, 2021. 18(1): p. 1.
7. Provencher, S.W., Contin - a General-Purpose Constrained Regularization Program for Inverting Noisy Linear Algebraic and Integral-Equations. Computer Physics Communications, 1982. 27(3): p. 229-242.
8. Lee, H., et al., Quantitative Gd-DOTA uptake from cerebrospinal fluid into rat brain using 3D VFA-SPGR at 9.4T. Magn Reson Med, 2018. 79(3): p. 1568-1578.
9. Buxton, R.B., et al., A general kinetic model for quantitative perfusion imaging with arterial spin labeling. Magn Reson Med, 1998. 40(3): p. 383-96.
Figures