2334
White matter microstructure changes in a Bcan knockout mouse model1Wellcome Centre for Integrative Neuroimaging, FMRIB, Nuffield Department of Clinical Neurosciences, University of Oxford, Oxford, United Kingdom, 2Mouse Imaging Centre, Hospital for Sick Children, Toronto, ON, Canada, 3Department of Medical Biophysics, University of Toronto, Toronto, ON, Canada
Synopsis
Recent genome-wide association studies using UK Biobank brain imaging datasets showed associations between microstructural MRI measures in white matter and genetic loci of BCAN, a gene encoding a protein implicated in neurodegeneration and synaptic transmission. To investigate these associations, we acquired ex vivo MRI data in a Bcan knockout mouse model. Our results show significant differences in FA and T2* for some tracts in wild-type males compared to homozygous males, with consistent trends of higher FA and MD across WM tracts. Future histology work in the same brains will reveal the biological changes underpinning these differences.
Introduction
Recent genome-wide association studies (GWAS)1–3 using UK Biobank brain imaging datasets4 identified associations between imaging measures and genetic variants relating to genes encoding extracellular matrix (ECM) proteins. These associations involved microstructurally-relevant measures derived from diffusion MRI (dMRI), quantitative T2* and quantitative susceptibility mapping (QSM). Among ECM genes, genetic loci of BCAN associated with dMRI measures in white matter (WM), including fractional anisotropy (FA), mean diffusivity (MD) and NODDI’s5 intra-cellular volume fraction (ICVF). BCAN encodes the protein brevican, found exclusively in the brain, around neuronal soma, dendrites and the nodes of Ranvier6. Brevican is implicated in neurodegeneration7 and synaptic transmission8.To investigate these associations, we acquired ex vivo MRI data in a Bcan knockout mouse model. We hypothesise that these mutations will causally induce phenotypic changes in microstructural MRI. Our initial results show significant differences in FA and T2* for some tracts in wild-type (WT) males compared to Bcan homozygous (HOM) males, with consistent trends of higher FA and MD across WM tracts. Future work will acquire histology in these same brains to identify the biological changes underpinning the observed changes in the MR signal.
Methods
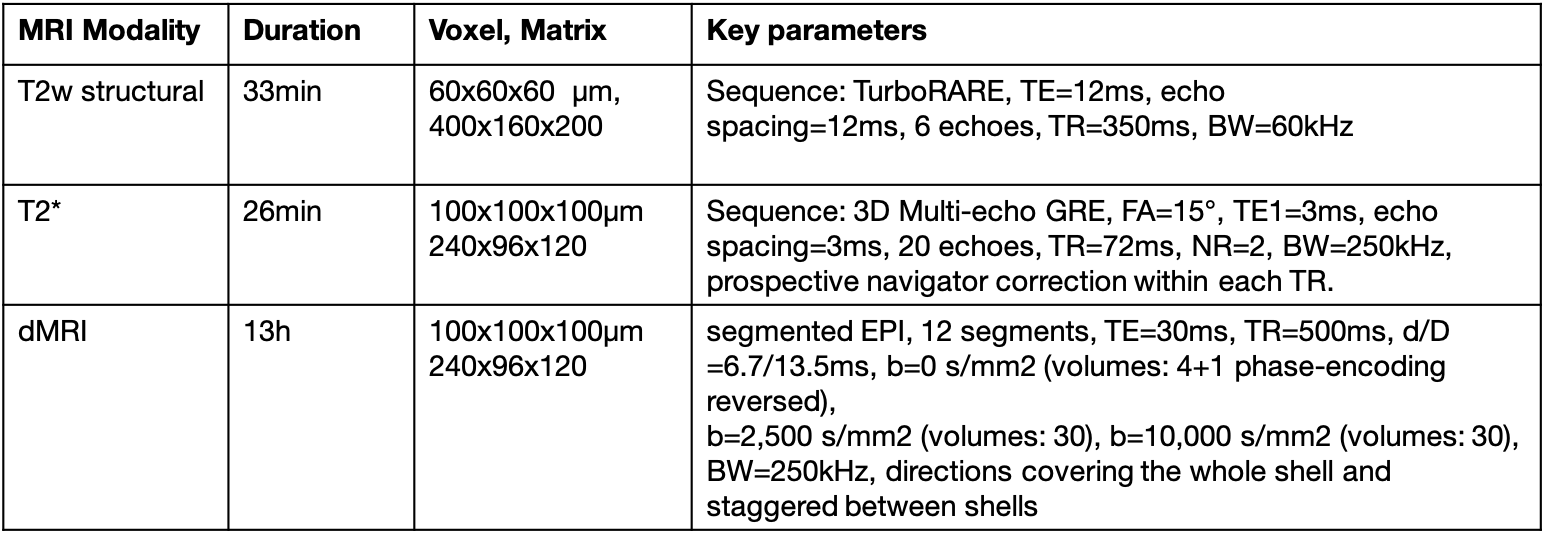
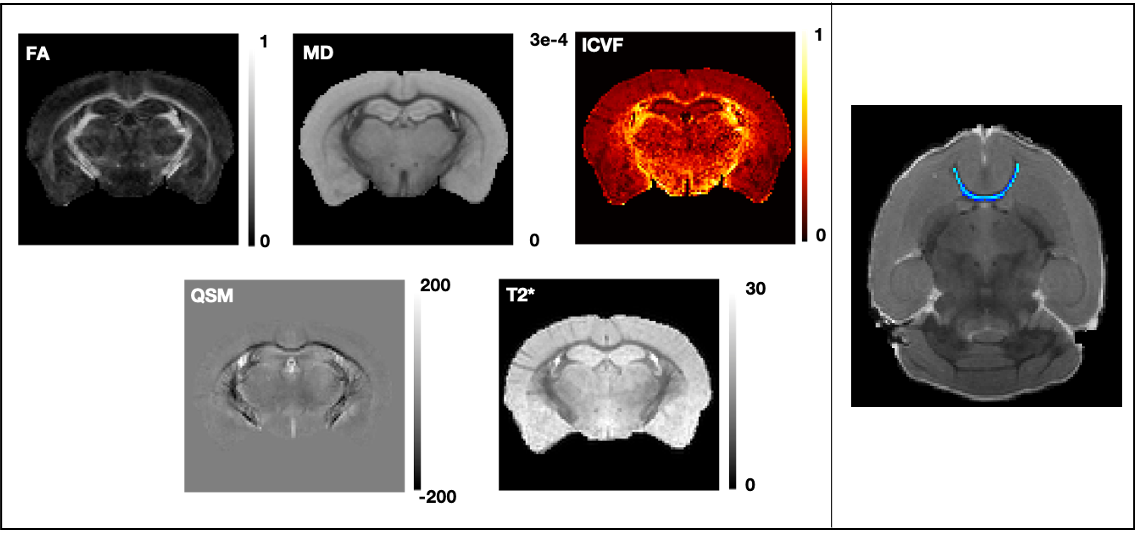
14 HOM Bcan C56BL6 (7M:7F) and 12 WT (7M:5F) mice were studied. 10-week-old adults were perfused with 4% formalin containing 2mM Gd-based contrast agent (GdCA, Gadovist). Brains were dissected, kept in skull, immersed in formalin/GdCA for 24h, and stored in PBS, GdCA and sodium azide (0.02%) at 4°C. dMRI and complex GRE data was acquired on a Bruker 7T scanner (BioSpec 70/20 USR, receive-only cryoprobe). Acquisition details are presented in the Table 1. Samples were scanned in Fluorinert in custom holders, vacuum pumped to eliminate intracranial bubbles, and kept at room temperature for ~24h before scanning and during the acquisition.The dMRI processing pipeline includes correction for 3D Gibbs ringing9, image distortion10 and eddy currents11. Diffusion tensor and NODDI models were fitted to the data using FSL’s DTIFIT and cuDIMOT12, respectively. NODDI fitting assumed dax=4.7x10⁻⁴, diso=1x10⁻³mm2/s (dax value optimised in a data-driven way using the spherical mean technique13) and included a dot compartment14. From these fits, we extracted FA, MD and ICVF maps (Figure 1). The average b=0s/mm2 was fed into an iterative group-wise registration15 and atlas-based segmentation16 pipeline.
The multi-echo GRE data was processed for T2* (magnitude) and QSM (phase) maps. The QSM pipeline17 included coil combination and phase offset removal, phase unwrapping, field map estimation, brain masking, background field removal (vSHARP18) and dipole inversion (iLSQR19). Susceptibility values were referenced to the whole-brain mean value. Magnitude images were corrected for Gibbs ringing9 and fit with a monoexponential T2* over all 20 echoes, averaged over the two repeats (Figure 1).
ROIs of major WM tracts were produced using tractography-based methods12,20 (for anterior commissure) or atlas-based segmentation outputs15 (for the other tracts). A FA threshold of 0.5 was used to exclude voxels with significant partial volume effects. In QSM, myelin anisotropy induces variation driven by the orientation of fibres with respect to B021. For QSM, we therefore kept voxels that are within 30° of the plane perpendicular to the B0 direction, calculated from the principal diffusion direction. We computed median values within each tract of interest for each parametric map in native space and compared these values between HOMs and WTs, separately for males and females. PALM22 was used for non-parametric permutation testing using family-wise error correction across contrasts, modalities and sexes.
The T2w structural datasets were 3D Gibbs-corrected9, registered15, and used for atlas-based segmentation16. We assessed volumetric differences between HOMs and WTs23. A linear model was used to relate volumes of labelled brain structures as a function of genotype and sex.
Results
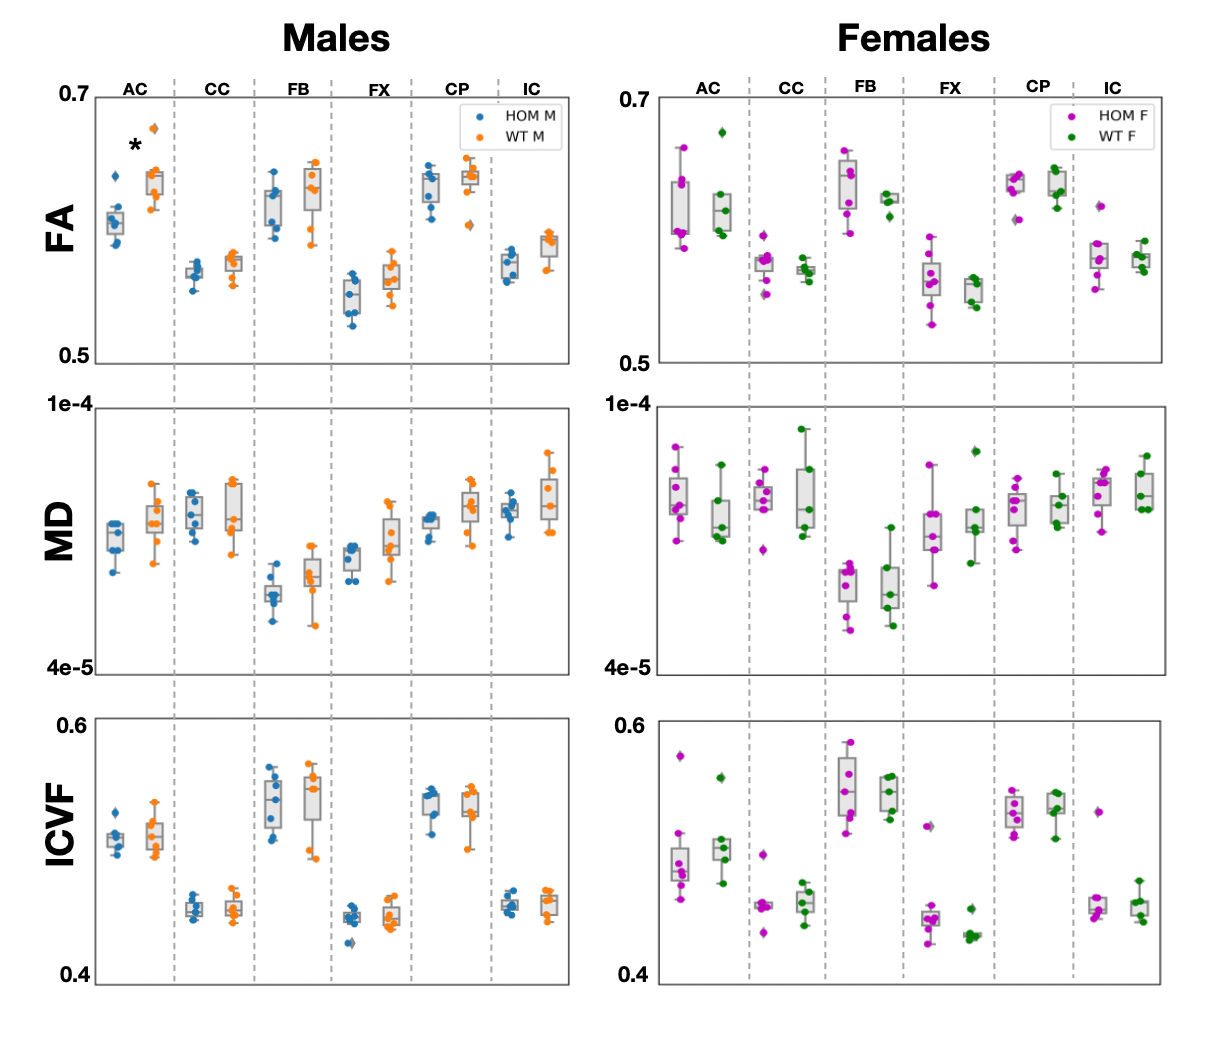
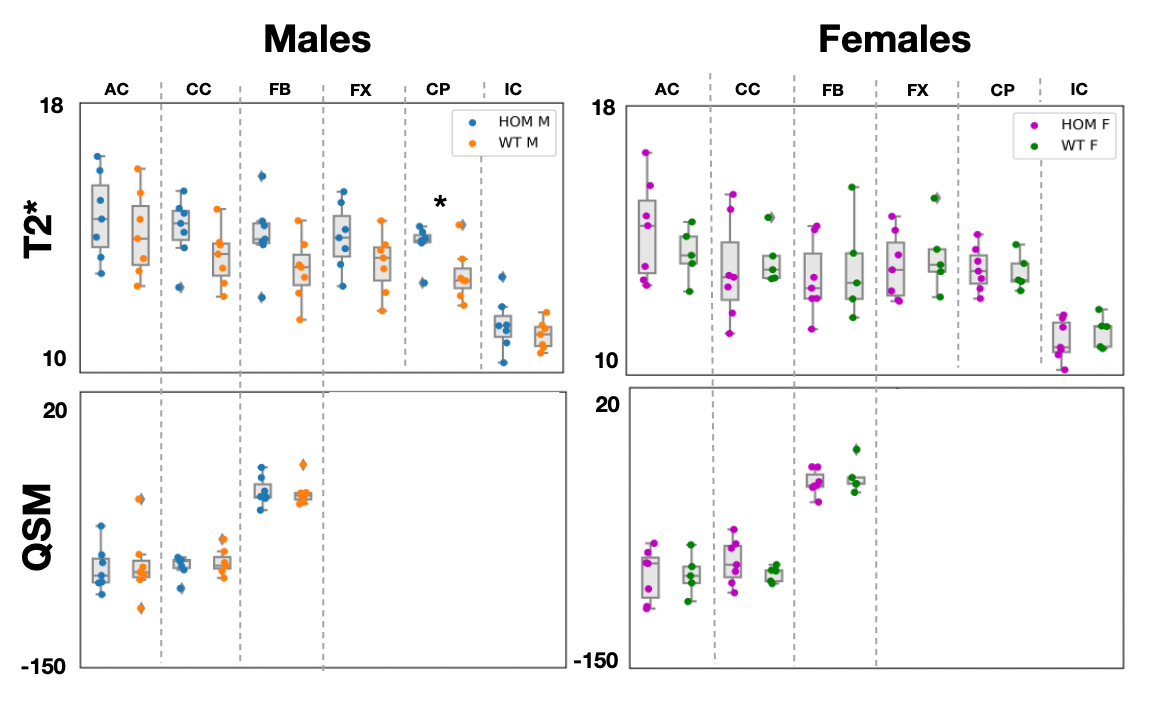
Significant differences (p-value=0.04) were observed in FA values in males in the anterior commissure (Figure 2). Consistent trends of higher FA values in males were observed across all tracts, with MD following similar trends. Significant differences (p-val=0.02) were observed in T2* values in the cerebral peduncle (Figure 3), with T2* values consistently lower in WT males compared to HOMs. QSM revealed no significant results. Our multiple comparison correction was done across 4 contrasts (assessing differences between males and females), 5 modalities and the 6 tracts of interest. We did not observe any significant differences in females. No significant differences were observed in the volumetric analysis, showing that the above differences are due to variations in microstructure and not partial volume.Discussion and Conclusions
GWAS cannot reveal the causal variants of the uncovered associations between phenotype and genotype. Rodent models can be helpful in understanding these associations through causal genetic manipulations. Here, we acquired ex vivo dMRI, QSM/T2* and structural T2w data in a Bcan knockout mouse model and showed that the absence of the brevican protein causally induces WM microstructure changes that can be quantified by different imaging modalities. We showed significant differences in FA in the anterior commissure, and in T2* in the cerebral peduncle in males, with trends of higher FA and lower T2* observed across all tracts. The lack of significant results in females is yet unexplained and may be related to sexually dimorphic hormone-dependent compensatory mechanisms, as reported in previous studies24.Acknowledgements
Aurea Martins-Bach and Karla Miller contributed equally to this work. This work was supported by the Wellcome Trust (grant 202788/Z/16/Z), the Engineering and Physical Sciences Research Council and Medical Research Council (grant EP/L016052/1). The Wellcome Centre for Integrative Neuroimaging is supported by core funding from the Wellcome Trust (203139/Z/16/Z).References
1. Elliott, L. T. et al. Genome-wide association studies of brain imaging phenotypes in UK Biobank. Nature 562, 210 (2018).
2. Wang, C. et al. Phenotype and genetic associations of quantitative magnetic susceptibility in UK Biobank brain imaging. (2021).
3. Smith, S. M. et al. An expanded set of genome-wide association studies of brain imaging phenotypes in UK Biobank. Nat. Neurosci. (2021) doi:10.1038/s41593-021-00826-4.
4. Miller, K. L. et al. Multimodal population brain imaging in the UK Biobank prospective epidemiological study. Nat. Neurosci. (2016) doi:10.1038/nn.4393.
5. Zhang, H., Schneider, T., Wheeler-Kingshott, C. A. & Alexander, D. C. NODDI: Practical in vivo neurite orientation dispersion and density imaging of the human brain. Neuroimage (2012) doi:10.1016/j.neuroimage.2012.03.072.
6. Fawcett, J. W., Oohashi, T. & Pizzorusso, T. The roles of perineuronal nets and the perinodal extracellular matrix in neuronal function. Nature Reviews Neuroscience (2019) doi:10.1038/s41583-019-0196-3.
7. Nandadasa, S., Foulcer, S. & Apte, S. S. The multiple, complex roles of versican and its proteolytic turnover by ADAMTS proteases during embryogenesis. Matrix Biology (2014) doi:10.1016/j.matbio.2014.01.005.
8. Brakebusch, C. et al. Brevican-Deficient Mice Display Impaired Hippocampal CA1 Long-Term Potentiation but Show No Obvious Deficits in Learning and Memory. Mol. Cell. Biol. (2002) doi:10.1128/mcb.22.21.7417-7427.2002.
9. Bautista, T., O’Muircheartaigh, J., Hajnal, J. V & J-D, T. Removal of Gibbs ringing artefacts for 3D acquisitions using subvoxel shifts. in Proc. Intl. Soc. Mag. Reson. Med. 3535 (2021).
10. Andersson, J. L. R., Skare, S. & Ashburner, J. How to correct susceptibility distortions in spin-echo echo-planar images: Application to diffusion tensor imaging. Neuroimage (2003) doi:10.1016/S1053-8119(03)00336-7.
11. Andersson, J. L. R. & Sotiropoulos, S. N. An integrated approach to correction for off-resonance effects and subject movement in diffusion MR imaging. Neuroimage (2016) doi:10.1016/j.neuroimage.2015.10.019.
12. Hernandez-Fernandez, M. et al. Using GPUs to accelerate computational diffusion MRI: From microstructure estimation to tractography and connectomes. Neuroimage (2019) doi:10.1016/j.neuroimage.2018.12.015.
13. Kaden, E., Kelm, N. D., Carson, R. P., Does, M. D. & Alexander, D. C. Multi-compartment microscopic diffusion imaging. Neuroimage (2016) doi:10.1016/j.neuroimage.2016.06.002.
14. Alexander, D. C. et al. Orientationally invariant indices of axon diameter and density from diffusion MRI. Neuroimage (2010) doi:10.1016/j.neuroimage.2010.05.043.
15. Friedel, M., van Eede, M. C., Pipitone, J., Mallar Chakravarty, M. & Lerch, J. P. Pydpiper: A flexible toolkit for constructing novel registration pipelines. Front. Neuroinform. (2014) doi:10.3389/fninf.2014.00067.
16. Chakravarty, M. M. et al. Performing label-fusion-based segmentation using multiple automatically generated templates. Hum. Brain Mapp. (2013) doi:10.1002/hbm.22092.
17. Wang, C. et al. Methods for quantitative susceptibility and R2* mapping in whole post-mortem brains at 7T applied to amyotrophic lateral sclerosis. Neuroimage 222, 117216 (2020).
18. Özbay, P. S. et al. A comprehensive numerical analysis of background phase correction with V-SHARP. NMR Biomed. (2017) doi:10.1002/nbm.3550.
19. Li, W. et al. A method for estimating and removing streaking artifacts in quantitative susceptibility mapping. Neuroimage (2015) doi:10.1016/j.neuroimage.2014.12.043.
20. Hernández, M. et al. Accelerating Fibre Orientation Estimation from Diffusion Weighted Magnetic Resonance Imaging Using GPUs. PLoS One (2013) doi:10.1371/journal.pone.0061892.
21. Xu, T., Foxley, S., Kleinnijenhuis, M., Chen, W. C. & Miller, K. L. The effect of realistic geometries on the susceptibility-weighted MR signal in white matter. Magn. Reson. Med. (2018) doi:10.1002/mrm.26689.
22. Winkler, A. M., Ridgway, G. R., Webster, M. A., Smith, S. M. & Nichols, T. E. Permutation inference for the general linear model. Neuroimage (2014) doi:10.1016/j.neuroimage.2014.01.060.
23. Lerch, J. P., Sled, J. G. & Henkelman, R. M. MRI phenotyping of genetically altered mice. Methods Mol. Biol.(2010) doi:10.1007/978-1-61737-992-5_17.
24. Howell, M. D., Torres-Collado, A. X., Iruela-Arispe, M. L. & Gottschall, P. E. Selective Decline of Synaptic Protein Levels in the Frontal Cortex of Female Mice Deficient in the Extracellular Metalloproteinase ADAMTS1. PLoS One (2012) doi:10.1371/journal.pone.0047226.
Figures